
 Open Access Article
 This Open Access Article is licensed under a
 Creative Commons Attribution 3.0 Unported Licence
Determining the structure of zeolite frameworks at high pressures†
Lisa A.
Price
a,
Chris J.
Ridley
 b,
Craig L.
Bull
b,
Stephen A.
Wells
a and
Asel
Sartbaeva
*a
b,
Craig L.
Bull
b,
Stephen A.
Wells
a and
Asel
Sartbaeva
*a
aDepartment of Chemistry, University of Bath, Bath, UK. E-mail: A.Sartbaeva@bath.ac.uk
bSTFC ISIS Neutron and Muon Facility, Rutherford Appleton Laboratory, Harwell, UK
First published on 20th July 2021
Abstract
The study of porous materials under high-pressure conditions is crucial for the understanding and development of structure–property relationships. Zeolites are a diverse class of microporous materials with an extensive range of properties and applications, which can be attributed to their unique pore systems, channel dimensions and mechanical stability. Due to their complex frameworks and compositions, determining the structures of zeolite materials at high pressures is particularly challenging. Here, we present our method which involves geometric modelling, implemented in GASP (Geometric Analysis of Structural Polyhedra) software, to obtain crystal structures at high-pressures when Rietveld refinements alone fall short. We show that GASP can be used to simulate theoretical compression mechanisms of zeolite frameworks at the atomic level, providing optimised structural models as reasonable starting points for full crystal structure analysis. Finally, we discuss the potential of geometric modelling to predict high-pressure behaviour of other known and hypothetical structures, which may find use in future applications. We anticipate that GASP software will be a powerful tool that can assist in determining the crystal structures of zeolite frameworks at high pressures.
1 Introduction
Zeolites are a remarkably versatile class of crystalline, microporous materials, that are now well-established in the fields of catalysis, ion-exchange, and adsorption–separation. Their success in such a wide range of industrial sectors is a direct consequence of their flexible, open framework structures that are built up of corner sharing [SiO4]4− and [AlO4]5− tetrahedra. Studying how different zeolite frameworks respond to high pressure conditions is of great importance for their practical applications. For example, compression can drastically alter pore geometries, increase the selective uptake of guest materials, improve accessibility and diffusion to catalytic sites, and even induce chemical reactions and polymerization of small molecules in the channel systems.1 In some cases, pressure-induced amorphization (PIA), pressure induced hydration (PIH) or reconstructive phase transitions can occur, making it possible to access new, high-pressure structures with enhanced properties.2,3In this study, we explore compression mechanisms of synthetic, large pore, Linde type L zeolites (K–L) with the LTL framework type. The unit-cell is hexagonal, with space group P6/mmm, and ideal chemical formula |K+9|[Al9 Si27 O72]. The framework is comprised of uniform, one dimensional (1D) channel systems that run parallel to the crystallographic c-axis [001], Fig. 1a. The largest of these are formed from 12-membered rings (12MR) of Al/SiO4 tetrahedra that are interconnected by smaller, elliptical 8-membered ring channels (8MR). In terms of CBU's, the 12MR channels can be described as stacks of ltl cages surrounded by columns of alternating cancrinite cages (can) and double-six-ring (d6r) units, Fig. 1b.4 With their freely accessible pores (12MR diameters 7 Å), LTL-type zeolites are considered ideal host systems for dye molecules, chromophores, organic materials and metals. In fact, their channel systems can direct the assembly of guest molecules, and this has led to the discovery of new, composite materials with catalytic, photochemical and optical properties.5,6 It follows that channel deformations at high pressures may also lead to the irreversible incorporation and reorganisation of guest species. Understanding the impact of extra-framework content on the pressure stability and flexibility of LTL-type zeolites is crucial if we are to discover new phenomena, which may be inaccessible under ambient conditions.
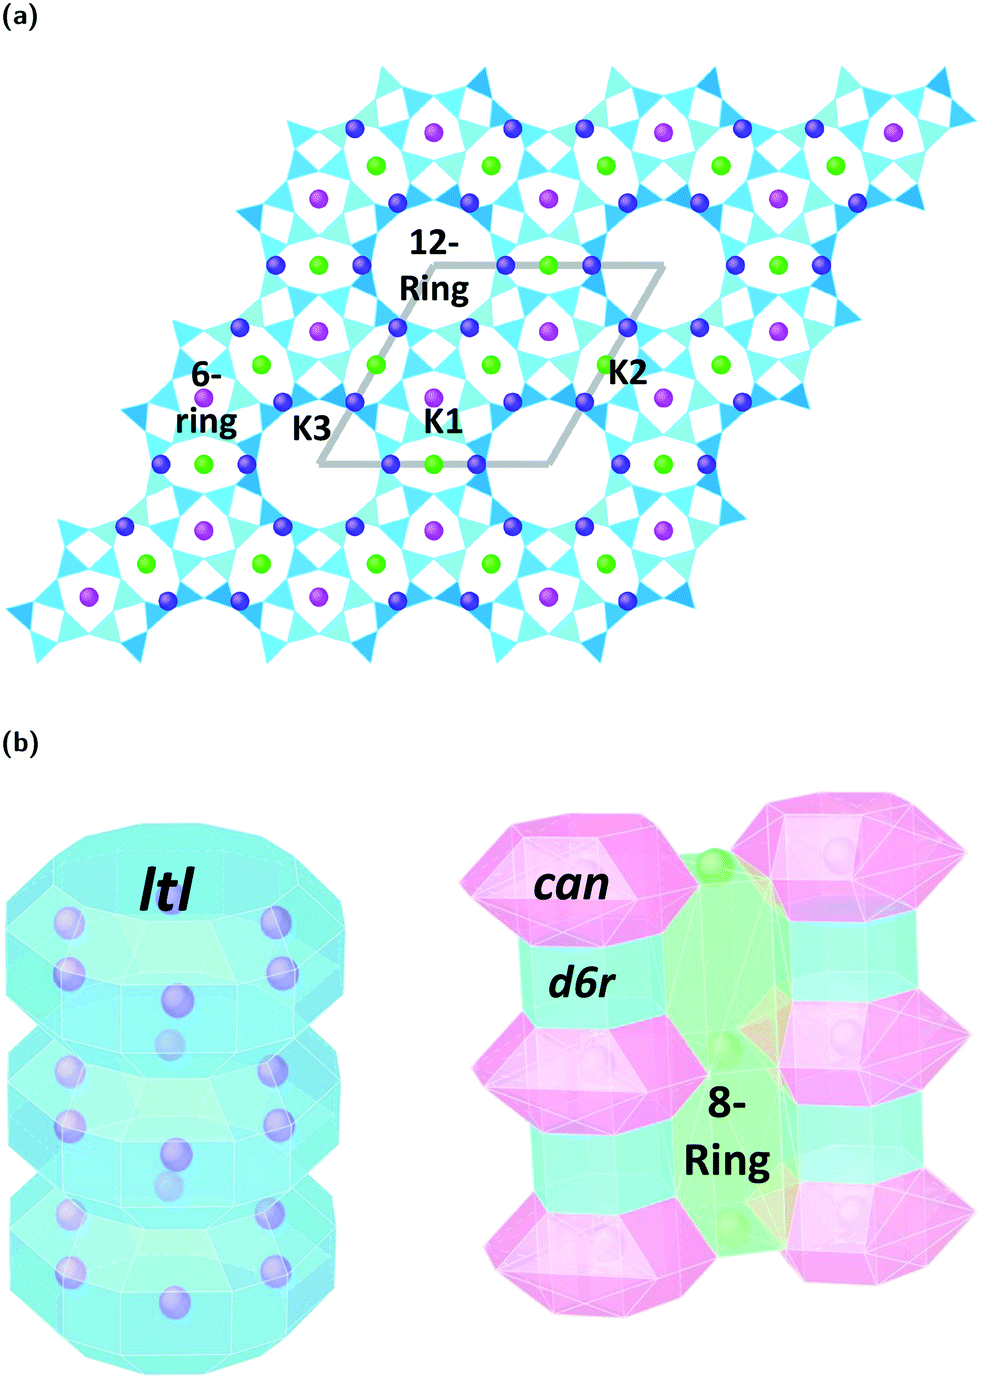 | ||
| Fig. 1 Crystal structure of the dehydrated Linde type L zeolite (LTL framework type), viewed (a) down [001] axis in polyhedral form and (b) down [100] axis showing the arrangement of composite building units (CBU's), ltl cages, can cages and d6r units. Si/AlO4 tetrahedra are shown in blue and one unit cell is outlined in grey. Extra-framework potassium sites are labelled as K1, K2 and K3. K1 sites (pink) are located in the can cages, K2 sites (green) are in the 8 membered rings (8MR) and K3 sites (purple) are located in the ltl cages that form the 12-ring channel systems. | ||
Neutron diffraction techniques under extreme conditions have become increasingly sophisticated.7–9 However, analysis of data at high-pressures is often challenging and it is difficult to extract information from Rietveld refinements alone, particularly for porous zeolites materials which have weakly scattering compositions, complex structures that are often low symmetry and have disordered arrangements of extra-framework cations. Data quality is also compromised due to the requirement of small sample volumes and large pressure cells, which can cause high attenuation, restrict access to reciprocal space and contribute to background signals that produce overlapping peaks and cause significant peak broadening. At higher pressures, unit-cell indexing and refinement becomes increasingly difficult. Here, computational techniques become valuable accompaniments to experimental data. Geometric modelling, in particular, has an advantage over the more classical methods, such as molecular dynamics, as it is a convenient and straightforward way of quickly simulating compression mechanisms of zeolite frameworks at the atomic level, whilst still providing a close fit to experimental data. By only considering the most local interactions, such as TO4 bonding (where T = Si/Al) and steric effects, a frameworks response to pressure can effectively be described in terms of polyhedral rotations, whilst avoiding long-range interactions. Our previous studies using geometric simulations have proven to be successful in rationalising the framework flexibility of ANA, EDI, LEV, SOD, FAU, EMT, RHO and KFI zeolite framework types under high pressure conditions.10–17 We have also applied geometric simulations to define a theoretical property called the flexibility window.18 This is an intrinsic feature common to all known zeolite frameworks. It is the range of unit-cell densities within which the TO4 framework tetrahedra can be made geometrically regular, with minimal variations from the ideal O–T–O angle of 109.5° and average T–O bond length, ranging from 1.61 Å for Si–O bonds to 1.75 Å for Al–O bonds. Experimentally observed pressure-induced phenomena, such as phase transitions and PIA have been associated with a framework reaching the high-density limit of its flexibility window.19–21
Here, we present our GASP-Rietveld method for determining the crystal structures of zeolite frameworks at high pressures, when Rietveld refinements alone are not possible, Fig. 2. Our approach involves geometric modelling, implemented in GASP software (Geometric Analysis of Structural Polyhedra).22 Experimental lattice parameters are used to simulate geometrically optimised, high-pressure structures which can then be refined using diffraction data. In this work, we apply our method to investigate the effect of channel content on compression mechanisms of the LTL framework. Experiments were conducted at ISIS Neutron and Muon Source, UK. We used time-of-flight (ToF) neutron diffraction to measure changes in the structure of zeolite K–L up to pressures of 4 GPa, using Fluorinert and a 4![[thin space (1/6-em)]](https://www.rsc.org/images/entities/char_2009.gif) :1 mixture of perdeuterated methanol and ethanol (m.e.) as non-penetrating and penetrating pressure transmitting media (PTM), respectively. Finally, we discuss the flexibility window22,23 as a foundation supporting this approach.
:1 mixture of perdeuterated methanol and ethanol (m.e.) as non-penetrating and penetrating pressure transmitting media (PTM), respectively. Finally, we discuss the flexibility window22,23 as a foundation supporting this approach.
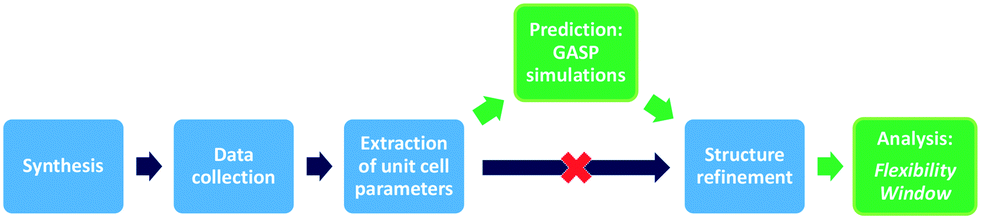 | ||
| Fig. 2 GASP-Rietveld method: schematic illustrating how GASP software can be used to overcome some of the challenges associated with structure refinement at high-pressures. The traditional approach is shown in blue and our new steps of structure prediction and analysis are highlighted in green. | ||
2 Results
2.1 Crystal structure of K–L at ambient pressure
Fig. 3a–c show ToF powder neutron diffraction data and associated Rietveld refinement profiles for dehydrated K–L at ambient pressure. Analysis by energy dispersive X-ray spectroscopy (EDX) yielded the following chemical composition, |K+8.4|[Al8.4 Si27.6 O72]. K+ ions in the unit cell are located at three crystallographic sites, coordinated to six framework oxygen atoms. K1 sites are located at the centres of the can cages, K2 sites are found in the centre of the 8MR channels at z = 1/2 and K3 sites reside in the ltl cages. These sites are labelled in Fig. 1a. Our refined crystal structure is in close agreement with that of dehydrated K–L reported by Newsam.24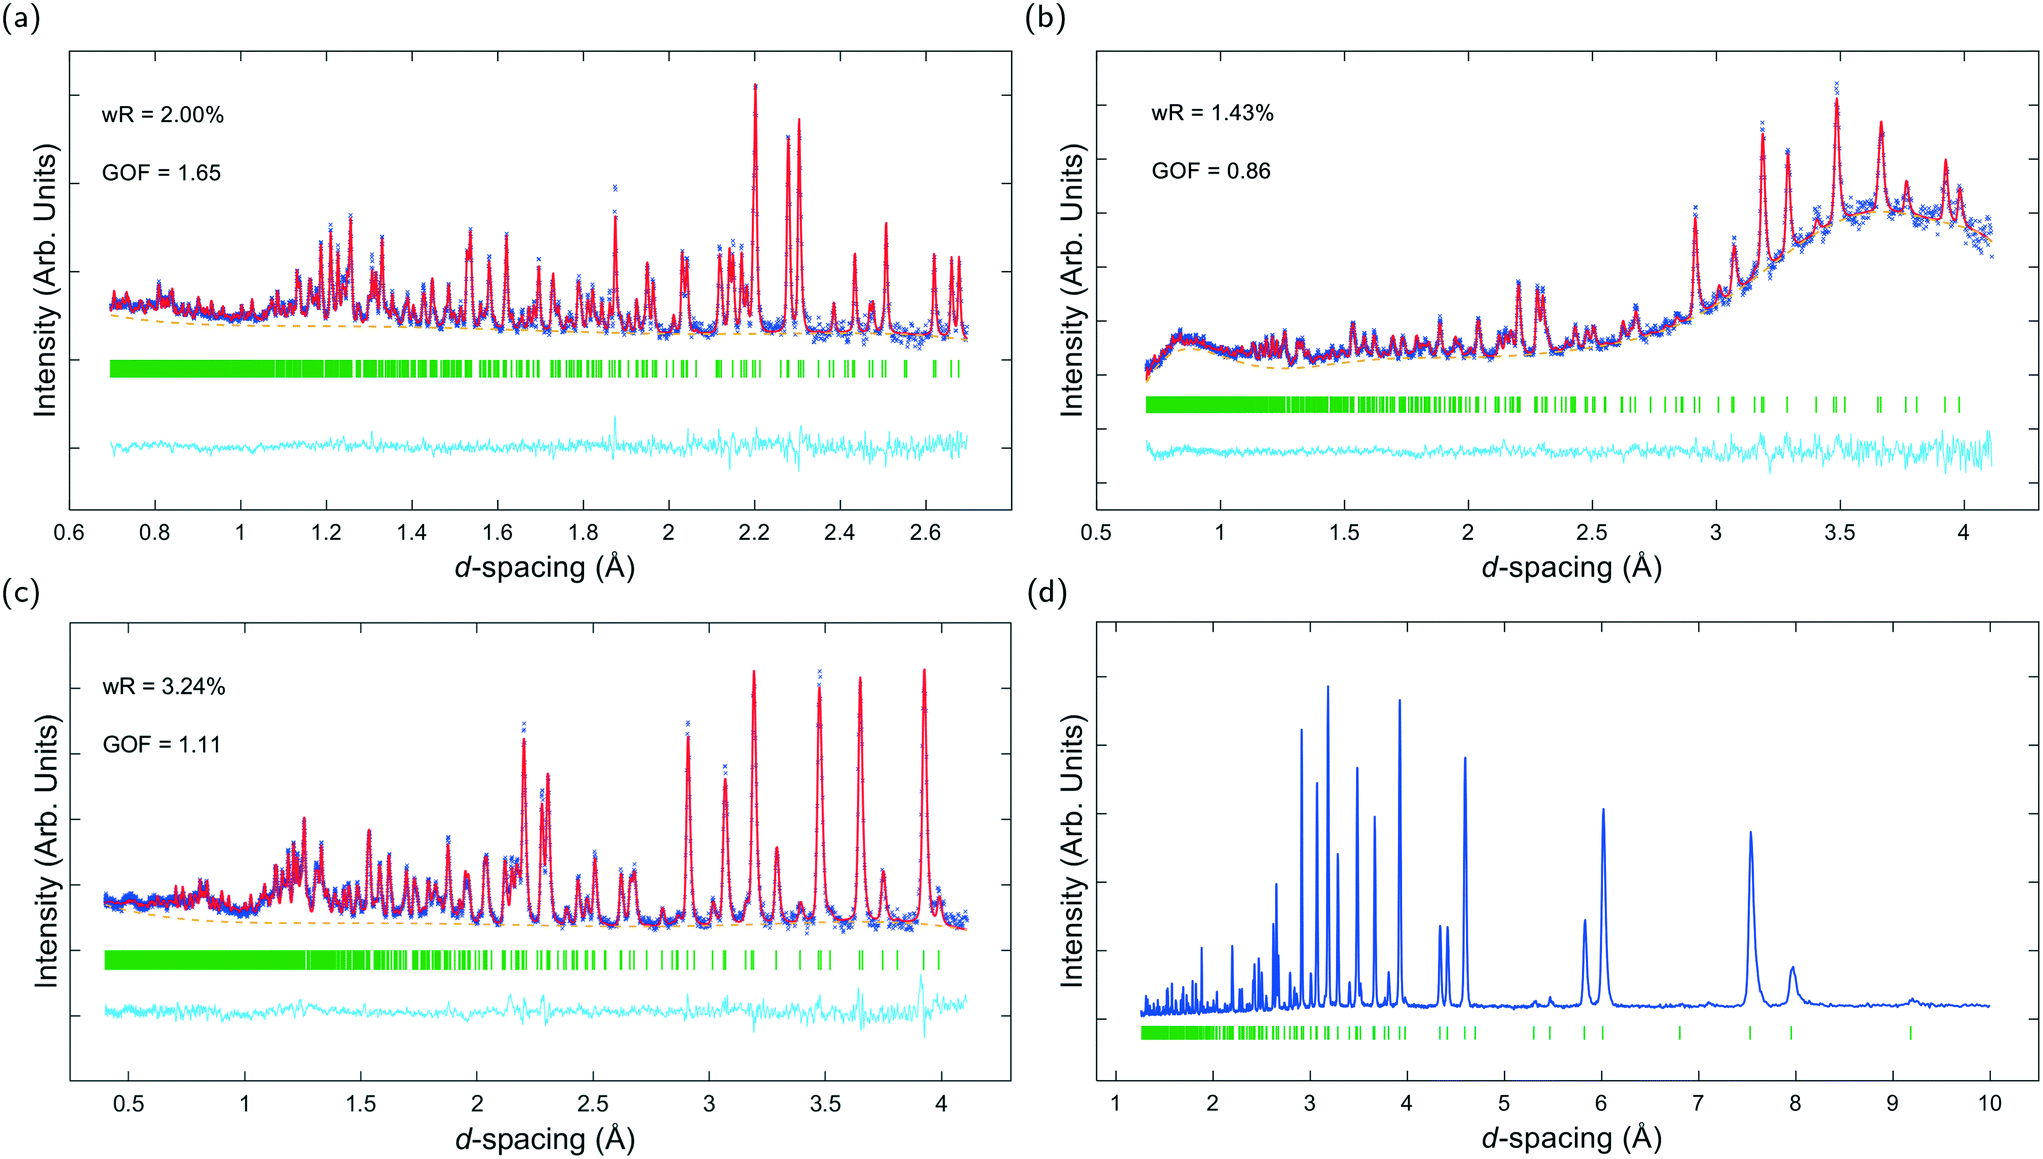 | ||
| Fig. 3 Diffraction data for K–L samples collected at ambient pressure. (a–c) ToF neutron diffraction data and associated Rietveld refinement profiles for dehydrated K–L. (a) Shows data collected on the POLARIS neutron diffractometer (data shown is from backscattering detector). (b & c) Show data collected on the PEARL neutron diffractometer with and without m.e., respectively. Observed and calculated profiles are shown as blue crosses and red lines, respectively. Backgrounds are plotted with orange dotted lines. The residual (observed minus calculated intensity) plot is shown below as a cyan line and Bragg reflections for K–L are marked with vertical green bars. (d) Shows indexed powder X-ray diffraction (PXRD) data for characterisation of as-synthesised, hydrated K–L samples. | ||
Refinement of K–L with penetrating media shows that guest molecules occupy extra-framework sites in the 12 MR channels. Some of these sites are 2.5–3.1 Å from framework oxygen atoms and K3 cations, suggesting possible hydrogen bonding and electrostatic interactions. The a-axial length becomes slightly shorter, and the c-axial length slightly longer upon penetration, seemingly due to an increase in these guest–host interactions. Full Rietveld refinement statistics and crystal structures for K–L at ambient pressure are given in the ESI.† CSD deposition numbers 2083646–2083655 also contain crystallographic data for all refined K–L structures.
2.2 Compression data
In both penetrating and non-penetrating media, zeolite K–L retains P6/mmm symmetry and does not undergo complete amorphisation up to the highest investigated pressure of 4.24 GPa. Despite the small number of pressure points, bulk moduli and compressibilities have been calculated using the web-based tool PASCal.25 Experimental data are shown in the ESI,† Fig. S1(a) and (b).2.3 Non-penetrating media
From Pamb to 4.15(4) GPa, the unit-cell volume of empty K–L decreases by 12.9%, with Δa = −4.3% and Δc = −5.1%, Fig. 4a. Volume–pressure data was fitted from Pamb to 1.71(2) GPa, to account for the hydrostatic pressure range for Fluorinert, which is limited to pressures below 2.3 GPa.26 In this pressure range, the unit-cell volume decreases by 4.2%, with Δa = −1.3% and Δc = −1.7%. A second-order Birch–Murnaghan equation-of-state (II-BM-EoS),27 with an implied B′ = 4, provided the best fit to experimental data, giving a refined bulk modulus, B0, of 37(1) GPa with V0 = 2203(2) Å3. Since the bulk modulus values determined for zeolites with non-penetrating PTM range from 15 to 70 GPa, the empty K–L framework can be classified as one of the most compressible zeolites.28 The calculated principal axes of compression (K) coincide with the hexagonal unit-cell axes, which decrease linearly with increasing pressure. A II-BMEoS yields the following axial elastic parameters for empty K–L: Kc = 10.8(8) TPa−1 and Ka/b = 7.3(8) TPa−1. These K values indicate slight anisotropic compression of the lattice parameters, with the c-axial length decreasing at a slightly faster rate with respect to pressure, Fig. 4b.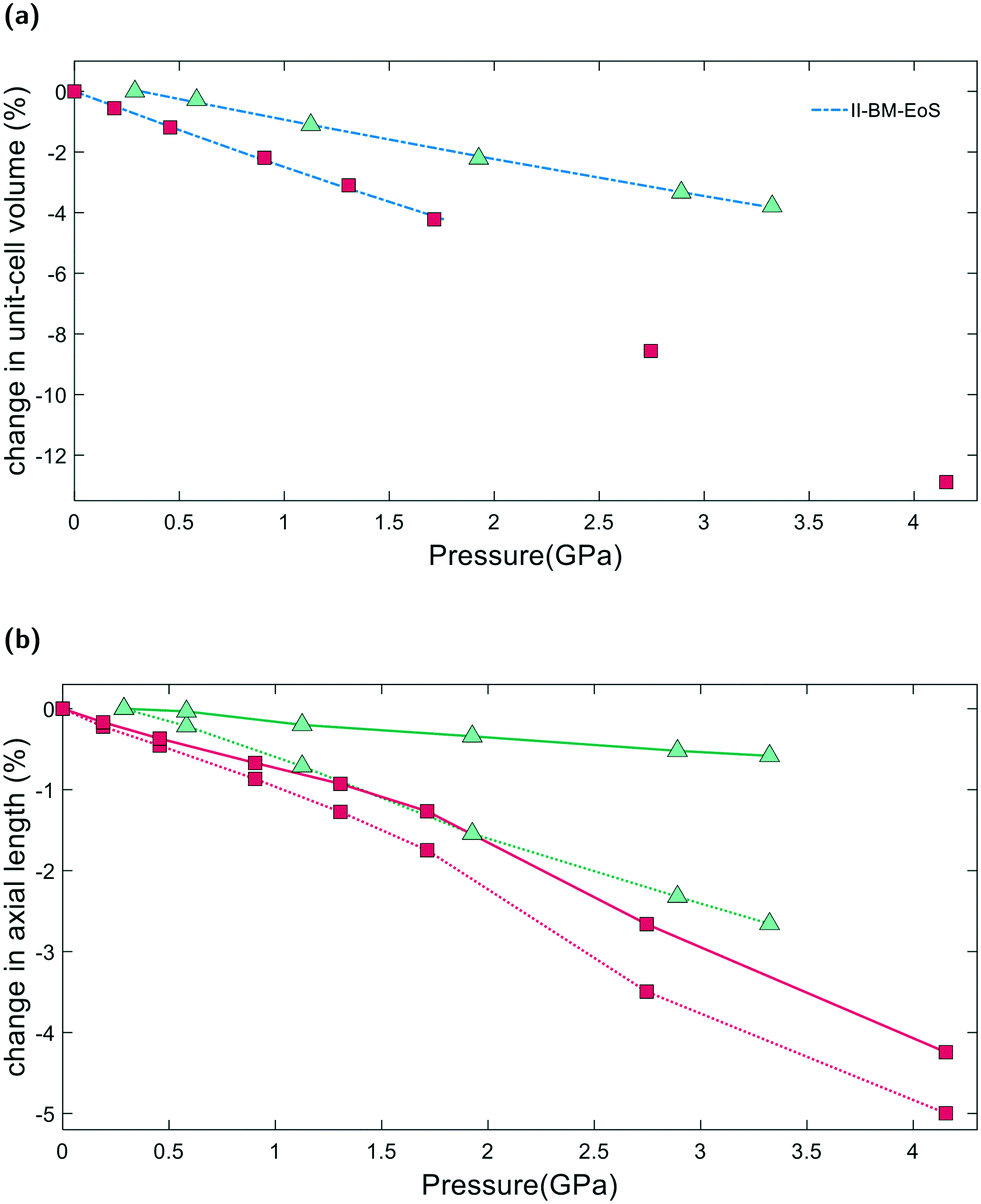 | ||
| Fig. 4 Pressure dependence of K–L lattice parameters using non-penetrating (red squares) and penetrating (green triangles) pressure media. (a) Shows unit-cell volume–pressure data fitted with II-BM-EoS and (b) shows changes in unit-cell parameters. Solid and dotted lines are drawn as a guide to the eye, distinguishing the a and c-lattice parameters, respectively. Compression data for K–L in penetrating media are calculated with respect to the filled structure at 0.29(2) GPa. | ||
2.4 Penetrating media
From Pamb to 3.32(4) GPa, the unit-cell volume reduction with respect to the empty K–L framework is 4.2%. Upon closer inspection, however, we see that from Pamb to 0.29(2) GPa, the c-axial length initially increases, Δc = +0.2%. Penetration of guest molecules from the PTM into the zeolite channels causes a significant change in the observed compressibility. From 0.29(2) to 3.32(4) GPa, the unit-cell volume contraction is 3.8% and the unit-cell axes display strong anisotropic compression behaviour, with Δc = −2.7% and Δa = −0.6%, highlighted in Fig. 4b. Volume–pressure data, shown in Fig. 4a, were fitted from 0.29(2) to 3.32(4) GPa using II-BM-EoS, to account for the different compressibility observed once the framework channels are filled. The refined bulk modulus was calculated to be B0 = 70(1), with V0 = 2204(1) Å3. A linearized II-BMEoS yields the following axial elastic parameters: Kc = 8.9(1) TPa−1 and Ka/b = 1.7(4) TPa−1. Here, Kc coincides with the unit-cell c-axis, but Ka/b are parallel with the [110] crystal axis.2.5 GASP simulations and the flexibility window
The LTL framework contains two crystallographically distinct T sites, labelled as T1 and T2 in Fig. 5. T1 sites form the 12-rings and T2 sites form the smaller d6r and can units. Six distinct T–O–T angles are also identifiable in the framework. T1–O1–T1 and T1–O2–T1 are angles in the 12-rings, T2–O3–T2 and T2–O5–T2 are angles in the 6-rings, and T2–O6–T2 and T2–O4–T1 are angles in the 4-rings. Full structural parameters at each pressure point are reported in the ESI.† Here, pore ellipticity, (ε), has been calculated by longest/shortest O–O distances of the ring.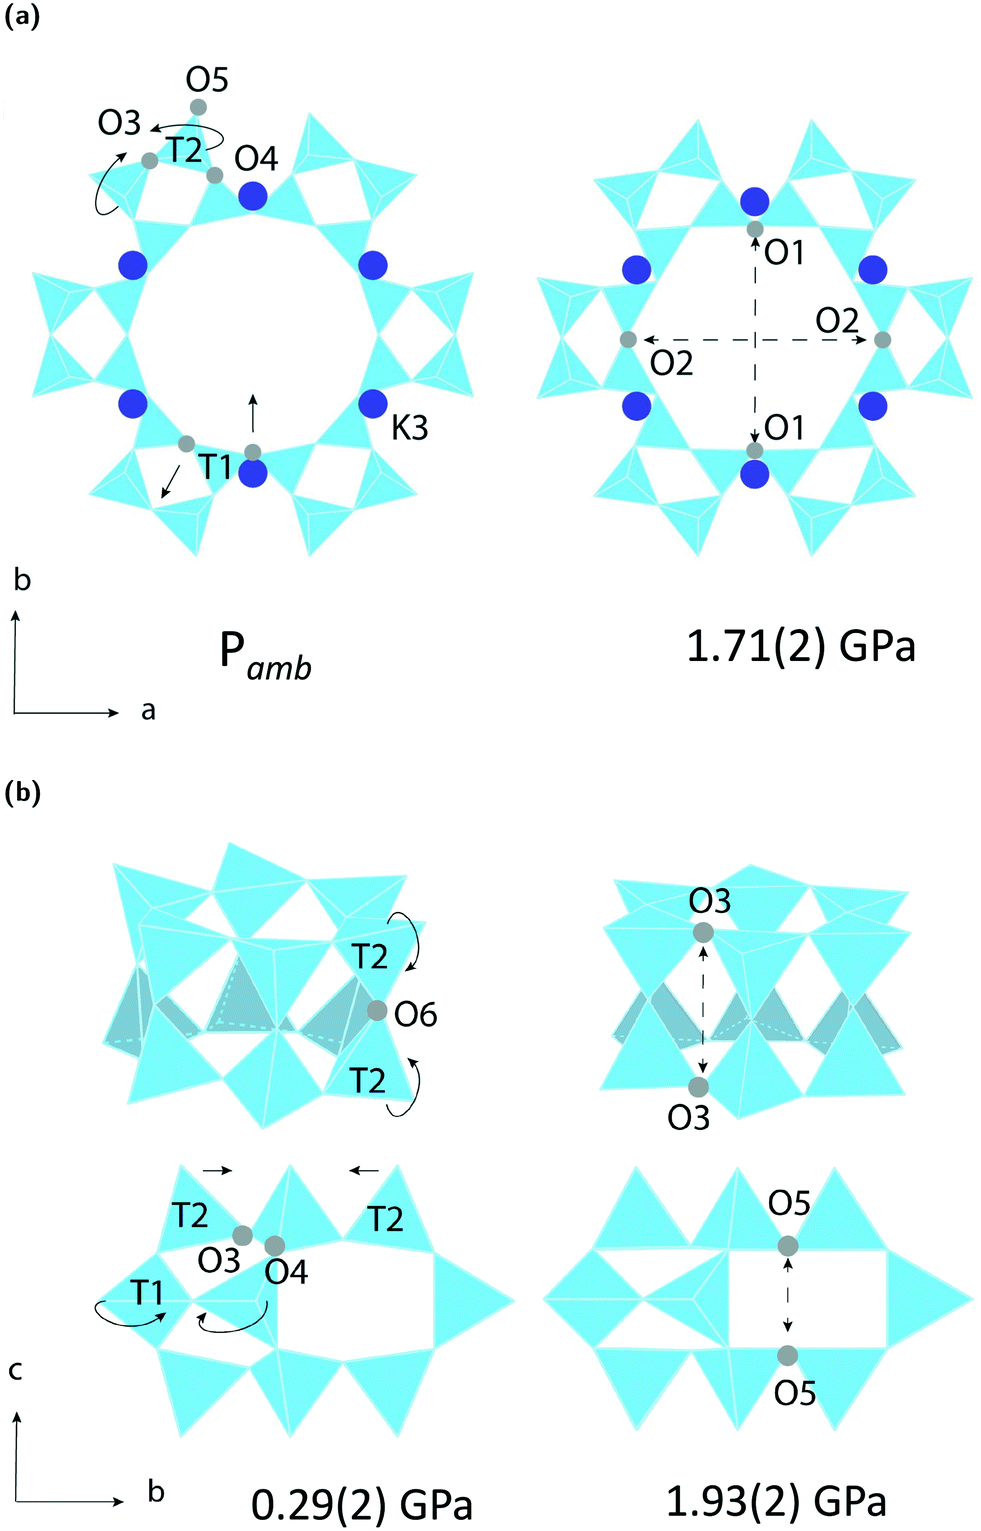 | ||
| Fig. 5 Simulated compression mechanisms of K–L in (a) non-penetrating media and (b) penetrating media. Solid arrows show pressure-induced anti-rotations of adjacent T1 and T2 sites in equal and opposite directions. Dotted arrows indicate a decrease in size across channel apertures. (a) Shows the empty framework compressing via its 12MR channels, along the crystallographic a-axis and (b) shows the filled framework compressing via its d6r and can units, along the crystallographic c-axis. | ||
The theoretical flexibility window of K–L is shown in Fig. 6, defined in the two-dimensional space of a hexagonal unit-cell, with the ambient structure located at the origin. Here, the a and c axial lengths are the variable parameters. The flexibility window of a framework is found by systematically varying the lattice parameters in all directions and optimising the geometry of the structure. This is done using GASP's window search function. An example window-search script is given in the ESI.† Within the flexibility window region (shaded light grey), there is minimal strain on the framework and all tetrahedral bond lengths and angles are fully relaxed at 1.642(1) Å and 109.5(1)°, respectively. This particular T–O bond length represents a random distribution of silicon and aluminium in the K–L framework, assuming bond lengths for Si–O and Al–O to be 1.61 and 1.75 Å, respectively and accounting for a Si/Al ratio of 3.3. The window edges (dark grey points) define the limits of geometric optimisation for this framework type. The unit-cell cannot be compressed or expanded beyond these edges without steric clashes occurring between oxygen atoms or distortion of TO4 units and bond lengths. There is a geometric incentive for a framework to remain within the confines of its flexibility window upon compression. Outside of the flexibility window region, the framework is already geometrically ‘stressed’ and compression here would come with a higher energetic cost. We can use this theory to rationalise the high-pressure behaviour of zeolite materials in terms of the rigid-unit model.10,29 This has previously been successful in studying EDI and LEV-type zeolites.10 Within the flexibility window, it is predicted that the zeolite framework will accommodate pressures by varying flexible, inter-tetrahedral (T–O–T) bond angles first, whilst individual tetrahedra behave as rigid-units. This forms the basis of our GASP-Rietveld approach. Starting from the refined K–L structure at Pamb, geometrically relaxed models were simulated at each pressure point plotted in Fig. 6. An example of a GASP input file used for a single-point geometric relaxation is given in the ESI.† Compression mechanisms were then quantified in terms of rigid TO4 rotations with respect to the ambient framework, illustrated in Fig. 5.
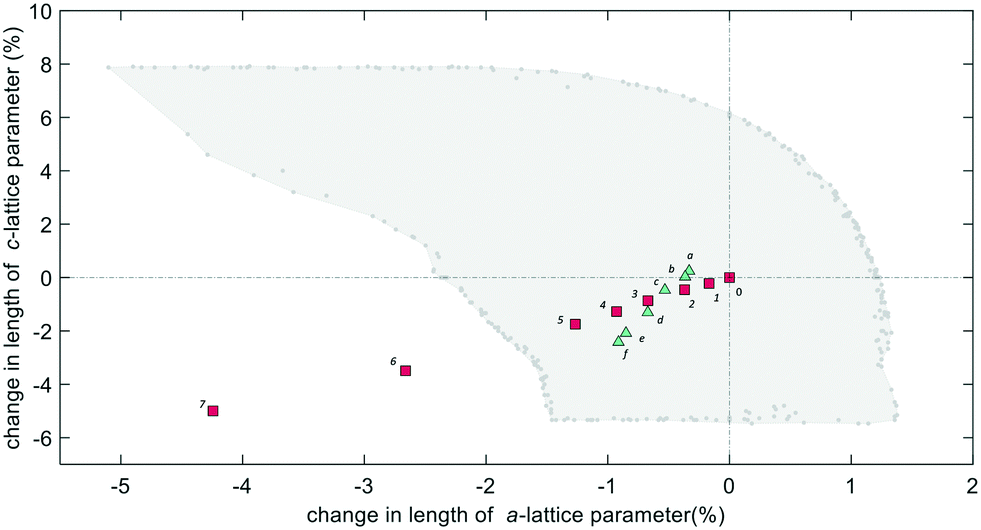 | ||
| Fig. 6 Theoretical flexibility window of K–L (area shaded in light grey), with experimental lattice parameters plotted. The flexibility window contains all possible unit-cell sizes where the framework can be geometrically optimised. The limits of geometric relaxation, also called the flexibility window edges, are shown as dark grey points at the boundary. All data are calculated with respect to the empty structure at Pamb, shown at the origin, 0. Labels 1–7 (red squares) show the change in experimental lattice parameters for the empty framework at pressure points of 0.19, 0.46, 0.91, 1.31, 1.71, 2.74 and 4.15 GPa, respectively. Labels a–f (green triangles) show the change in lattice parameters for the filled framework at pressure points of 0.29, 0.58, 1.13, 1.93, 2.89 and 3.32 GPa, respectively. | ||
3 Discussion
Our simulations show that two different compression mechanisms take effect within the flexibility window, Fig. 6. The LTL framework is almost twice as compressible in non-penetrating media, with B0 = 37(1) GPa compared to B0 = 70(1) in penetrating media. This difference can be attributed to the stabilising effect of channel content. Fluorinert fluids consist of large, branched fluorocarbon compounds, for example, perfluorotributylamine, which has a molecular diameter of 9.4 Å.30 These molecules are much larger than the channel apertures of the zeolite (12MR diameters 7 Å) and cannot penetrate into the pores. In contrast, water, methanol and ethanol molecules, with diameters of 2.75, 3.6 and 4.3 Å, respectively, are of the correct dimensions to penetrate the 12MR channels. This initially causes rapid contraction of the a-lattice parameter and expansion of the c-lattice parameter at the lowest investigated pressure of 0.29(2) GPa. However, once the channels are filled, the LTL framework becomes considerably more stable to increasing pressures.For a more direct comparison, we compare structures at similar pressures of 1.71(2) and 1.93(2) GPa, with empty and filled channels, respectively. With empty channels, our geometric simulations predict that contraction in the a-plane occurs via the softer 12MR, before any deformation to the more rigid 6MR occurs. This is apparent when looking at individual TO4 rotations. T1 units are most affected by pressure and anti-rotate by 9.7° around an axis parallel to the crystallographic c-axis, Fig. 5a. The 12MR channel ellipticity increases by 10.7%. Compression of the unit-cell along the c-direction occurs via contraction of the larger ltl and can cages. Here, T2 units anti-rotate by 8.6°, around an axis perpendicular to the [111] plane. Fig. 5(a). With filled channels, contraction in the a-plane is now hindered. From Fig. 4b, we can see that, whilst the a-lattice parameter decreases considerably for the empty framework, it remains comparatively stable to increasing pressures for the filled framework. Consequently, compression of the filled framework occurs predominantly along the c-direction and there is little change to bond angles and channel apertures along the a-direction. T1 sites still anti-rotate about the same axis, but with a much smaller rotation angle of 1.6°. With the 12MR channels stabilised by extra-framework content, it is the T2 units that are now most affected by pressure, displaying rotations of 2.8° around an axis that lies perpendicular to the [110] plane. This results in more noticeable flattening of the d6r units, Fig. 5b. These results are in agreement with Gigli et al., who also report anisotropic behaviour of lattice parameters for hydrated aluminosilicate and gallosilicate LTL-type zeolites compressed in methanol:ethanol:water mixtures (m.e.w).6,31 The stiffening of zeolite channels due to extra-framework content has also been reported in several other high-pressure studies on isotypic frameworks.29,32
From our geometric simulations, we can also see that the empty K–L structure is pushed outside of its flexibility window boundaries at pressures greater than 2.5 GPa, Fig. 6. Here, our models predict that a different compressibility is adopted. T1–O1–T1 angles in the 12MR channels become significantly low, <110°, whilst T2–O6–T2 angles of the 4-rings approach 180° (refer to ESI†). This leads to unfavourable steric clashes between oxygen atoms. The framework becomes inherently strained and can no longer accommodate pressures by varying T–O–T angles. Distortion of TO4 units is inevitable. By subsequently decreasing tetrahedral bond lengths to 1.63 Å and 1.60 Å, geometric relaxation of structures at 2.74(3) and 4.15(4) GPa could be achieved, without any steric clashes, Fig. S5.† At pressures greater than 2.5 GPa, a discontinuity is also observed in volume–pressure and unit-cell parameter data, Fig. 4a and b, coincident with the framework leaving the flexibility window. From experimental data (refer to ESI†), we can also see that diffraction peak profiles become significantly broad and intensities decrease at higher pressures. It is evident that there is a greater increase in the long-range structural disorder. However, it is important here to consider the hydrostatic pressure range for Fluorinert, which is limited to pressures below approximately 2.3 GPa.26 As such, these discontinuities could also be explained by entering the non-hydrostatic regime of the pressure transmitting medium.
When its channels are filled, our geometric simulations show that the LTL framework adopts a different compression mechanism and can withstand pressures up to at least 3.32(4) GPa without leaving the flexibility window. Although additional data with m.e. were collected at a higher pressure point of 4.24 GPa, the quality of experimental data meant that unit-cell parameters could not be extracted and we are unable to determine whether, at pressures greater than 3.32(4) GPa, the filled structure may be pushed outside of the window.
3.1 Refinements at high pressure
To facilitate Rietveld refinements at high pressures, our geometrically optimised structures were used as starting models. At first, atomic positions were not refined so that the number of variables in each cycle could be kept to a minimum and to establish the strength of our method. Using these models significantly improved the wR values. Atomic positions were then refined using soft restraints on T–O bond lengths and O–T–O angles, with target values of 1.642(1) Å and 109.5°, respectively. Although data quality at high pressures does prevent unambiguous refinements, using our simulated models led to convergence up to pressures of 2 GPa. Without these models, any attempt at varying atomic positions at pressures greater than 0.3 GPa lead to unstable refinements. In accordance to our theoretical findings, the refined structures show that flexibility of the LTL framework is driven by co-operative anti-rotation of rigid TO4 units around more flexible T–O–T angles, as illustrated in Fig. 5.28 Adjacent tetrahedra rotate in equal and opposite directions, causing expansion of one T–O–T angle which is compensated by contraction of another. As expected, the empty framework does show more variations away from the ideal geometry, with average T–O bond lengths steadily decreasing with pressure, whereas no significant changes to TO4 units are observed for the filled framework up to at least 1.91 GPa.4 Conclusions
Here, we have shown that geometric modelling, implemented in GASP software, is a fast and straightforward tool that can facilitate structural analyses of zeolite frameworks at high pressures, when Rietveld refinements alone fall short. GASP software can be used to predict high-pressure behaviour at the atomic level, where flexibility is based on collective movements of rigid TO4 units. Furthermore, the theoretical flexibility window may provide valuable insight into the structural integrity of a zeolite framework upon compression. We anticipate that GASP and the flexibility window theory will be effective in predicting and rationalising compression mechanisms of other existing and hypothetical frameworks, which may have potential for new applications under non-ambient conditions.5 Methods
5.1 Synthesis of the potassium Linde type L zeolite (K–L)
|K+9|[Al9Si27O72]-LTL was synthesised following a verified method by J. P. Verduijn.33 An aqueous magnesium nitrate solution was made by dissolving 1.3 g Mg(NO3)26 H2O in 500 g H2O. 1.6 g Al(OH)3 (Acros, ≥63.5% Al2O3) was added to a solution of 3.0 g KOH (≥85% pellets, Sigma) in 5.0 g H2O. The solution was stirred, heated to boiling until clear, cooled to room temperature and the water loss due to evaporation was corrected. 15 g of SiO2 (Ludox HS-40, Sigma) was added to 10 g H2O and 1.5 g magnesium nitrate solution and stirred at 350 rpm for 3 minutes until homogeneous. The aluminate solution was added slowly to the silica solution whilst stirring, along with 2.7 g H2O. This was left to stir at 350 rpm for approximately 3 minutes until the gel thickened. The approximate batch composition of the final synthesis mixture was 2.3 K2O:10 SiO2:Al2O3:160 H2O:trace MgO. The gel was transferred to a Teflon lined, stainless steel autoclave and placed in a pre-heated oven at 175 °C for 48 hours under static conditions. The solid product was then cooled to room temperature (1 hour), recovered by filtration, washed repeatedly with water until the pH of the filtrate was 10, and dried overnight in an oven at 100 °C.
5.2 Field emission scanning electron microscopy (FESEM)
FESEM micrographs were obtained using a JEOL FESEM6301F field-emission scanning electron microscope, Fig. 7. Powder samples were placed on an aluminium stub using a carbon sticker and coated with 20 nm of chromium to reduce charging on the zeolite surface. Images were taken at ×20k magnification with a 1 μm scale and using an accelerating voltage of 5.0 kV under vacuum.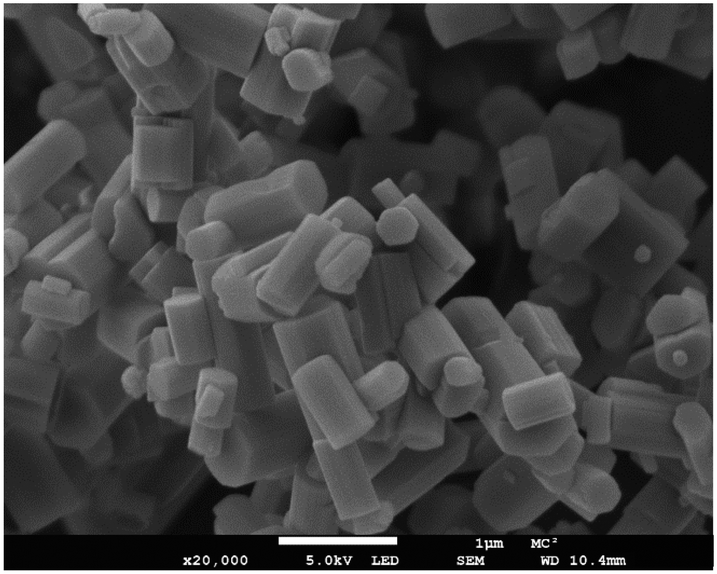 | ||
| Fig. 7 Field emission scanning electron micrograph (FESEM) of K–L showing the hexagonal rod morphology. | ||
5.3 Data collection
:1 mixture of perdeuterated m.e. was chosen as a penetrating PTM. Samples were compressed using the Paris–Edinburgh cell equipped with single-toroidal, zirconia-toughened alumina (ZTA) anvils. Pressure measurements were collected at applied cell loads from 7 to 50 tonnes in 5 tonnes intervals across a d-spacing range from 0.5 to 4.1 Å. Pressures in GPa were obtained from the equation of state (EoS) for lead.35 For ambient pressure measurements, dehydrated zeolite powders were placed in sealed, null-scattering vanadium canisters, with and without m.e. present. Measurements were collected on both the PEARL and POLARIS diffractometers at ISIS.36 Data from POLARIS were collected across the entire d-spacing range from 0.2 to 20 Å using all 5 available detector banks.
5.4 GASP simulations and structural refinements
All refinements were performed using the GSAS 2 package,37 in the space group P6/mmm, and starting from the atomic coordinates of dehydrated K–L at 298 K, reported by Newsam.24The complete structure of dehydrated K–L at ambient pressure was determined from full Rietveld refinement using data collected from the low angle, 90° and back-scattering banks of the POLARIS instrument, over the d-spacing range 0.6 to 13 Å. A small contribution to the diffraction pattern from the stainless steel caps was accounted for by an iron phase (Fe metal) in space group Im![[3 with combining macron]](https://www.rsc.org/images/entities/char_0033_0304.gif) m. The sum of phase fractions was constrained to equal 1 and was initially refined. It was then kept fixed throughout further refinements. Backgrounds were fitted with 6 Chebyshev coefficients. The scale factor, peak width profiles (sig-1 and sig-2), atomic co-ordinates and cell parameters were all refined. In the final cycles, thermal displacement parameters were also included as variables, but were constrained to be equal for each atom type. The diffractometer constants, DIFA, DIFC and zero, remained fixed during refinement. A composite T site was used for Si and Al atoms. Site occupancies were determined from the chemical formula, |K+8.4|[Al8.4 Si27.6 O72]. In accordance to the structure of dehydrated K–L reported by Newsam,24 K1 and K2 sites are fully occupied. The remaining K3 site in our model was given an occupancy of 0.57 to make up the amount required for charge compensation. Site occupancies for all atoms were kept fixed throughout refinement cycles. Refinement of K–L with m.e. at ambient pressure was carried out using data collected from the PEARL instrument. Here, backgrounds were fitted with 12 Chebyshev coefficients. Generating Fourier difference maps showed some residual electron density in the 12MR channels but the diffuse nature of the maps, likely due to mobility of guest molecules and partial occupancies of these sites, made it difficult to assign atoms. We found that multiple water/methanol site distributions were able to produce a reasonable fit to the powder diffraction patterns, without any significant improvements to the wR values. We referred to extra-framework sites for hydrated aluminosilicate and gallosilicate K–L, previously reported.6,31 As we are unable to distinguish between methanol or water molecules in the refinements, extra-framework sites were modelled with oxygen atoms and labelled in accordance with the water sites reported by Gigli et al. for direct comparison.31 All atomic coordinates were refined, along with thermal parameters for the framework atoms, which were constrained to be equal for each atom type, site occupancies for the extra-framework species and instrument parameters. Thermal parameters were kept fixed for the guest molecules due to the high correlation with site occupancies.
m. The sum of phase fractions was constrained to equal 1 and was initially refined. It was then kept fixed throughout further refinements. Backgrounds were fitted with 6 Chebyshev coefficients. The scale factor, peak width profiles (sig-1 and sig-2), atomic co-ordinates and cell parameters were all refined. In the final cycles, thermal displacement parameters were also included as variables, but were constrained to be equal for each atom type. The diffractometer constants, DIFA, DIFC and zero, remained fixed during refinement. A composite T site was used for Si and Al atoms. Site occupancies were determined from the chemical formula, |K+8.4|[Al8.4 Si27.6 O72]. In accordance to the structure of dehydrated K–L reported by Newsam,24 K1 and K2 sites are fully occupied. The remaining K3 site in our model was given an occupancy of 0.57 to make up the amount required for charge compensation. Site occupancies for all atoms were kept fixed throughout refinement cycles. Refinement of K–L with m.e. at ambient pressure was carried out using data collected from the PEARL instrument. Here, backgrounds were fitted with 12 Chebyshev coefficients. Generating Fourier difference maps showed some residual electron density in the 12MR channels but the diffuse nature of the maps, likely due to mobility of guest molecules and partial occupancies of these sites, made it difficult to assign atoms. We found that multiple water/methanol site distributions were able to produce a reasonable fit to the powder diffraction patterns, without any significant improvements to the wR values. We referred to extra-framework sites for hydrated aluminosilicate and gallosilicate K–L, previously reported.6,31 As we are unable to distinguish between methanol or water molecules in the refinements, extra-framework sites were modelled with oxygen atoms and labelled in accordance with the water sites reported by Gigli et al. for direct comparison.31 All atomic coordinates were refined, along with thermal parameters for the framework atoms, which were constrained to be equal for each atom type, site occupancies for the extra-framework species and instrument parameters. Thermal parameters were kept fixed for the guest molecules due to the high correlation with site occupancies.
For structural analyses at high-pressures, experimental unit-cell parameters were initially extracted using the Le Bail whole-pattern fitting method.
Geometric simulations were then performed using GASP software.22 The refined crystal structure at Pamb, determined from POLARIS data, was used as the input cell. A geometrically regular, tetrahedral template, with a T–O bond length of 1.642 Å, was fitted to each T atom of the framework. A composite T site was used to represent a random distribution of silicon and aluminium in the framework, assuming bond lengths for Si–O and Al–O to be 1.61 and 1.75 Å, respectively and accounting for a framework Si/Al ratio of 3.3. Extra-framework potassium cations were sterically included, but not involved in the bonding. The a and c-lattice parameters were systematically varied in accordance to the hexagonal crystal system and geometric relaxations were carried out at each pressure point. During a geometric relaxation, the atoms are incrementally moved towards the template vertices to minimise the mismatch. In this case, a geometrically relaxed structure was defined as being inside the boundaries of the flexibility window, with all T–O bond lengths being 1.642(1) Å and all O–T–O angles being 109.5(1)°. A cost function was used to avoid steric clashes of framework oxygen atoms and extra-framework K+ cations, with Pauling hard-sphere ionic radii of 1.35 and 1.33 Å, respectively.38 These geometrically optimised, high-pressure structures were then used as starting models for Rietveld refinements using compression data. Backgrounds were fitted using Chebyshev polynomials with 6–15 variable coefficients. In addition to the K–L samples, lead, zirconia and alumina were included as additional phases, with the sum of phase fractions constrained to equal 1. Geometric restraints were again used on framework T–O bond lengths and O–T–O angles, with target values of 1.642(1) Å and 109.5°, respectively, to keep the geometry of the structural model sensible throughout. All atomic coordinates were refined, along with thermal parameters for the framework atoms, which were constrained to be equal for each atom type, fractional occupancies for the extra-framework content, instrument parameters, background, and scale factor. Thermal parameters for the guest molecules were kept at a fixed value as simultaneously varying fractional occupancies, atomic coordinates, and thermal parameters led to an unstable refinement. Refined distances, given in the ESI,† show some extra-framework site locations as being 1.6–1.8 Å apart, with occupancies close to one. At such proximities, it is very unlikely that these adjacent sites are simultaneously occupied by water molecules. Attempts were made to model these sites with carbon and oxygen atoms using soft restraints on the interatomic C–O distance, with a target value of 1.43 Å. However, this arrangement gave extremely large esd values for these atoms or caused refinements to diverge. From these distances, we cannot say with certainty whether they can be considered C–O bonds from methanol but it is plausible that in some instances water and/or methanol molecules are found here and that the guest molecules are more mobile than the fixed crystallographic positions account for. At pressures >1GPa, generating Fourier difference maps also showed a peak in the 8MR channel, at z = 0. This site has previously been reported as a K site (K4) that appears upon compression in penetrating media.6,31 K3 and K4 site occupancies were then refined to follow this cation migration, but constraining the sum of K cations to keep the composition fixed.
5.5 GASP analysis of polyhedral rotations
Compression mechanisms within the flexibility window were analysed using the polycomp utility in GASP. Data output are given in the ESI.† TO4 geometries at each pressure point were compared to the starting structures and atomic differences were quantified in terms of tetrahedral rotations around an axis, described by a vector with x, y, and z components. The magnitude of each TO4 rotation around the axis is given in degrees.6 Data availability
The datasets generated during the current study are available in the University of Bath Research Data Archive at https://doi.org/10.15125/BATH-00861 and STFC ISIS Facility, https://doi.org/10.5286/ISIS.E.RB1820321, https://doi.org/10.5286/ISIS.E.RB2000030, https://doi.org/10.5286/ISIS.E.RB2010352 CSD deposition numbers 2083646–2083655 contain crystallographic data for all refined K–L structures.7 Code availability
GASP is freely available from a Github repository at https://github.com/EssayWells/GASP_6 from which users can obtain the code and manual.Author contributions
LP prepared all samples and carried out PXRD and GASP simulations. LP, CR, CB and AS conducted high-pressure neutron diffraction experiments at ISIS Neutron and Muon Source, UK. LP wrote the main manuscript text and prepared all figures. All authors discussed the experiments and reviewed the manuscript.Conflicts of interest
The authors declare no competing interests.Acknowledgements
AS and LP thank the Royal Society for funding. Experiments at the ISIS Neutron and Muon Source were supported by beamtime allocations RB2000030, RB1820321 and RB2010352 from the Science and Technology Facilities Council. The authors also gratefully acknowledge the Material and Chemical Characterisation Facility (MC2) at the University of Bath (https://doi.org/10.15125/mx6j-3r54) for PXRD and FESEM support.Notes and references
- D. Scelta, M. Ceppatelli, M. Santoro, R. Bini, F. A. Gorelli, A. Perucchi, M. Mezouar, A. van der Lee and J. Haines, Chem. Mater., 2014, 26, 2249–2255 CrossRef CAS.
- R. Arletti, E. Fois, L. Gigli, G. Vezzalini, S. Quartieri and G. Tabacchi, Angew. Chem., Int. Ed., 2017, 56, 2105–2109 CrossRef CAS PubMed.
- J. L. Jordá, F. Rey, G. Sastre, S. Valencia, M. Palomino, A. Corma, A. Segura, D. Errandonea, R. Lacomba, F. J. Manjón, O. Gomis, A. K. Kleppe, A. P. Jephcoat, M. Amboage and J. A. Rodríguez-Velamazán, Angew. Chem., Int. Ed., 2013, 52, 10458–10462 CrossRef PubMed.
- http://www.iza-structure.org/databases/ .
- G. Calzaferri, Langmuir, 2012, 28, 6216–6231 CrossRef CAS PubMed.
- Y. Lee, C.-C. Kao, S. J. Kim, H.-H. Lee, D. R. Lee, T. J. Shin and J.-Y. Choi, Chem. Mater., 2007, 19, 6252–6257 CrossRef CAS.
- C. L. Bull, M. Guthrie, J. Archer, M.-T. Fernandez-Diaz, J. S. Loveday, K. Komatsu, H. Hamidov and R. J. Nelmes, J. Appl. Crystallogr., 2011, 44, 831–838 CrossRef CAS.
- S. Klotz, G. Hamel and J. Frelat, High Pressure Res., 2004, 24, 219–223 CrossRef CAS.
- V. A. Somenkov, J. Phys.: Condens. Matter, 2005, 17, S2991–S3003 CrossRef CAS.
- G. D. Gatta and S. A. Wells, Phys. Chem. Miner., 2004, 31, 465–474 CrossRef CAS.
- G. D. Gatta, G. Tabacchi, E. Fois and Y. Lee, Phys. Chem. Miner., 2016, 43, 209–216 CrossRef CAS.
- G. D. Gatta and S. A. Wells, Phys. Chem. Miner., 2006, 33, 243–255 CrossRef CAS.
- A. Nearchou, M.-L. U. Cornelius, J. M. Skelton, Z. L. Jones, A. B. Cairns, I. E. Collings, P. R. Raithby, S. A. Wells and A. Sartbaeva, Molecules, 2019, 24, 641 CrossRef CAS PubMed.
- A. Nearchou, M. U. Cornelius, Z. L. Jones, I. E. Collings, S. A. Wells, P. R. Raithby and A. Sartbaeva, ChemRxiv, 2018, 1–41.
- S. A. Wells, K. M. Leung, P. P. Edwards and A. Sartbaeva, Dalton Trans., 2015, 44, 5978–5984 RSC.
- A. Sartbaeva, J. Haines, O. Cambon, M. Santoro, F. Gorelli, C. Levelut, G. Garbarino and S. A. Wells, Phys. Rev. B: Condens. Matter Mater. Phys., 2012, 85, 064109/1–064109/5 CrossRef CAS.
- S. A. Wells, K. M. Leung, P. P. Edwards, M. G. Tucker and A. Sartbaeva, R. Soc. Open Sci., 2017, 4, 170757/1–170757/8 CAS.
- A. Sartbaeva, S. A. Wells, M. M. J. Treacy and M. F. Thorpe, Nat. Mater., 2006, 5, 962–965 CrossRef CAS PubMed.
- G. D. Gatta, A. Sartbaeva and S. A. Wells, Eur. J. Mineral., 2009, 21, 571–580 CrossRef CAS.
- S. A. Wells, A. Sartbaeva and G. D. Gatta, EPL, 2011, 94, 56001/p1–56001/p5 CAS.
- A. Sartbaeva, G. D. Gatta and S. A. Wells, EPL, 2008, 83, 26002/1–26002/5 CAS.
- S. A. Wells and A. Sartbaeva, Mol. Simul., 2015, 41, 1409–1421 CrossRef CAS.
- S. A. Wells and A. Sartbaeva, Materials, 2012, 5, 415–431 CrossRef PubMed.
- J. M. Newsam, J. Phys. Chem., 1989, 93, 7689–7694 CrossRef CAS.
- M. J. Cliffe and A. L. Goodwin, J. Appl. Crystallogr., 2012, 45, 1321–1329 CrossRef CAS.
- S. Klotz, J.-C. Chervin, P. Munsch and G. Le Marchand, J. Phys. D: Appl. Phys., 2009, 42, 8075413 CrossRef.
- F. Birch, Phys. Rev., 1947, 71, 809–824 CrossRef CAS.
- G. D. Gatta and Y. Lee, Mineral. Mag., 2014, 78, 267–291 CrossRef CAS.
- G. D. Gatta, P. Lotti and G. Tabacchi, Phys. Chem. Miner., 2018, 45, 115–138 CrossRef CAS.
- W. Zhang, X. Bao, X. Guo and X. Wang, Catal. Lett., 1999, 60, 89–94 CrossRef CAS.
- L. Gigli, G. Vezzalini, S. Quartieri and R. Arletti, Microporous Mesoporous Mater., 2019, 276, 160–166 CrossRef CAS.
- L. Gigli, R. Arletti, E. Fois, G. Tabacchi, S. Quartieri, V. Dmitriev and G. Vezzalini, Crystals, 2018, 8, 79/1–79/22 CrossRef CAS.
- H. Robson, Verified Syntheses of Zeolitic Materials, 2nd edn, 2001, pp. 190–191 Search PubMed.
- C. L. Bull, N. P. Funnell, M. G. Tucker, S. Hull, D. J. Francis and W. G. Marshall, High Pressure Res., 2016, 36, 493–511 CrossRef.
- A. D. Fortes, I. G. Wood, M. Alfredsson, L. Vočadlo, K. S. Knight, W. G. Marshall, M. G. Tucker and F. Fernandez-Alonso, High Pressure Res., 2007, 27, 201–212 CrossRef CAS.
- R. I. Smith, S. Hull, M. G. Tucker, H. Y. Playford, D. J. McPhail, S. P. Waller and S. T. Norberg, Rev. Sci. Instrum., 2019, 90, 115101 CrossRef CAS PubMed.
- B. H. Toby and R. B. Von Dreele, J. Appl. Crystallogr., 2013, 46, 544–549 CrossRef CAS.
- L. Pauling, J. Am. Chem. Soc., 1927, 49, 765–790 CrossRef CAS.
Footnote |
| † Electronic supplementary information (ESI) available. See DOI: 10.1039/d1ce00142f |
| This journal is © The Royal Society of Chemistry 2021 |