 Open Access Article
Creative Commons Attribution 3.0 Unported Licence
Isostructurality of quinoxaline crystal phases: the interplay of weak hydrogen bonds and halogen bonding†
Amie
Saidykhan
,
Nathan W.
Fenwick
 ,
Richard D.
Bowen
,
Richard
Telford
and
Colin C.
Seaton
,
Richard D.
Bowen
,
Richard
Telford
and
Colin C.
Seaton
 *
*
School of Chemistry and Biosciences, University of Bradford, Bradford, Richmond Road, Bradford BD7 1DP, UK. E-mail: c.seaton@bradford.ac.uk
First published on 16th September 2021
Abstract
Tailoring the physical properties of molecular crystals though the construction of solid solutions requires the existence of isostructural crystals. Simple substitutions of a given molecular framework can give a range of different crystal structures. A set of quinoxaline derivatives, C8H4N2(C6H4X)2, Q3,3′X2, has been investigated (X = F, Cl, Br, I and Me) where kinetic factors generated a set of isostructural crystals for the lighter halogens (F, Cl, Br) alone. Computational analysis shows that the stabilising interactions are maximal for Cl, while DSC studies demonstrate the existence of more stable polymorphs for both F and Br containing systems. Steric factors appear to have a lower contribution than the balance of weaker hydrogen and halogen bonding shown by the Me and I containing systems displaying different packing driven by CH⋯N/CH⋯π bonds and I⋯I bonds respectively.
Introduction
A key objective of crystal engineering is the designed creation of functional materials with defined properties through control of the crystal packing.1 Crystal engineering has applications across many fields of science and engineering including adjusting pharmaceutical properties,2–5 electronic materials,6 energetic materials7,8 and optic/chromatic systems.9,10 Understanding how changes in molecular or compositional structure alters the final properties and potential crystal structures is thus a key topic for study. Isostructural systems, where different materials pack in similar crystal structures, offer a route to develop such understanding as the changes in physical properties with chemical alteration are directly correlated due to the consistency of crystal structure. The creation of solid solutions11,12 also requires isostructural pairs but offers the potential to vary systematically properties between two extremes.13 Predominately inorganic materials such as lead halide perovskites14 or metal–organic framework materials15,16 are often are investigated through compositional changes within given crystal archetypes. This approach allows for controlled variation in the physicochemical properties within a set crystal form by tailoring the level or choice of selected components. As such crystal structures are dominated by electrostatic forces between ionic components or the packing of complexes where the metal is hidden by the ligand structure such systematic changes are possible. In contrast, substitutional variation in organic molecular crystals often leads to significant changes in the crystal packing due to the changes in the array of weaker van der Waals and hydrogen bonding interactions that control the packing. There have been studies building from the initial work by Kitaigorodsky17 in the 1950s into what factors influence the packing of organic crystals with studies into the replacement of Cl, Br and I atoms,18–21 F/H (ref. 22) or CH3/Cl replacement23 and the interchange of C![[double bond, length as m-dash]](https://www.rsc.org/images/entities/char_e001.gif) O and C
O and C![[double bond, length as m-dash]](https://www.rsc.org/images/entities/char_e001.gif) S groups.24 Such studies highlight the role that similar molecular volumes and geometries play in controlling crystal packing. However, the inclusion of directional contacts such as halogen⋯halogen bonding25,26 and hydrogen bonding27 in the system can support or compete with geometric factors leading to challenges in identifying the directing factors for a given molecule. Thus, further creation and identification of new isostructural materials is required to achieve these outcomes. However, an additional challenge is often the difficulty in synthesising a full set of materials with the desired functional groups or substituents present or obtaining suitable crystals of each phase.
S groups.24 Such studies highlight the role that similar molecular volumes and geometries play in controlling crystal packing. However, the inclusion of directional contacts such as halogen⋯halogen bonding25,26 and hydrogen bonding27 in the system can support or compete with geometric factors leading to challenges in identifying the directing factors for a given molecule. Thus, further creation and identification of new isostructural materials is required to achieve these outcomes. However, an additional challenge is often the difficulty in synthesising a full set of materials with the desired functional groups or substituents present or obtaining suitable crystals of each phase.
Quinoxaline derived molecules and polymers have shown a range of potential applications including biological activity28 and optical properties.29 While this has led to significant numbers of papers developing efficient synthetic routes, few studies have investigated the impact of solid form choice (e.g. polymorphism) on physical properties. Examples include quinoxaline which is a dimorphic system with Z′ = 1 and 5 forms, the latter formed by faster kinetic growth,30 2(1H)-quinoxalinone O-(2′-quinoxalinyl)oxime which exist as yellow and orange polymorphs.31 The mechanofluorochromic material (E)-10-ethyl-3-(2-(3-methylquinoxalin-2-yl)vinyl)-10H-phenothiazine also has different coloured polymorphs (green and yellow) which display different light emission spectra.32 This demonstrates the potential versatility of such systems to form a range of polymorphic materials and tailoring of desired physical properties.
An experimental and computational study has been undertaken on the set Q3,3′X2 (Scheme 1) where X = H, F, Cl, Br, I, Me to identify isostructural crystal structures and any relationships between the molecular, crystal structures and physical properties. These molecules offer a limited range of flexibility (Scheme 1) as steric clashes between the two aromatic rings would constrain the potential rotation of these groups. This restriction ensures that factors due to molecular geometry are limited across the substituent range. This should allow for identification of the influence of selected substituents upon the similarities and changes in the packing.
 | ||
| Scheme 1 Molecular structure of substituted quinoxaline (Q3,3′X2) where X = H, F, Cl, Br, I or Me. The two flexible torsion angles are indicated. | ||
Methodology
Experimental
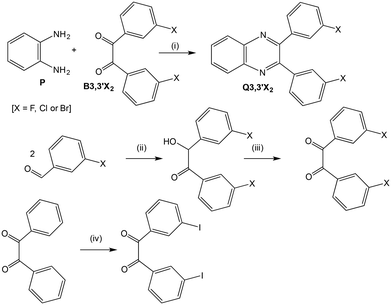
Benzil (X = H) was commercially available; four substituted benzils (X = F, Cl, Br or Me) were obtained in 40–60% overall yield by the benzoin condensation34,35 of the appropriate 3-halogenobenzaldehyde, but with a thiazolium salt as catalyst instead of cyanide anion, followed by oxidation of the resultant benzoin with nitric acid.33 The 3,3′-diiodobenzil was prepared in 50% yield by direct iodination of benzil with molecular iodine and sodium iodate in 90% sulphuric acid at 30 °C.36 These synthetic routes are summarised in Scheme 2. All the intermediates and products were fully characterised by a combination of 1H and 13C nuclear magnetic resonance spectroscopy, infrared spectroscopy and mass spectrometry, as well as X-ray crystallography, and shown to be pure. Details of the synthesis and characterisation have been previous published.37
Computational
Results and discussion
Single crystal analysis determined new crystal structures for Q3,3′X2 (X = F, Cl, I, Me, Table S1†), while it confirmed that the samples for X = H and Br had the same structures as the previously determined crystals (X = H; REFCODE = ODEJAJ, X = Br; REFCODE = EDESAI). While most of the bond lengths and angles are in the expected range, the steric factors of the substituted rings alter the bond lengths of the quinoxaline ring (Table 1).| X | d C–N/Å | d C–C/Å |
|---|---|---|
| H | 1.368(2), 1.368(2), 1.321(2), 1.323(2) | 1.413(2), 1.445(2) |
| F | 1.371(2), 1.363(3), 1.314(3), 1.323(2) | 1.414(3), 1.442(2) |
| Cl | 1.369(3), 1.368(3), 1.320(3), 1.321(3) | 1.415(3), 1.443(3) |
| Br | 1.360(5), 1.360(6), 1.315(4), 1.309(5) | 1.390(6), 1.430(5) |
| I | 1.369(5), 1.366(4), 1.319(4), 1.315(5) | 1.421(5), 1.448(5) |
| Me | 1.368(3), 1.366(3), 1.318(3), 1.316(3) | 1.421(3), 1.453(3) |
| Quinoxaline (HEYJOK02 Z′ = 5) | 1.366(6), 1.362(6), 1.304(6), 1.308(6) | 1.413(6), 1.408(7) |
| 1.376(6), 1.378(6), 1.307(6), 1.318(6) | 1.424(6), 1.398(7) | |
| 1.375(6), 1.366(6), 1.300(6), 1.317(6) | 1.398(6), 1.405(7) | |
| 1.365(6), 1.371(6), 1.303(6), 1.313(6) | 1.415(6), 1.402(7) | |
| 1.369(6), 1.382(6), 1.311(6), 1.292(6) | 1.420(6), 1.400(7) |
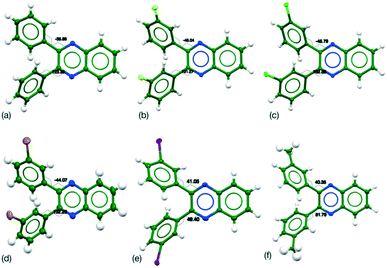
For X = H, F, Cl and Br, the conformation in the crystal was the same, while for X = I and Me have a common conformation that differs from the others (Table 2). No disorder or unusual vibrational features were observed in the ADPs for the systems (Fig. 1). To confirm whether the observed differences are due to the choice of functional group or a factor due to the crystal packing the flexibility of the conformation was investigated through computational methods.
| X | Torsion 1 (°) | Torsion 2 (°) |
|---|---|---|
| H | −35.7(2) | 123.3(1) |
| F | −45.0(2) | 131.3(2) |
| Cl | −45.8(3) | 132.6(2) |
| Br | −44.1(6) | 132.3(4) |
| I | −41.0(5) | −49.4(4) |
| Me | −40.4(3) | −51.8(3) |
A single torsion angle was systematically varied through 360°, while the rest of the molecule was allowed to relax freely. This plots out the lowest energy landscape for the molecular conformations. Four symmetry related minima were located for Q3,3′H2 which lose their degeneracy upon substitution (Table 3). However, the various minima have very similar energies despite the differences in orientation of the functional groups or substituents (Fig. 2).
| X | E 1/kJ mol−1 (τ1, τ2 = −41°, −41°) | E 2/kJ mol−1 (τ1, τ2 = 41°, −136°) | E 3/kJ mol−1 (τ1, τ2 = 136°, −41°) | E 4/kJ mol−1 (τ1, τ2 = −136°, 41°) |
|---|---|---|---|---|
| H | 0.01 | 0.01 | 0.00 | 0.00 |
| F | 0.00 | 0.56 | 0.55 | 0.92 |
| Cl | 0.00 | 0.56 | 0.54 | 0.84 |
| Br | 0.00 | 0.59 | 0.57 | 0.92 |
| I | 0.00 | 0.39 | 0.37 | 0.52 |
| Me | 1.66 | 0.95 | 0.00 | 0.91 |
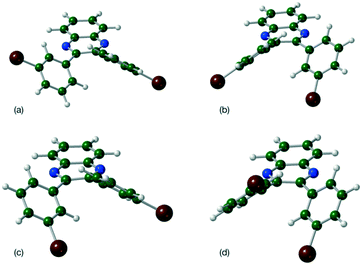 | ||
| Fig. 2 Molecular geometries for the four located minima of Q3,3′Br2 (a) τ1, τ2 = −41°, −41° (b) τ1, τ2 = 41°, −136° (c) τ1, τ2 = 136°, −41° and (d) τ1, τ2 = −136°, 41°. | ||
Given the low energies of the minima, it can be seen that suitable crystal packing forces would be able to compensate for the energy penalty packing in any of these minima. As the barriers to rotation are approximately 20 kJ mol−1 for all systems, slightly higher than in straight chain alkanes (approximately 16 kJ mol−1),48 interconversion of the different conformation should be possible. Solution 1H NOESY NMR studies (Fig. S1†) show no evidence for the preferential formation of distinct conformations. Thus, the difference in conformation in the crystal structures appears to be driven by crystal packing rather than a molecular preference derived by the choice of functional group.
Crystal structure analysis
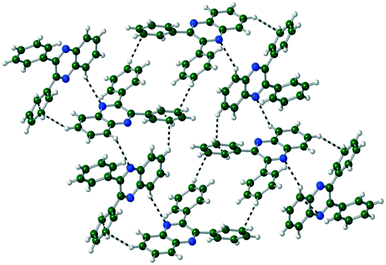
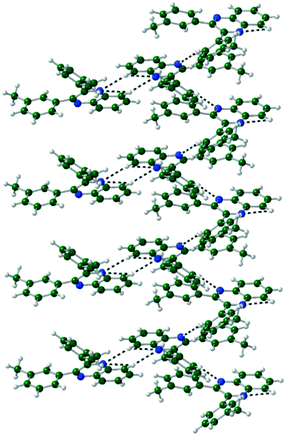
The packing of Q3,3′H2 is dominated through CH⋯π interactions with a dimer formed by phenyl-to-phenyl interactions. Weak CH⋯N hydrogen bonds link these dimers into a 2-D sheet (Fig. 3). These sheets are stacked along the (101) direction through further CH⋯π interactions. Until like substituted system there are no quinoxaline to quinoxaline π interactions.Q3,3′X 2 (X = F, Cl, Br) crystals are isostructural (Table S1, Fig. S2†), all packing in a monoclinic P21/n unit cell. The molecules are linked by CH⋯N hydrogen bonds into a 1-D spiral chain around the 21 screw axis, which are then interlaced through π⋯π and CH⋯Hal interactions to form a 2-D layered structure in the bc-plane (Fig. 4). These layers then are stacked along the a-axis through further CH⋯Hal hydrogen bonds.
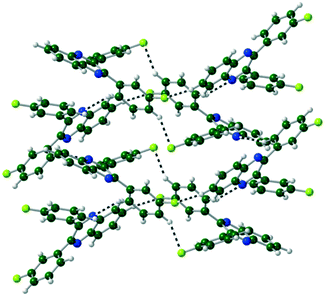 | ||
| Fig. 4 Two interlocked spiral ladders formed through CH⋯N, CH⋯F hydrogen bonds in the crystal structure of Q3,3′F2. Viewed along the a-axis of the crystal. | ||
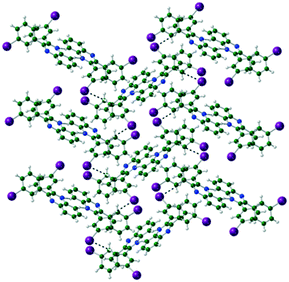
In Q3,3′I2 CH⋯N hydrogen bonds form around the inversion centre dimerising pairs of molecules. Subsequent CH⋯I interactions generated by the n glide plane link the dimers into a 2-D crinkled sheet. These sheets are then stacked along the b-axis by the 21 screw axis with π⋯π and I⋯I interactions completing the crystal structure (Table 4) (Fig. 5).
| X | Interaction | d/Å | Angle/° |
|---|---|---|---|
| R1 = Quinoxaline ring, R2 = substituted benzene ring. Symmetry operations: ! (−x, 2 − y, −z); § (1 − x, −y, 1 − z); † (−x, 1 − y, 1 − z); ± (1 − x, 1 − y, 1 − z); ‡ (−1 + x, y, z); ±± (1/2 − x, −1/2 + y, 3/2 − z); §§ (1/2 − x, 1/2 + y, 3/2 − z); ‡‡(−1/2 + x, 3/2 − y; −1/2 + z). | |||
| H | CH⋯π (R2!) | 2.80(1) | 138 |
| H | CH⋯π (R2‡) | 2.77(1) | 33 |
| F | π⋯π (R1⋯R1§) | 3.722(1) | 0 |
| F | π⋯π (R2⋯R2†) | 4.281(1) | 0 |
| Cl | π⋯π (R1⋯R1§) | 3.743(1) | 0 |
| Cl | π⋯π (R2⋯R2†) | 4.665(2) | 0 |
| Br | π⋯π (R1⋯R1§) | 3.822(2) | 0 |
| Br | π⋯π (R2⋯R2†) | 4.903(2) | 0 |
| I | π⋯π (R1⋯R1†) | 4.054(2) | 0 |
| I | π⋯π (R2⋯R2‡) | 4.652(2) | 57 |
| I | C–I⋯I±± | 3.938(1) | 169/94 |
| Me | π⋯π (R1⋯R2±±) | 3.708(2) | 14 |
| Me | π⋯π (R1⋯R2§§) | 4.003(2) | 14 |
| Me | CH⋯π (R2‡‡) | 2.80(3) | 44 |
In Q3,3′Me2, a CH⋯N hydrogen bond dimerises the molecules together. Another CH⋯N hydrogen bond forms a 1-D spiral ladder around the 21 screw axis similarly to Q3,3′F/Cl/Br2, with further π⋯π interactions supporting the hydrogen bonds (Fig. 6, Table 4).
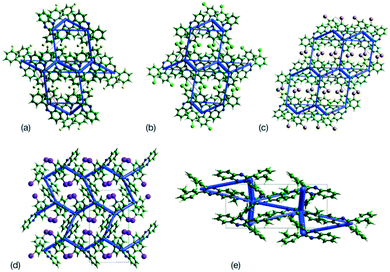
This analysis is supported by considering the energy frameworks of the crystal structures. These were calculated in CrystalExplorer at the HF/3-21G level and show that Q3,3′X2 (X = F, Cl, Br, I) form a hexagonal packed arrangement of strong interactions (Fig. 7) within a layered structure, although the location is varied with the changes in packing. The strongest interaction in each case corresponds to the identified 1-D chain in each system (Fig. 8) with the interaction strength increasing with substitution (Table 5).
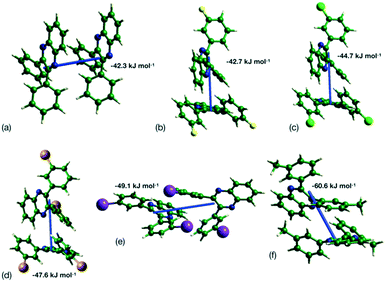 | ||
| Fig. 8 Strongest interaction between molecular pairs in (a) Q3,3′H2, (b) Q3,3′F2, (c) Q3,3′Cl2, (d) Q3,3′Br2, (e) Q3,3′I2 and (f) Q3,3′Me2. | ||
| X | CrystalExplorer HF/3-21G energy/kJ mol−1 | Orca B2PLYP-D3/def2-QZVPP/kJ mol−1 |
|---|---|---|
| H | −43.5 | −43.4 |
| F | −42.7 | −41.1 |
| Cl | −44.5 | −47.0 |
| Br | −47.5 | −29.4 |
| I | −49.1 | −53.3 |
| Me | −60.6 | −65.3 |
Higher level theory calculations show good agreement for Q3,3′H2 but changes to halogen show increasing deviation. This may be due to the lack of dispersion factors in HF calculations and so an incorrect model of the halogen contacts in the dimers. However, the B2PLYP-D3 dimer energies suggest a drop in strength of the observed dimer for Br system. If such a drop continued for I, then resulting packing may be lower and so is the possible reason for a change in crystal packing. Calculation of the energy for a Q3,3′F2 dimer in the conformation observed in the Q3,3′I2 structure shows a significant drop in interaction energy compared to the existing structure (B2PLYP-D3 E = −18.22 kJ mol−1). This indicates that the choice of substitution is directing the choice of dimerization, thus the lattice energies for the known crystal structures were evaluated to identify whether these trends continued in the bulk energies from the dimers (Table 6). These show a general increase in lattice energy with substitution. In the case of COMPASSII and AA-CLP these forcefields use a single point electrostatic model which may inadequately model the halogen interaction,49 as is shown by very short I to I contacts in the optimised AA-CLP Q3,3′I2 structure. In contrast, the UNI forcefield does not include electrostatic contributions and gives a better reflection of the B2PYLP-D3 results. These results indicate that packings are similar for all these system as expected by the lack of strong directional hydrogen bonding in these systems. To confirm that these are the lowest energy packings for these molecules, hypothetical structures for Q3,3′F2 and Q3,3′I2 were constructed by switching the substituents and optimising the energies with Materials Studio and the COMPASSII forcefield. These generated structures were then also evaluated using AA-CLP and UNI forcefields (molecules position and orientations only optimised). In the case of Q3,3′F2 the crystal structures are of comparable energy to the observed structure, while Q3,3′I2 favours the experimentally known structure. This suggests that it may be feasible to generate new polymorphs of Q3,3F2 with alternative conformations and crystal packings.
| X | COMPASSII lattice energy/kJ mol−1 | AA-CLP lattice energy/kJ mol−1 | UNI lattice energy/kJ mol−1 |
|---|---|---|---|
| H | −126.48 | −118.16 | −141.76 |
| F | −134.88 | −125.94 | −146.64 |
| Cl | −152.06 | −139.80 | −169.06 |
| Br | −155.49 | −161.64 | −159.86 |
| I | −152.27 | −179.52 | −157.95 |
| Me | −144.24 | −139.35 | −158.10 |
| F in I crystal structure | −133.26 | −128.43 | −144.06 |
| I in F crystal structure | −146.13 | −168.06 | −141.19 |
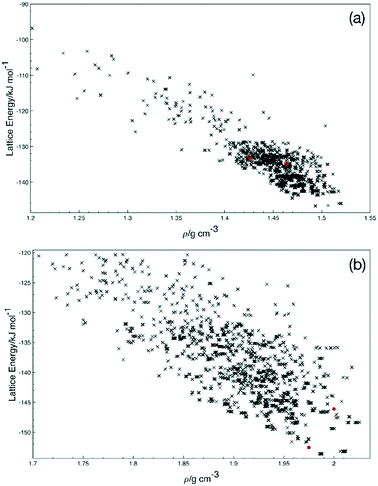
To explore the potential for other crystal structures, a short crystal structure prediction exercise was undertaken for Q3,3′F2 and Q3,3′I2. The resulting energy landscapes (Fig. 9) show that there are significant numbers of feasible alternative structures for Q3,3′F2 lower in energy than the experimentally obtained structure, but fewer for Q3,3′I2. These structures display the range of potential low energy conformations suggesting that there is flexibility present in the system to allow a range of polymorphs to grow. In the Q3,3′I2 case, the same lowest energy conformation is present in the predicted structures as the experimental structure. This suggests that alternative polymorphs may be possible for the Q3,3′F2 case, while the Q3,3′I2 systems may be the lowest energy structure and favoured packing for this molecule.
Polymorphism screening
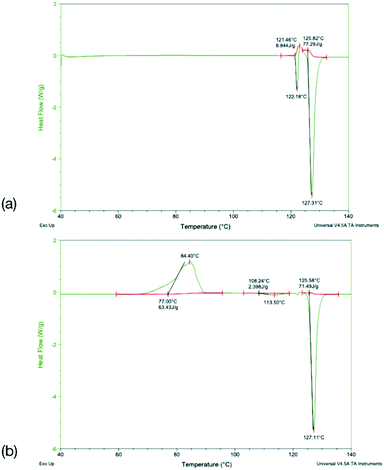
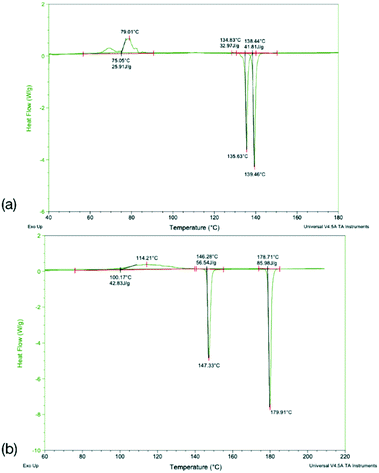
To identify any possible polymorphism, DSC data were collected on the original samples (Table 7), while the halogenated systems were recrystallised from nonpolar solvents and analysed by PXRD. These samples were identified as the same crystal forms in the cases Q3,3′X2 (X = F, Cl, Br, I, Fig. S3–S7†). In the case of Q3,3′H2 additional peaks were noted along with the peaks for the known form, suggesting the existence of a second polymorph (Fig. S3†). The first heating cycle of the DSC analysis of Q3,3′H2 (Fig. 10a) shows a melt-recrystallisation peak followed by full melting of the phase indicating a monotropic relationship between the two phases. After cooling, a second heating cycle has an exothermic recrystallisation peak leading to a phase that undergoes an endothermic phase transformation. Some of the sample stays in the original phase and undergoes a melt-recrystallisation before the remaining sample melts (Fig. 10b). These results confirm the existence of an additional polymorph which is more stable than the previously determined phase (Fig. 11).| X | Melting point/°C | ΔfusH/kJ mol−1 | ΔfusS/J K−1 mol−1 | |||
|---|---|---|---|---|---|---|
| Cycle 1 | Cycle 2 | Cycle 1 | Cycle 2 | Cycle 1 | Cycle 2 | |
| a Cycle 1 displays two melt events. | ||||||
| Ha | 121.5 | 2.50 | 6.32 | |||
| 125.8 | 125.6 | 21.82 | 20.18 | 54.70 | 50.62 | |
| F | 138.4 | 134.8 | 13.21 | 10.50 | 32.10 | 25.72 |
| Cl | 185.8 | 185.9 | 40.77 | 39.93 | 88.84 | 86.99 |
| Br | 178.7 | 146.3 | 34.28 | 24.89 | 75.87 | 59.33 |
| I | 186.36 | N/A | 33.93 | N/A | 73.84 | N/A |
DSC analysis of Q3,3′F2 and Q3,3′Br2 both show melt of the given phase on the first cycle followed by recrystallisation to a lower melting phase upon heating of the cooled amorphous phase. The enthalpy and entropy of fusion rules in both cases indicates a monotropic relationship between the solid forms (Table 7). However, a second sample of Q3,3′Br2 showed reduced levels of the low temperature form (small melt recrystallisation peak), a change in the temperature of crystallisation peak and a possible glass transition in the cooling cycle that is not observed in the other sample (Fig. 12). This variation demonstrates the role of kinetics in the crystallisation of these phases. These kinetic factors may be directed by the synthetic route used. It has been shown that inclusion of 1–2% of an unreacted starting material may lead to isostructural solid solutions which may be mistaken for alternative polymorphs.50 These results show that the observed isostructurality is not driven by thermodynamic factors as the stable forms are the high melting phase which have not been structurally determined. The lack of growth of alternative phases may reflect the high barriers to rotation if a different conformation is present in the stable polymorph requiring the higher temperatures for conversion. In the case of Q3,3′F2, the evidence of polymorphism supports the computational analysis where the known crystal is higher in energy than a number of predicted crystal packing and so existence of a lower energy polymorph is expected.
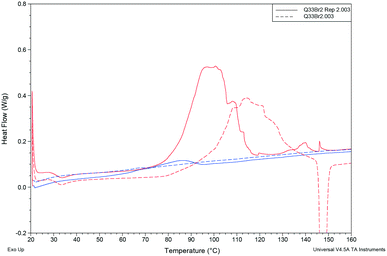 | ||
| Fig. 12 Comparison of cooling cycles (blue) and heating cycles (red) for two different samples of Q3,3′Br2. | ||
For Q3,3′Cl2 the sample shows the same melting peak on both cycles and a faster crystallisation process that occurs on the cooling cycle compared to the other samples (Fig. S8†). This compound has the highest melting point of the samples in agreement with the higher lattice energies calculated with the UNI forcefield and the dimers at B2PLYP level of theory. These energies were higher for Q3,3′F2 and Q3,3′Br2, which suggests that this crystal packing is optimal for the Q3,3′Cl2 and so a lack of alternative polymorphs could be expected in this case. Q3,3′I2 undergoes decomposition with melting resulting in no data on the latter cycles (Fig. S9†), but the computational studies offer evidence for a lack of other polymorphs in this case.
The predicted entropies of fusion from Walden's constant51 for fully disassociated melts is 66 J K−1 mol−1, indicating that the halogenated systems generally have greater levels of association. An exception is Q3,3′F2, which shows a very low entropy of fusion suggesting a low change in disorder upon melting. As the high temperature polymorph structure is unknown it is not clear what the cause is, but it may be due to increased disorder in the crystal structure.
The variability in solid form induced by the role of kinetics places limitations on the ability to generate reproducibly samples of all phases for analysis. Ongoing work will focus on obtaining suitable crystals for structural determination to confirm the conformation and packing in these phases. However, it appears that the weak hydrogen bonding, halogen bonding and van der Waals interactions in these systems are in a close balance and can be easily shifted, allowing for a range of isostructural samples to be located for the smaller halogen substituents, while the greater I⋯I interactions alter the dominant motifs present in the crystal structures preventing the continuation of the isostructurality.
Conclusions
The formation of isostructural crystals for molecules through changes in substituents continues to be a challenging problem in crystal engineering. For the series of quinoxalines studied, while a set of isostructural crystals are obtained for X = F, Cl and Br, only for X = Cl is the thermodynamically stable polymorph grown. In the case of F and Br, kinetic factors favour the growth of a metastable phase and the stable polymorph has not yet been obtained in a form suitable for structural characterisation. Energetic calculations indicate an increase in strength of the common bonding patterns around the Cl system, the stability of the structural packing dropping with substitution of larger or smaller halogens. The size of the substituent does not appear to play a controlling role in the creation of isostructural crystals in this case, as replacement of Cl by the similarly sized Me group gives rise to a different conformation and packing dominated by weaker CH⋯N/CH⋯π hydrogen bonds. Crystal structure prediction allows for an interrogation of the energy landscape of the different polymorphs, reflecting the experimental differences in the X = F and I systems. Q3,3′F2 displays many potential polymorphic forms with different conformations and packing motifs, while Q3,3′I2 experimental phase is one of the lowest energy crystal structures and would not be expected to display a high level of polymorphism. In the case of Q3,3′I2 the introduction of potential I⋯I interactions alter the overall balance of forces leading to a different packing and so the isostructural set is not continued. This work shows that changes to the molecular structure can lead to isostructural crystals, but they may not be the most stable phase for a given substitution. Thus, the ability to design desired structures requires the consideration of thermodynamic and kinetic factors, along with the whole potential crystal structure landscape for even conceptually simple structures due to the balance of weak intermolecular interactions in the crystals.Author contributions
AS: investigation, resources, methodology, validation. NWF: investigation, resources, methodology, validation. RDB: conceptualization, investigation, project administration, supervision, resources, writing – review and editing. RT: conceptualization, investigation, methodology, supervision, writing – review and editing. CCS: conceptualization, investigation, formal analysis, visualization, writing - original draft, writing – review and editing.Conflicts of interest
There are no conflicts to declare.Notes and references
- G. R. Desiraju, Angew. Chem., Int. Ed., 2007, 46, 8342–8356 CrossRef CAS PubMed.
- S. R. Byrn, R. R. Pfeiffer, G. A. Stephenson, D. J. W. Grant and W. B. Gleason, Chem. Mater., 1994, 6, 1148–11158 CrossRef CAS.
- B. Rodríguez-Spong, C. P. Price, A. Jayasankar, A. J. Matzger and N. Rodriguez-Hornedo, Adv. Drug Delivery Rev., 2004, 56, 241–274 CrossRef PubMed.
- S. L. Morissette, Ö. Almarsson, M. L. Peterson, J. F. Remenar, M. J. Read, A. V. Lemmo, S. Ellis, M. J. Cima and C. R. Gardner, Adv. Drug Delivery Rev., 2004, 56, 275–300 CrossRef CAS PubMed.
- G. Bolla and A. Nangia, Chem. Commun., 2016, 52, 8342–8360 RSC.
- S. Chen and X. C. Zeng, J. Am. Chem. Soc., 2014, 136, 6428–6436 CrossRef CAS PubMed.
- A. J. Davidson, I. D. H. Oswald, D. J. Francis, A. R. Lennie, W. G. Marshall, D. I. A. Millar, C. R. Pulham, J. E. Warren and A. S. Cumming, CrystEngComm, 2008, 10, 162–165 RSC.
- C. B. Aakeröy, T. K. Wijethunga and J. Desper, Chem. – Eur. J., 2015, 21, 11029–11037 CrossRef PubMed.
- D. F. Eaton, Science, 1991, 253, 281–287 CrossRef CAS PubMed.
- J. L. Scott and K. Tanaka, Cryst. Growth Des., 2005, 5, 1209–1213 CrossRef CAS.
- A. I. Kitaigorodsky, Mixed Crystals, Springer Berlin Heidelberg, Berlin, Heidelberg, 1984, vol. 33 Search PubMed.
- E. Schur, E. Nauha, M. Lusi and J. Bernstein, Chem. – Eur. J., 2015, 21, 1735–1742 CrossRef CAS PubMed.
- M. Lusi, Cryst. Growth Des., 2018, 18, 3704–3712 CrossRef CAS.
- H. Lu, A. Krishna, S. M. Zakeeruddin, M. Grätzel and A. Hagfeldt, iScience, 2020, 23, 101359 CrossRef CAS PubMed.
- S. Qiu and G. Zhu, Coord. Chem. Rev., 2009, 253, 2891–2911 CrossRef CAS.
- M. Oh, L. Rajput, D. Kim, D. Moon and M. S. Lah, Inorg. Chem., 2013, 52, 3891–3899 CrossRef CAS PubMed.
- A. I. Kitaigorodsky, Molecular Crystals and Molecules, Academic Press, London, 1973 Search PubMed.
- C. M. Reddy, M. T. Kirchner, R. C. Gundakaram, K. A. Padmanabhan and G. R. Desiraju, Chem. – Eur. J., 2006, 12, 2222–2234 CrossRef CAS PubMed.
- A. K. S. Romasanta, D. Braga, M. T. Duarte and F. Grepioni, CrystEngComm, 2017, 19, 653–660 RSC.
- R. Thakuria, N. K. Nath, S. Roy and A. Nangia, CrystEngComm, 2014, 16, 4681–4690 RSC.
- P. Bombicz, N. V. May, D. Fegyverneki, A. Saranchimeg and L. Bereczki, CrystEngComm, 2020, 22, 7193–7203 RSC.
- G. Claeson and R. Backstorm, Arkiv für Kemi, 1960, 15, 241–246 CAS.
- M. R. Edwards, W. Jones, W. D. S. Motherwell and G. P. Shields, Mol. Cryst. Liq. Cryst., 2001, 356, 337–353 CrossRef CAS.
- M. K. Corpinot, R. Guo, D. A. Tocher, A. B. M. Buanz, S. Gaisford, S. L. Price and D.-K. Bučar, Cryst. Growth Des., 2017, 17, 827–833 CrossRef CAS.
- N. W. Thomas and G. R. Desiraju, Chem. Phys. Lett., 1984, 110, 99–102 CrossRef CAS.
- D. Cincic, T. Friščić and W. Jones, Chem. – Eur. J., 2008, 14, 747–753 CrossRef CAS PubMed.
- A. Angeloni, P. C. Crawford, A. G. Orpen, T. J. Podesta and B. J. Shore, Chem. – Eur. J., 2004, 10, 3783–3791 CrossRef CAS PubMed.
- J. A. Pereira, A. M. Pessoa, M. N. D. S. Cordeiro, R. Fernandes, C. Prudêncio, J. P. Noronha and M. Vieira, Eur. J. Med. Chem., 2015, 97, 664–672 CrossRef CAS PubMed.
- K. R. J. Thomas, M. Velusamy, J. T. Lin, C.-H. Chuen and Y.-T. Tao, Chem. Mater., 2005, 17, 1860–1866 CrossRef CAS.
- R. Sathishkumar, S. Mahapatra, T. S. Thakur and G. R. Desiraju, Curr. Sci., 2010, 99, 1807–1811 CAS.
- É. Csikós, G. G. Ferenczy, J. G. Ángyán, Z. Böcskei, K. Simon, C. Gönczi and I. Hermecz, Eur. J. Org. Chem., 1999, 9, 2119–2125 CrossRef.
- Y. Zhan and Y. Wang, Dyes Pigm., 2020, 173, 107971 CrossRef CAS.
- A. Vogel, Textbook of Practical Organic Chemistry, ed. B. S. Furniss, A. J. Hannaford, V. Rogers, P. W. G. Smith and A. R. Tatchell, 4th edn, Longman, London, 1978, p. 916, ISBN 0-582-44350-8 Search PubMed.
- A. Lapworth, J. Chem. Soc., Trans., 1904, 85, 1206–1214 RSC.
- R. Adams and C. S. Marvel, Organic Syntheses Collective Volume, 1941, 1, 94–95 Search PubMed.
- L. Kraszkiewicz, M. Sosnowski and L. Skulski, Tetrahedron, 2004, 60, 9113–9119 CrossRef CAS.
- N. Hayat, N. W. Fenwick, A. Saidykhan, R. Telford, W. H. C. Martin, R. T. Gallagher and R. D. Bowen, Eur. J. Mass Spectrom., 2019, 25, 457–462 CrossRef CAS PubMed.
- G. M. Sheldrick, Acta Crystallogr., Sect. A: Found. Adv., 2015, 71, 3–8 CrossRef PubMed.
- G. M. Sheldrick, Acta Crystallogr., Sect. A: Found. Crystallogr., 2008, 64, 112–122 CrossRef CAS PubMed.
- O. V. Dolomanov, L. J. Bourhis, R. J. Gildea, J. A. K. Howard and H. Puschmann, J. Appl. Crystallogr., 2009, 42, 339–341 CrossRef CAS.
- F. Neese, WIREs Comput. Mol. Sci., 2012, 2, 73–78 CrossRef CAS.
- S. Grimme, J. G. Brandenburg, C. Bannwarth and A. Hansen, J. Chem. Phys., 2015, 143, 054107 CrossRef PubMed.
- A. Gavezzotti, New J. Chem., 2011, 35, 1360–1368 RSC.
- A. Gavezzotti, Molecular Aggregation, Oxford University Press, 2007 Search PubMed.
- J. A. Nelder and R. Mead, Comput J, 1965, 7, 308–313 CrossRef.
- M. J. Turner, J. J. McKinnon, S. K. Wolff, D. J. Grimwood, P. R. Spackman, D. Jayatilaka and M. A. Spackman, CrystalExplorer, University of Western Australia, 2017 Search PubMed.
- S. Grimme, S. Ehrlich and L. Goerigk, J. Comput. Chem., 2011, 32, 1456–1465 CrossRef CAS PubMed; S. Grimme, J. Antony, S. Ehrlich and H. Krieg, J. Chem. Phys., 2010, 132, 154104 CrossRef PubMed; F. Weigend and R. Ahlrichs, Phys. Chem. Chem. Phys., 2005, 7, 3297 RSC; F. Weigend, Phys. Chem. Chem. Phys., 2006, 8, 1057 RSC; A. Hellweg, C. Hattig, S. Hofener and W. Klopper, Theor. Chem. Acc., 2007, 117, 587 Search PubMed; J. Chmela and M. E. Harding, Mol. Phys., 2018, 116, 1523 CrossRef.
- Y. Mo, Wiley Interdiscip. Rev. Comput. Mol. Sci., 2011, 1, 164–171 CrossRef CAS.
- M. Tremayne, L. Grice, J. C. Pyatt, C. C. Seaton, B. M. Kariuki, H. H. Y. Tsui, S. L. Price and J. C. Cherryman, J. Am. Chem. Soc., 2004, 126, 7071–7081 CrossRef CAS PubMed; Z. Zhu, Z. Xu and W. Zhu, J. Chem. Inf. Model., 2020, 60, 2683–2696 CrossRef PubMed.
- A. Poulain, M. Kubicki and C. Lecomte, Acta Crystallogr., Sect. B: Struct. Sci., Cryst. Eng. Mater., 2014, 70, 973–982 CrossRef CAS PubMed.
- S. N. Black, C. L. Woon and R. J. Davey, Cryst. Growth Des., 2018, 18, 6918–6928 CrossRef CAS.
Footnote |
| † Electronic supplementary information (ESI) available: Further experimental data (NMR, PXRD, DSC patterns of samples, crystallographic tables (pdf), crystal structures in cif format). CCDC 2093794–2093797. For ESI and crystallographic data in CIF or other electronic format see DOI: 10.1039/d1ce00878a |
| This journal is © The Royal Society of Chemistry 2021 |

