
 Open Access Article
 This Open Access Article is licensed under a Creative Commons Attribution-Non Commercial 3.0 Unported Licence
Molecular dynamics simulations of hyperbranched poly(ethylene imine)–graphene oxide nanocomposites as dye adsorbents for water purification†
I.
Tanis
 *,
E.
Kostarellou
and
K.
Karatasos
*
*,
E.
Kostarellou
and
K.
Karatasos
*
Laboratory of Physical Chemistry, Department of Chemical Engineering, Aristotle University of Thessaloniki, 54124 Thessaloniki, Greece. E-mail: tanis.ioannis@gmail.com; kkaratas@cheng.auth.gr
First published on 2nd August 2021
Abstract
Atomistically detailed molecular dynamics simulations were employed to study the adsorption capacity of graphene-oxide-based (GO) aqueous systems for the methylene blue (MB) dye in the presence of branched poly(ethylene imine) (BPEI) polymers. The polymeric component was either freely mixed or chemically attached to GO. The main focus was the elucidation of the effects originating from the presence of BPEI molecules in the association of MB with the formed GO complexes. The effect of temperature was also examined. It was found that the presence of the cationic BPEI molecules results in the formation of a distinct microenvironment characterized by a polymer-mediated interconnected morphology which promotes the development of larger-sized MB clusters. These clusters were found to form in the vicinity of the GO flakes, increasing thus the adsorption capacity of the dye molecules in the polymer-containing systems. Particularly in the system with the BPEI-functionalized GO flakes, a persistent percolated structure is formed, which results in a more restricted diffusion of the MB molecules, increasing thus significantly their residence time close to the GO surface. The clustering behavior of MB was found to be temperature-dependent in the BPEI-based models, providing useful information regarding the conditions for optimal adsorption performance of such membranes, in nanofiltration processes.
1. Introduction
Given the continuously growing world population as well as increased industrialization and greater energy needs, addressing the lack of clean water is one of the most important challenges of our time.1,2 Another emerging problem that limits the resources of safe and clear water is the contamination of the latter by micropollutants such as pharmaceuticals and other industrial chemicals.3,4 For instance, organic dyes are often discharged with wastewater into the local environment without adequate treatment. On these grounds, purification of the dye-containing water using an economically feasible and environmentally friendly method before being discharged into natural environment has become extremely urgent.5–73,7-Bis(dimethylamino)phenothiazin-5-ium, commonly known as methylene blue (MB), is one of the most commonly used substances for dyeing and is harmful to humans since it causes increased heart rate, vomiting, shock, jaundice, etc.8,9 Release of MB into wastewaters from the textile, cosmetic, coloring and paper industries thus poses serious environmental problems and its removal from the aqueous phase is of great concern.10,11
Recently, carbon-based materials have emerged as promising candidates in adsorption operations because of their easy accessibility, good mechanical resistance and environmental friendliness.12,13 Graphene and its derivatives appear as particularly appealing candidates as potential dye adsorbents because of their unique, two-dimensional (2D) structure, which exhibits superior adsorption capacity for various dye molecules through π–π stacking interactions.14–18 In addition, the negative charges in the graphene oxide (GO) sheets, due to various oxygen-rich functional groups, trigger additional strong electrostatic interactions with cationic dye molecules.19–23 However, GO sheets exhibit a high dispersibility in water, which inhibits the efficient separation of the dye-adsorbed GO flakes from an aqueous environment. To remedy this, various GO-based adsorbent materials have been fabricated to facilitate the separation of dye-adsorbed GO sheets from aqueous solutions.24–29 Among them, composite GO/poly(ethylene imine) (PEI) hydrogels, targeted for the removal of MB and rhodamine B (RB) organic dyes, have recently been fabricated.30 The former family of polymers are water soluble, and pH and thermal responsive and have been utilized in the past few years for the construction of carbon-based or other composite systems for environmental and biomedical purposes.31–39
Despite the encouraging experimental findings, there remain several challenges related to the fabrication approaches of GO-based adsorbents.40 To address these issues, a thorough understanding of the atomic-scale mechanisms which are responsible for the structure–performance relationship becomes necessary.
Molecular simulations have provided invaluable insights on the structural and thermodynamic properties of GO-based nanocomposites41–43 and have managed to shed light on the associated mechanisms governing their nanofiltration performance at the molecular level, thus complementing pertinent experimental studies.44–47 The adsorption of MB and RB on graphene oxide sheets bearing varying oxidation densities was examined using molecular dynamics (MD) and Monte Carlo simulations.48–52 These studies demonstrated a selective adsorption behavior for cationic dyes, mainly due to π–π electron coupling, and van der Waals and electrostatic interactions stemming from GO. Inclusion of dendritic molecules in GO dispersions was found to improve the adsorption capacity towards metal ions compared to that of pure GO.53
Motivated by previous experimental studies addressing GO/PEI nanocomposites targeted for water purification applications,30,54 in the present work, we focus on the factors governing the adsorption efficiency of GO/branched-PEI (GO/BPEI) nanocomposites towards MB via fully atomistic MD simulations. To shed light on the effect of the hyperbranched polymer on the resulted microstructure and its relation with the adsorption performance of the GO sheets, molecular models with and without the presence of the polymer molecule have been simulated. Furthermore, to assess possible effects of GO/BPEI association on adsorption capacity, BPEI was either chemically attached to the GO surface or dispersed in GO. To our knowledge, no simulation work addressing the adsorption capacity of these systems has been reported so far.
2. System description and computational details
Three aqueous GO-based systems were constructed. The first system was comprised of pristine GO flakes and MB molecules (GOMB), the second of pristine GO flakes, and MB and BPEI molecules (GOHBMB), and the third of BPEI-functionalized GO flakes and MB molecules (GOFMB). An appropriate number of Na+ or Cl− counterions were also added when necessary, in order to preserve the overall electrical neutrality. For all systems, the GO flake assumed lateral dimensions of 40 Å × 32 Å bearing hydroxyl, epoxy and carboxylic groups (see Fig. 1). Following the Lerf–Klinowski model,55 the oxidized groups were placed randomly on both faces of the graphene plane. The resulting chemical formula for the non-functionalized GO was C554H36O112, corresponding to a carbon to oxygen ratio of approximately 5![[thin space (1/6-em)]](https://www.rsc.org/images/entities/char_2009.gif) :1, while the hydroxyl to epoxy group ratio was kept at 3:2. To simulate neutral pH conditions, all the carboxyl groups were taken to be deprotonated while the hydroxyl groups were not ionized.56,57 The modified GO model, was functionalized with 4 BPEI molecules, in a manner appropriate to maintain a symmetric mass distribution with respect to the GO plane.37 The PEI branches were partially ionized to mimic neutral pH conditions as well.35,58 In all systems, the MB concentration was kept constant, amounting to approximately 7 g L−1. Experimental studies exploring the effects of relatively high MB concentrations (as the one invoked here) on the adsorption capacity, have already been performed.59 The ratio of the concentration of GO to that of MB was approximately 7 in the GOMB and GOHBMB systems, and close to 9 in the GOFMB model, similar to analogous ratios explored in pertinent experiments.60,61Table 1 presents the composition of the examined systems.
:1, while the hydroxyl to epoxy group ratio was kept at 3:2. To simulate neutral pH conditions, all the carboxyl groups were taken to be deprotonated while the hydroxyl groups were not ionized.56,57 The modified GO model, was functionalized with 4 BPEI molecules, in a manner appropriate to maintain a symmetric mass distribution with respect to the GO plane.37 The PEI branches were partially ionized to mimic neutral pH conditions as well.35,58 In all systems, the MB concentration was kept constant, amounting to approximately 7 g L−1. Experimental studies exploring the effects of relatively high MB concentrations (as the one invoked here) on the adsorption capacity, have already been performed.59 The ratio of the concentration of GO to that of MB was approximately 7 in the GOMB and GOHBMB systems, and close to 9 in the GOFMB model, similar to analogous ratios explored in pertinent experiments.60,61Table 1 presents the composition of the examined systems.
 | ||
| Fig. 1 (a) The frontal and lateral views of a non-functionalized GO flake, (b) the frontal and lateral views of a functionalized GO flake. Carbon atoms are shown in dark cyan, oxygen atoms in red and hydrogen atoms in white. (c) The branched poly(ethyleneimine) molecule used for the functionalization of GO in the GOFMB system and as a free moiety in the GOHBMB system. (d) Methylene blue chloride. | ||
| Systems | Number of GO flakes | Number of free BPEI molecules | Number of MB molecules | Number of Cl− counterions | Number of Na+ counterions | Number of water molecules |
|---|---|---|---|---|---|---|
| GOMB | 10 | 0 | 40 | 40 | 260 | 90589 |
| GOFMB | 10 | 0 | 40 | 50 | 0 | 90839 |
| GOHBMB | 10 | 40 | 40 | 60 | 0 | 90829 |
Fig. 1 shows the schematics of the different molecules appearing in Table 1.
Description of the energetic parameters for all molecules apart from water (which was taken into account explicitly) was based on the OPLS-AA forcefield.62 This forcefield has been used to parameterize oxidized forms of graphene,63–67 branched poly(ethyleneimine) molecules68 and other imine-based dendritic polymers.69 Water molecules were parameterized using the TIP3P model.70 Depending on the system, an appropriate number of Cl− or NA+ counterions (see Table 1) were also included to maintain the overall electrical neutrality.
The initial state of all systems was constructed using the Packmol package.71 The MD simulations were carried out using the NAMD 2.13 program72 with a cut-off distance of 1.2 nm for the van der Waals interactions, following the isothermal–isobaric ensemble, at P = 1 bar and at temperatures of 290 K, 300 K and 310 K. Periodic boundary conditions were invoked with particle-mesh Ewald (PME) electrostatics.73 Numerical solution of the equations of motion was performed using the velocity-Verlet scheme, with 1 fs timestep and a frame saving frequency of 5 ps. Pressure was controlled using the Nose–Hoover Langevin method,74 with a piston period of 0.1 ps and a decay time of 0.05 ps. Temperature control was performed via the Langevin algorithm using a damping coefficient of 5 ps−1.
Prior to the production runs, the systems were subjected to energy minimization, followed by MD equilibration between 100 ns and 200 ns, depending on the model. After the equilibration, stabilization of energetic and structural parameters was attained, including total and partial energies, the overall density, and the average distance between the molecular components. Finally, trajectories of at least 100 ns length after equilibration were generated in the NPT ensemble. The average size of the simulation box at equilibrium within the examined temperature range, varied between 140.0 Å and 140.6 Å, 140.6 Å and 141.3 Å and 140.6 Å and 141.3 Å for the GOMB, GOHBMB and GOFMB models, respectively. Post analysis of the equilibrated trajectories was performed by custom made routines. Fig. S1 in the ESI† portrays the initial configurations of the examined systems at T = 300 K.
3. Results and discussion
A. Structural properties
Fig. 2 displays RDFs arising from the center of mass of the GO sheets at T = 300 K.
 | ||
| Fig. 2 Radial distribution functions arising (a) from the centers of mass of the GO flakes and (b) from the MB molecules in the GOHBMB, GOMB and GOFMB models at T = 300 K. | ||
Focusing on Fig. 2a we can observe several peaks in the spectra of the models containing the polymer component (either as free molecules or covalently attached onto the GO sheets). This picture is similar to the behavior observed previously in dendrimer/GO hydrated membranes,75 and is reminiscent of the degree of order met in semicrystalline materials.76 However, this is not the case in the GOMB model where the non-zero values are detected only at distances higher than 35 Å. The absence of sharp peaks in the spectra of this model, is consistent with the amorphous arrangement of the GO flakes. The same qualitative description applies also for the relative arrangement of the GO centers of mass at the other examined temperatures (see Fig. S2 in the ESI†). In the polymer-containing systems, although both the spectra are characterized by several peaks at shorter distances, distinct features can be observed when comparing these models at a constant temperature. The first neighbor peaks are detected at around 14 Å and 21–23 Å for the GOFMB and GOHBMB model respectively, with the peak intensity being much higher for the former system. A separation distance of 14 Å corresponds roughly to the double of the polymer's radius of gyration, i.e. the closest possible distance between two GO flakes, implying a high probability of close GO contacts with the average distance between GO sheets, commensurate to the size of the grafted PEI molecules. A visual inspection of the RDF spectra of the GOFMB system reveals a second, less intense peak, at approximately 26 Å, i.e., at a distance nearly twice as much, compared to the position of the first peak. This observation is consistent with the formation of GO aggregates with at least 3 GO flakes. Indications for GO cluster formation are also present in the system where BPEI molecules are dispersed as separate moieties among the GO flakes, due to the appearance of a peak in the corresponding RDF spectra at a separation somewhat larger than 20 Å. The rather low intensity of the first-neighbor peak in the latter model implies a considerably lower degree of structural order of the GO flakes in the GOHBMB system. Fig. 2b portrays the pair RDF spectra arising from the centers of mass of the MB in the examined systems. A visual comparison of the pair RDFs shows that the spatial arrangement of the MB molecules shares some common features in the 3 different models. The first neighbor peak is detected in all systems at around 5 Å. The latter distance corresponds roughly to the size of a MB molecule, implying the formation of MB clusters. The highest intensity of this peak is observed in the GOFMB model, indicating that the spatial arrangement of the MB molecules is more persistent in this system. A double peak close to a 10 Å separation, can also be observed. This feature can be accounted for, if we assume that the two neighboring peaks arise from second-neighbor MB molecules which take somewhat different conformations. The intensity of the first-neighbor peak (see Fig. S3 in the ESI†) shows a tendency to drop upon increase in temperature for the GOFMB and GOHBMB systems, but not for the GOMB model. Therefore, the clustering behavior of MB molecules appears to be much more temperature-dependent in the polymer containing systems. A visual impression of equilibrated configurations of the examined systems, is provided in Fig. 3.
 | ||
| Fig. 3 Equilibrated configurations of the examined systems: (a) GOMB (b) GOFMB and (c) GOHBMB. Carbon atoms are shown in dark cyan, oxygen atoms in red and hydrogen atoms in white; yellow and blue beads correspond to the Na+ and the Cl− counterions, respectively. The free BPEI molecules in the GOHBMB system are shown in purple. Water molecules are not shown for clarity. | ||
In line with the picture arising from the interpretation of the RDF spectra, the GOMB model (Fig. 3a) is characterized by dispersed GO flakes, with the MB molecules located preferentially close to the GO surface. In the GOFMB system (Fig. 3b), a more interconnected structure is observed, with the dye molecules forming aggregates not only on the GO surface, but also close to the grafted BPEI branches. In the GOHMB system (Fig. 3c), BPEI-mediated GO aggregates can be observed, but these aggregates appear to be dispersed instead of forming an overall interconnected structure. The dye molecules appear to associate either with the BPEI molecules or with the GO flakes.
| P2(cosθ) = 〈(cos2θ − 1)/2〉 | (1) |
 | ||
| Fig. 4 Orientational order parameter (see text) of (a) the GO flakes and (b) the MB molecules in the GOHBMB, GOMB and GOFMB models as a function of the center of mass separation between two molecules, at T = 300 K. | ||
Focusing on the orientational order parameter of GO (Fig. 4a), it is shown that in the polymer-containing systems and at separations up to about 20 Å, GO flakes adopt an almost parallel orientation, while at separations up to 25 Å, a degree of parallel ordering is still present. Since such separations refer to first-neighbor distances (see Fig. 2a), it appears probable that GO flakes which come at such close distances adopt stacked configurations. In the GOMB system, a tendency for almost parallel GO orientation at the closest separation at which the respective RDF spectra assume non-zero values, is also present, but this occurrence is rather scarce, as implied by the respective low RDF values (see Fig. 2a). This picture describes also the behavior of the GO orientational parameter at the other temperatures examined (see Fig. S4 in the ESI†).
Fig. 4b portrays the orientational order parameter of the MB molecules in the different systems at T = 300 K. In this case, P2 probes the degree of alignment of the MB molecules in the direction of their longest dimension. At a separation close to the location of the first-neighbor peak in the respective RDF (see Fig. 2b), only in the GOFMB system does a tendency for alignment of the MB molecules is present. The same tendency persists at the other temperatures examined, as well (see Fig. S5 in the ESI†). This behavior might be related to the difference in the spatial arrangement of the GO flakes and the structural stability of this arrangement in the 3 models (see Fig. 2a and the relevant discussion in Section 3.A.1), which could impose different geometric constraints for those MB molecules that become physically adsorbed onto the GO flakes.
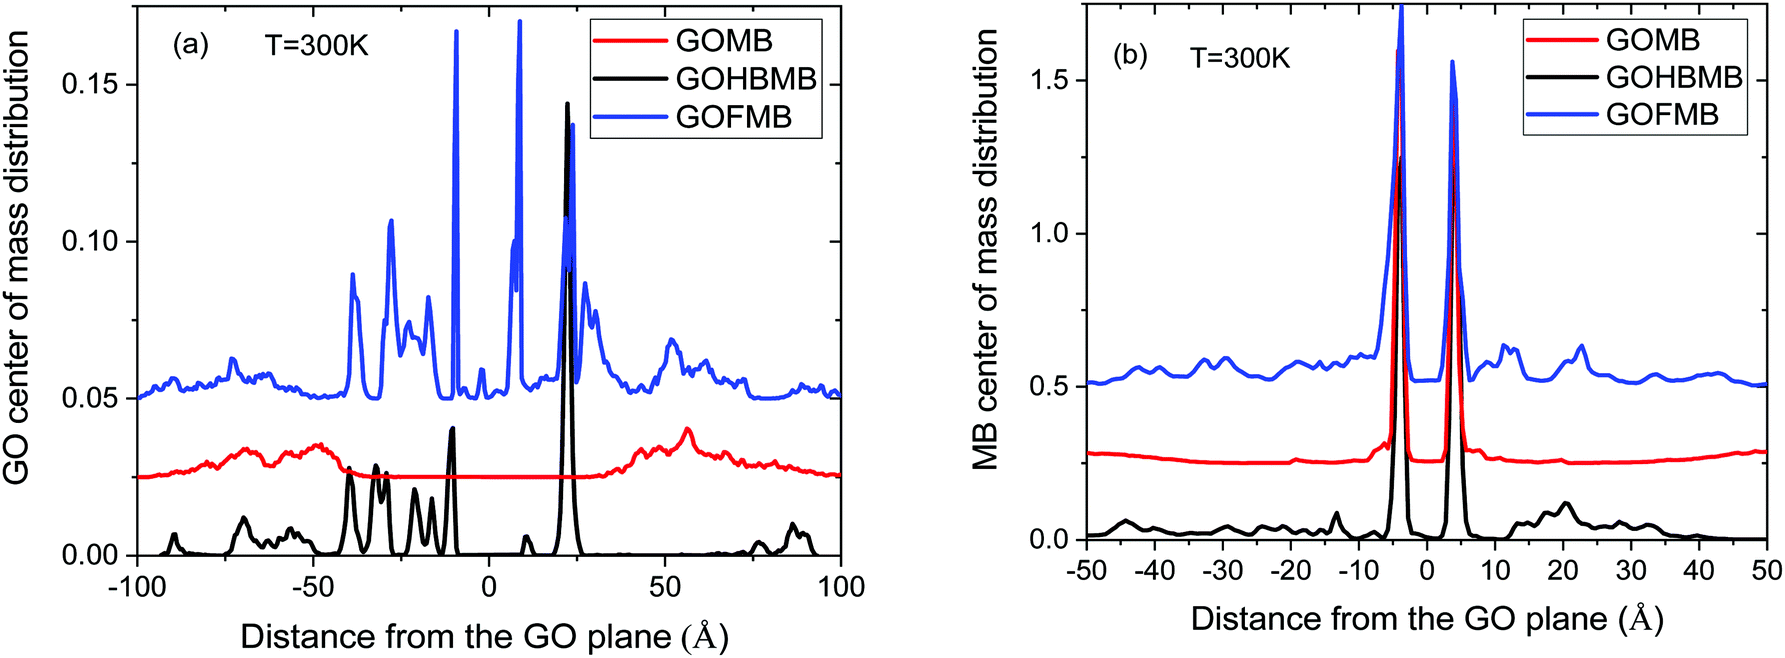 | ||
| Fig. 5 Center of mass distribution profiles of (a) the GO and (b) the MB molecules in a direction normal to the GO plane, for the GOHBMB, GOMB and GOFMB models, at T = 300 K. Distance 0 denotes the position of the GO plane. Positive and negative coordinates correspond to placements of the molecules on the right and left sides of the plane of the reference GO molecule, respectively. The spectra of GOMB and GOFMB are shifted by 0.025 and 0.05, respectively, in the y-axis for clarity. | ||
Focusing on the distributions of the GO molecules (Fig. 5a), at distances close to GO, sharp peaks characterize the profiles of the polymer-containing systems. These peaks denote a preferential placement of the GO flakes close to the reference GO surface. The number of the observed maxima is higher in the GOFMB model, in agreement with the respective RDF spectra presented earlier, indicating a polymer-mediated persistent spatial arrangement of the GO sheets. In contrast, the curve representing the BPEI-free model, exhibits only broad peaks at relatively long distances from both sides of the GO flake (∼50 Å), corroborating the results from the RDF analysis (Section 3.A.1). A similar behavior is also observed in the analogous spectra at other temperatures examined (see Fig. S6 in the ESI†). Based on the above directional distributions, we can estimate the average number of neighboring GO flakes in a direction perpendicular to its plane in the polymer containing models by integrating the relevant profiles. Integration within a distance of 30 Å ambilateral from the central GO flake (i.e., up to the distance defined by the second neighbor peak in the RDF shown in Fig. 2a), renders a number between 1.1 and 1.2 for the GOFMB model and 0.5 to 0.6 for the GOHBMB model at all the examined temperatures. Taking into account (as discussed in Section 3.A.2) that at such close a distance, a neighbor of the GO flake is highly probable to adopt an orientation parallel to it, it appears that the formation of stacked GO pairs is twice as probable in the GOFMB system, compared to the case where the BPEI molecules are not chemically attached to the GO flake (the GOHBMB system).
Concerning the respective distributions of the dye molecules (Fig. 5b), sharp peaks close to the GO surface are detected in all systems, thus confirming the physical association between the two moieties. In the BPEI-free system, the distribution exhibits negligible values at distances greater than 10 Å, contrary to its polymer-containing counterparts. Therefore, it appears that the presence of the polymer molecules (whether covalently attached to GO or not) results in a higher probability to find MB molecules in the close vicinity of the GO surface. To quantify this observation, we have calculated the average number of dye molecules in a direction normal to GO, by integrating the spectra depicted in Fig. 5b, up to a distance of 30 Å from both sides of a GO flake. This distance was selected in order to include also the MB molecules that remain close to the GO sheets due to their association with the polymeric components. Within the examined temperature interval, this calculation resulted in the number of MB molecules per GO flake, ranging between 3.9 and 4.1 for the GOMB model, between 6.4 and 5.7 for the GOHBMB model, and between 7.1 and 7.5 for the GOFMB model (or in terms of MB molecules per unit surface area of a GO sheet, approximately 0.31 MB per nm2 for the GOMB system, 0.47 MB per nm2 for the GOHBMB system and 0.57 MB per nm2 for the GOFMB system). In other words, the presence of the polymeric moiety increases the probability of the MB molecule to remain in the vicinity of a GO sheet, by about 40% (the GHBMB system) to 80% (the GFMB system), compared to the polymer-free system.
For a better understanding of the contribution of the BPEI component in the tendency of MB molecules to reside close to the GO flakes, electrostatic interactions should be taken into account as well. As it has been previously reported,75 electrostatic interactions between PAMAM dendrimers and GO are among the main driving forces for the self-assembly and the stabilization of the GO–polymer nanocomposites.78 To obtain information regarding the effective surface charge of the GO flakes, we have monitored how the effective charge is distributed close to the GO surface (see Fig. S7 in the ESI†). In the case of the GOMB system, the Na+ counterions only partially neutralize the negative charge arising from the oxygen groups of GO (i.e., there is no Na+ condensation on the GO surface), so that a negative peak ambilateral to the GO plane survives. The key difference between the polymer-free model (GOMB) and the polymer containing models is the positive-charge peaks arising from the protonated amine groups of the BPEI molecules. Therefore, the presence of the protonated polymers essentially create a polar environment close to the GO surface, which can enhance the interaction of GO with the polar dye molecules. The effective negative charge present in the polymer-free system acts towards a better dispersion of the GO sheets and thus against the formation of large GO aggregates. On the other hand, the polar environment close to the GO surface imparted by the protonated polymers strengthens the interaction, not only between the GO fakes and the MB molecules, but also between the GO molecules themselves, thus favoring the formation of larger GO aggregates, as this was implied by the corresponding GO RDFs and the relevant snapshots (see Fig. 2a and 3).
B. MB clustering analysis
The clustering behavior of MB is directly related to the degree of the association with the GO-based nanocomposites as well as to their interactions with the water molecules. It is therefore of interest to study certain aspects of this behavior in the examined systems and as a function of temperature. To this end, we have carried out a cluster formation analysis using the DBSCAN algorithm.79 In the application of this algorithm, we have taken that each cluster should contain at least 2 MB molecules, whereas the search radius for neighboring molecules was determined from the location of the first peak of the MB–MB pair correlation function (i.e., 7 Å, see Fig. 3b). Fig. 6 presents the size distribution of the dye clusters formed in the examined systems.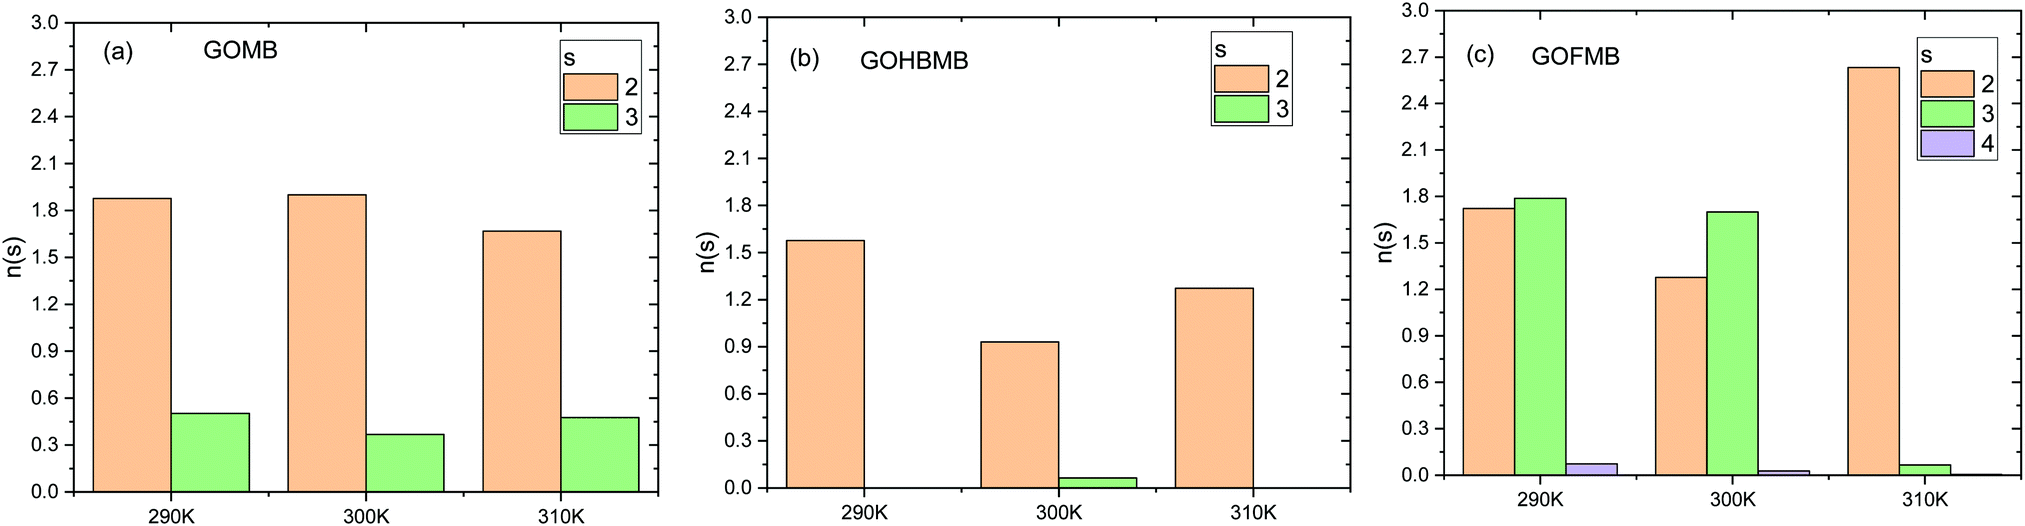 | ||
| Fig. 6 Number of formed clusters, n(s), as a function of the cluster size s, in (a) the GOMB (b) GOHBMB, and (c) GOFMB model, calculated at T = 290, 300 and 310 K. The color code in the legends indicate the average number of molecules participating in the formed clusters (i.e., the cluster population). | ||
It can readily be observed that the examined systems present different clustering behaviors with respect to the dye molecules, at all temperatures. As a general remark, the most frequently observed cluster size in all systems is 2. Another common feature in all systems is that the maximum number of formed clusters appears at the lowest temperature examined (note that each molecule can participate only in one cluster). This appears to be consistent with a higher probability for a breakage of clusters once the kinetic energy of the system increases. Apart from these similarities, several distinct features among the examined systems can be observed. As far as the temperature dependence of the clustering behavior is concerned, this appears to be stronger in the polymer-containing systems. Cluster formation in the GOMB system is practically temperature-independent, while among the BPEI-containing systems, the GOFMB system exhibits the larger differentiation on temperature changes. This is consistent with the picture described earlier in Section 3.A.1. The larger number of MB molecules participating in clusters, is found for the GOFMB system. In the same system, a higher probability for the formation of clusters with a larger size is observed. Combination of this information with the picture described in Section 3.A.3, implies that the MB molecules that are close to the GO surface, preferentially form pairs and some of them form clusters that are larger in size.
C. Dynamic properties
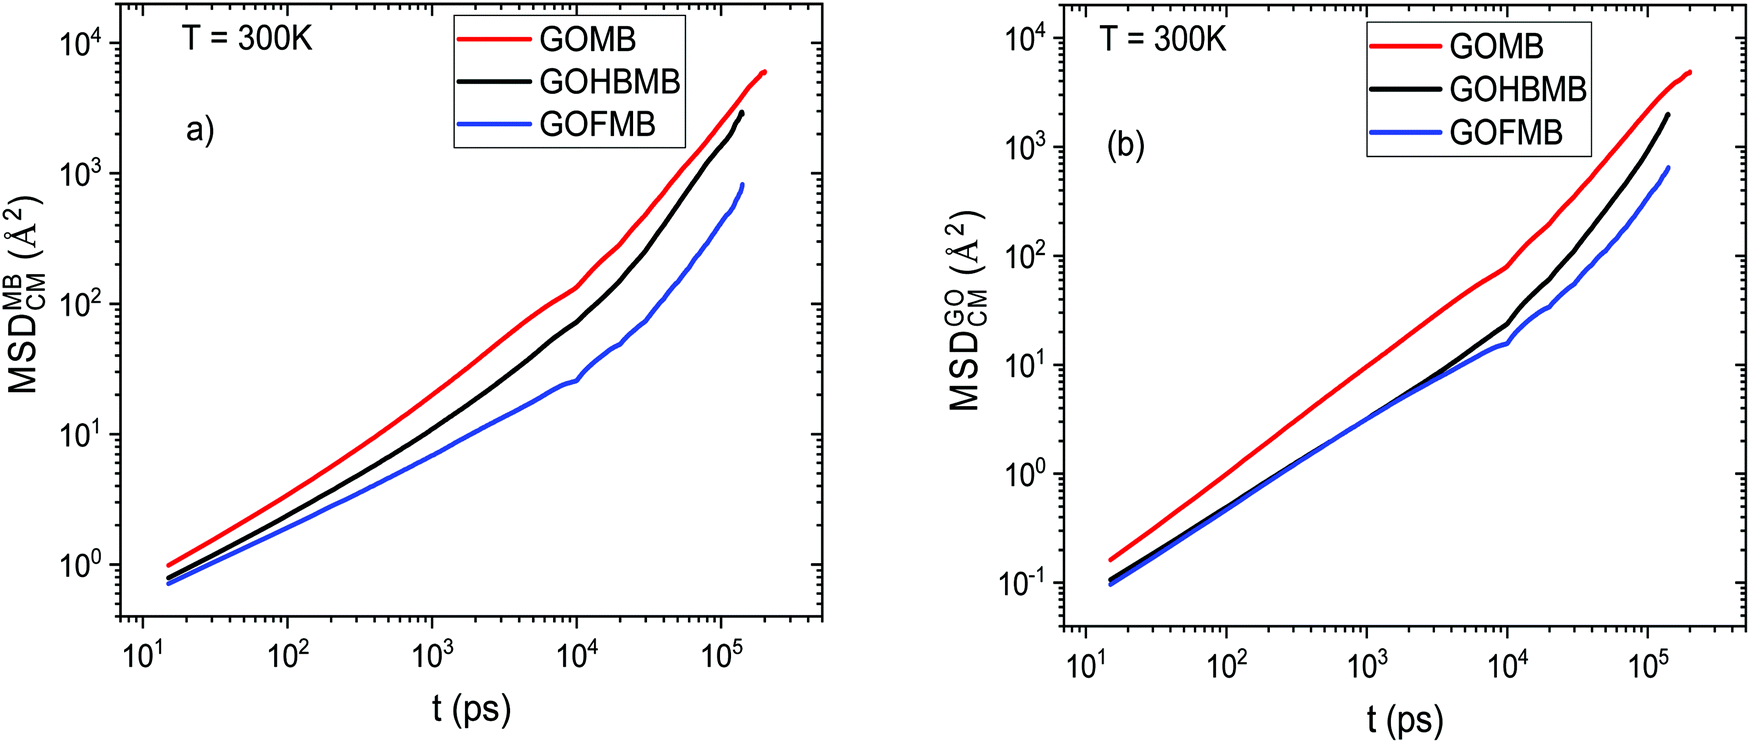 | ||
| Fig. 7 MSD of the centers of mass of (a) the dye molecules and (b) the GO flakes, at T = 300 K. | ||
Fig. 7a shows that the dye molecules are more mobile in the BPEI-free system. The same qualitative picture describes the diffusive behavior of the MB molecules at other temperatures examined, as well (see Fig. S8 in the ESI†). The reduced average mobility shown in the polymer-containing models could be related to the higher number of the physically adsorbed MB molecules, either directly onto the GO surface, or onto the polymeric components, as it can be inferred from the discussion in Section 3.A.3. This occurrence, should also be combined with the tendency for the formation of clusters that are larger in size (and thus slower diffusing) in the polymer-containing systems (Section 3.B). In addition, the slower diffusion of the GO flakes in the GOHBMB and GOFMB models (as shown in Fig. 7b), might also result in a slower diffusive motion of MB, since the average mobility of any adsorbed dye molecule is significantly affected by that of the particle upon which it is adsorbed.
The change in slope observed in the MSD curves at a timescale close to 104 ps was found to be related to the “decaging” process of the GO and the MB molecules, from the restricted microenvironment formed by their neighboring molecules.80
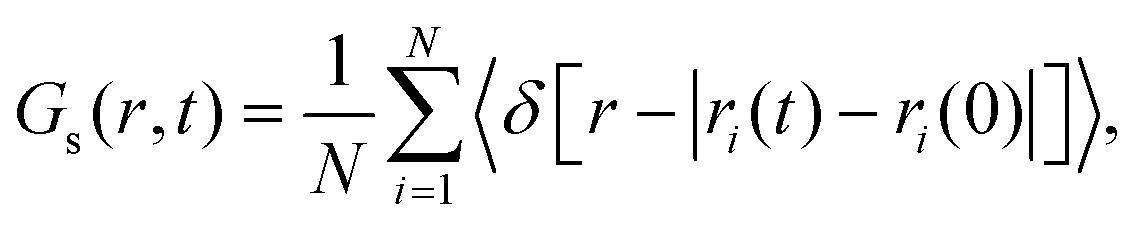
Among the GOHBMB and GOFMB systems, MB molecules exhibit the lowest mobility in the GOFMB model, with the deviation from the other systems’ mobilities increasing in the long-time limit. This behavior can be described in more detail, using the Van Hove space–time correlation function.81 The self-part, monitoring the self-diffusion of the examined particles is given by
 | (2) |
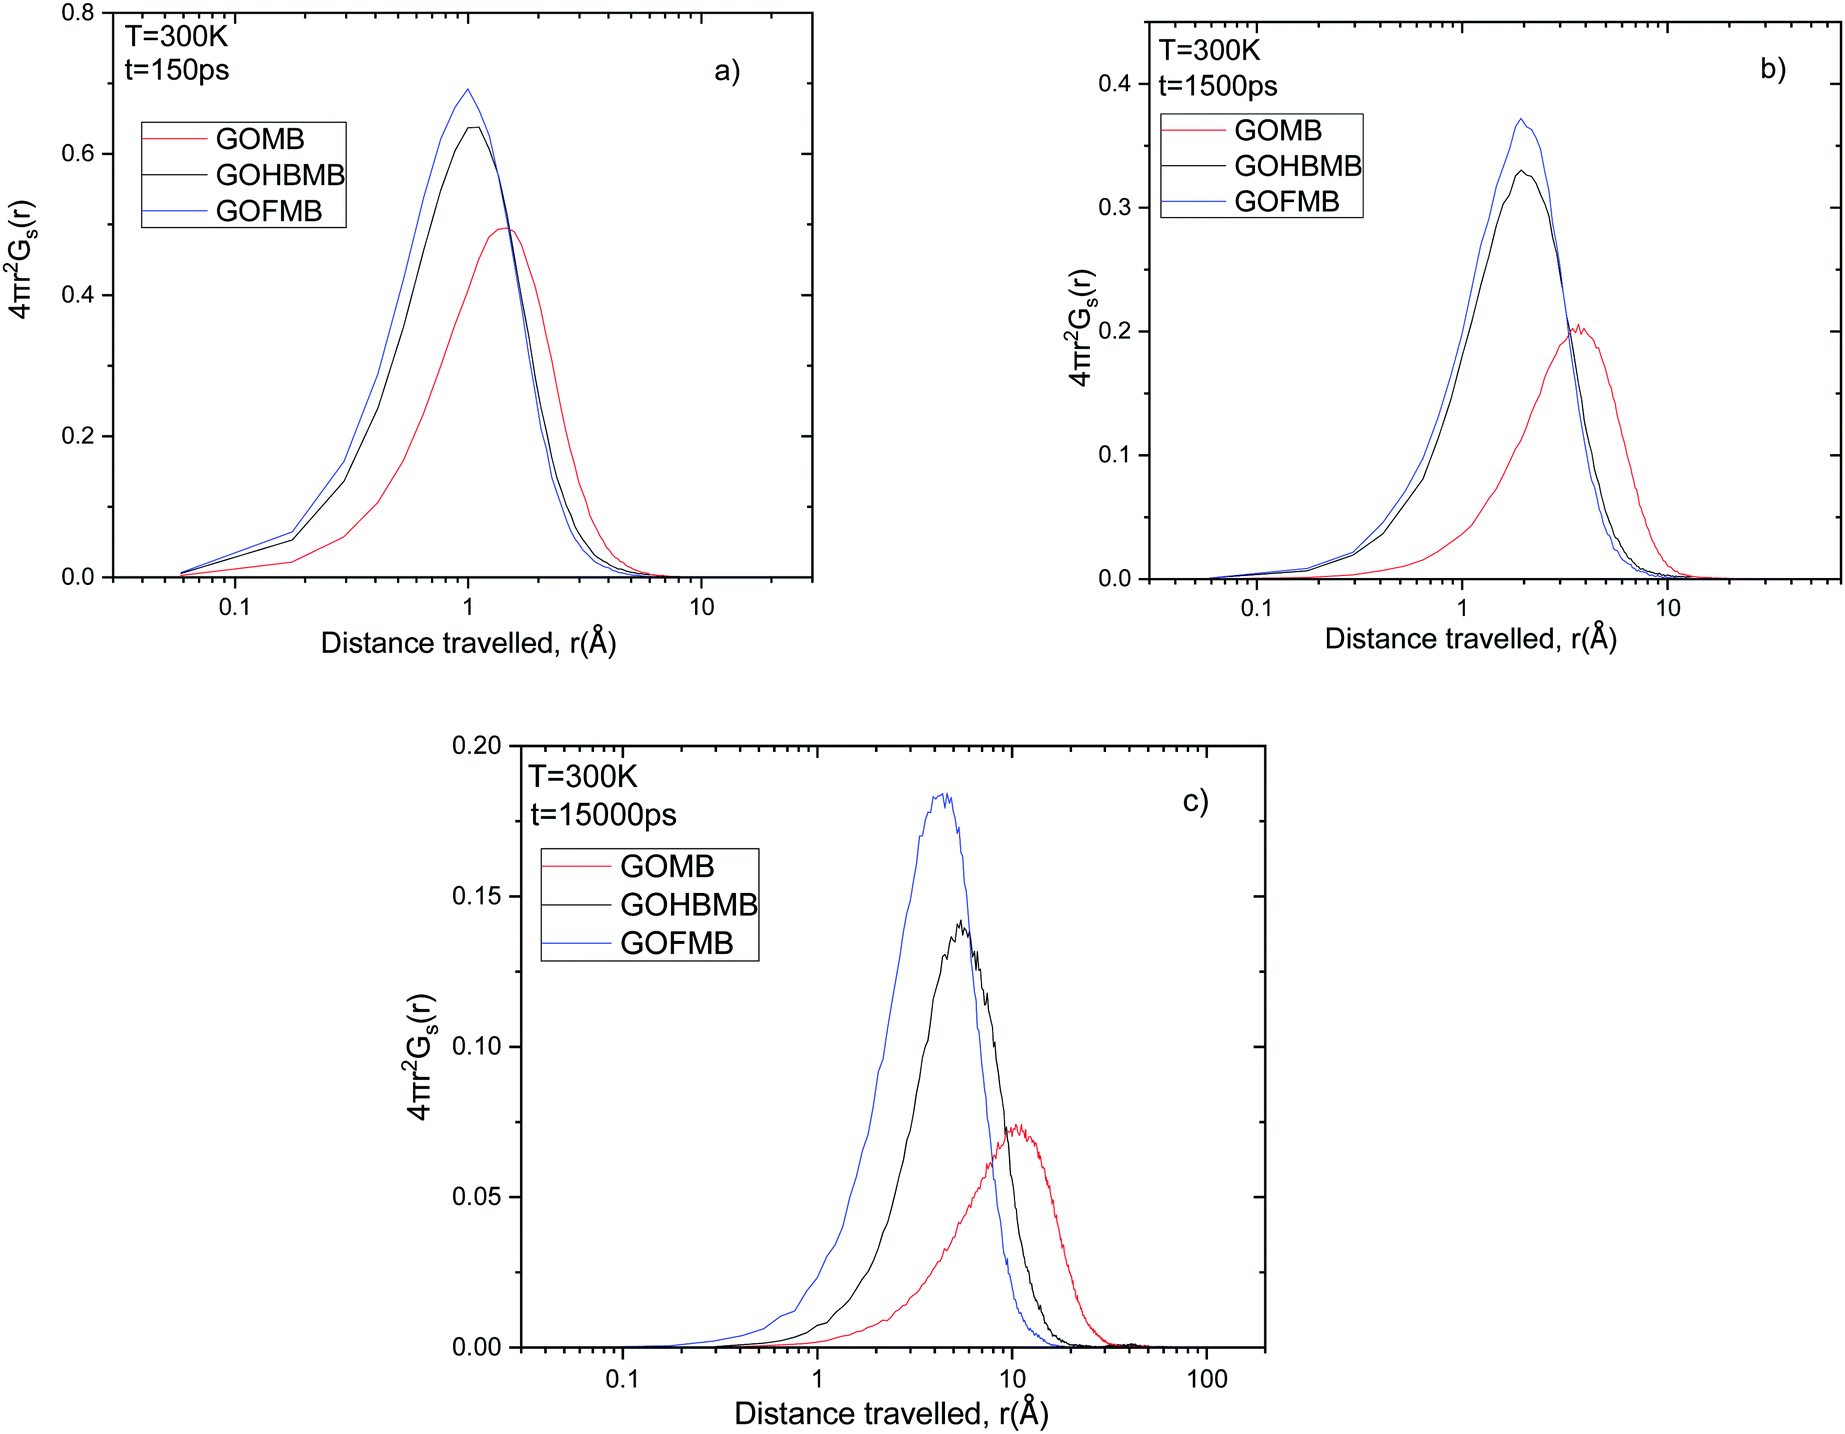 | ||
| Fig. 8 Comparison of the self van Hove functions (multiplied by 4πr2) describing MB motion in all systems at times (a) t = 150 ps, (b) t = 1500 ps and (c) t = 15000 ps. | ||
The smaller dispersion in the distribution of the distances travelled by the MB molecules in these systems implies that they experience a more restricted environment, allowing only local rearrangements. This observation is consistent with the discussion in Sections 3.A and B, regarding the associative characteristics between the MB molecules and between the MB molecules and the GO flakes or the polymeric component. These differences in the spectral characteristics of the Van Hove functions between the GOMB and polymer containing systems, become more pronounced at longer times as it can be inferred from Fig. 8b and c. As the timescale increases, small differences can also be observed between the GOFMB and GOHBMB systems. The peak position in the GOHBMB systems shifts to slightly longer distances, while there is also a small difference in the amplitudes of the respective curves. These features lie in accordance with the behavior noted in the respective MSD curves (Fig. 7). Analogous trends were observed at other temperatures studied, as well (Fig. S9 in the ESI†).
 | (3) |
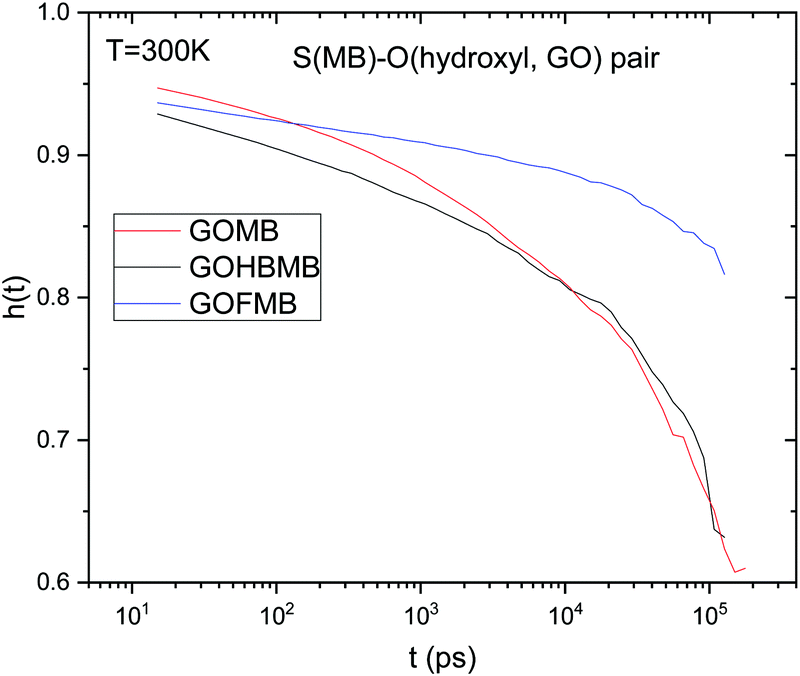 | ||
| Fig. 9 Sulfur (MB)–hydroxyl oxygen (GO) pair correlation functions at T = 300 K, for all the examined models. | ||
A visual inspection of Fig. 9 shows that the sulfur (MB)–hydroxyl oxygen (GO) h(t) functions do not decorrelate completely within the timescale of the simulation runs. This implies that the characteristic residence time of the MB molecules close to the GO surface is considerably longer compared to a timescale of the order of ∼100 ns, which corresponds to the examined simulation window. The degree of decorrelation within the examined time window indicates that h(t) drops significantly slower in the GOFMB model. At T = 300 K, the degree of decorrelation of h(t) is comparable between the GOMB and GOHBMB models. This picture does not change significantly within the temperature windows examined (see Fig. S10 in ESI†). The observed behavior indicates that the chemical attachment of BPEI onto the GO sheets results in a local environment, which promotes a longer residence time of the MB molecules on the GO surface.
4. Conclusions
Fully atomistic molecular dynamics simulations have been performed for the first time in hydrated hyperbranched PEI/graphene oxide nanocomposites, in order to examine their adsorption capacity towards methylene blue organic dyes. The main objective of this study was to examine the effect of the presence of a hyperbranched polymer, either covalently attached to the GO plane or dispersed in the hydrated system, on the adsorption performance of the GO-based hydrated composite membranes. The systems were simulated in a neutral pH environment and under fully hydrated conditions, similar to pertinent experimental works.The structural analysis of the formed nanocomposites revealed a higher degree of structural coherence in the case where BPEI was chemically attached to the GO flakes, and a higher tendency of the GO flakes to form stacked configurations. This suggests that the structural stability of the hydrated membranes and the separation distance between the flakes can be tuned by incorporating hyperbranched structures of different sizes, thus rendering such systems potential candidates for molecular sieving applications. A tendency for the formation of stacked GO configurations was also noticed in the system containing the GO–BPEI mixture, but this was less pronounced. This tendency could originate from, or facilitated by, the polar nature of the GO aggregates, induced by the presence of the positively charged PEI molecules. On the other hand, the GO flakes present no orientation tendency in the polymer-free model and they adopt a less ordered configuration compared to their counterparts in the polymer-containing systems. The percolated structure formed mainly by the GOFMB model and to a lesser degree by the GOHBMB model might be of technological value if the differences in polarity and in ionic conductivity from the polymer-free system can be exploited by tuning the microstructure (and thus the degree of the MB adsorption) through the application of an electric field.83,84 The probability of finding a dye molecule in proximity to a GO flake was found to increase in the presence of the polymeric component, and to be higher in the GOFMB model. In the latter model, it was found that the average number and the average size of the formed MB clusters were larger. The distribution of the size of the MB clusters and generally the associative behavior between the MB molecules were found to depend on temperature only in the polymer-containing systems, and between them, to a higher degree in the GOFMB model. Given the longer residence time of the MB molecules that are physically adsorbed onto the GO surface and the temperature insensitivity of the MB organization close to GO in the polymer-free model, it can be surmised that this temperature dependence of the MB clustering behavior could be related to MB clusters formed close to the polymeric component.
Analysis of the dynamics of the dye molecules demonstrated a higher diffusivity in the polymer-free system. This information, combined with the characteristics of the distributions of the distances travelled by the MB molecules, showed that the dye moieties experience a more restricted environment in the polymer-containing systems.
The molecular-level description provided in the present study emphasizes the importance of the control of the microstructure in such GO-based nanocomposite membranes towards the optimization of their performance in sieving and nanofiltration applications.
Conflicts of interest
There are no conflicts to declare.Acknowledgements
This work was performed under the Project HPC-EUROPA3 (INFRAIA-2016-1-730897) with the support of the EC Research Innovation Action under the H2020 Programme; in particular, I. T. gratefully acknowledges the hospitality of Prof. Kostas Karatasos and the Department of Chemical Engineering, AUTH and the computer resources and technical support provided by ARIS cluster (Athens). Use of the AUTh High Performance Computing (HPC) infrastructure of the Aristotle University of Thessaloniki is also acknowledged.References
- J. R. Werber, C. O. Osuji and M. Elimelech, Nat. Rev. Mater., 2016, 1, 16018 CrossRef CAS.
- A. Anand, B. Unnikrishnan, J.-Y. Mao, H.-J. Lin and C.-C. Huang, Desalination, 2018, 429, 119–133 CrossRef CAS.
- M. A. Shannon, P. W. Bohn, M. Elimelech, J. G. Georgiadis, B. J. Mariñas and A. M. Mayes, Nanoscience and Technology, Macmillan Publishers Ltd, UK, 2009, pp. 337–346 DOI:10.1142/9789814287005_0035.
- Y.-R. Zhang, S.-L. Shen, S.-Q. Wang, J. Huang, P. Su, Q.-R. Wang and B.-X. Zhao, Chem. Eng. J., 2014, 239, 250–256 CrossRef CAS.
- G. A. Kloster, M. A. Mosiewicki and N. E. Marcovich, Carbohydr. Polym., 2019, 221, 186–194 CrossRef CAS PubMed.
- K. C. Kemp, H. Seema, M. Saleh, N. H. Le, K. Mahesh, V. Chandra and K. S. Kim, Nanoscale, 2013, 5, 3149–3171 RSC.
- C. Namasivayam and D. Sangeetha, J. Hazard. Mater., 2006, 135, 449–452 CrossRef CAS PubMed.
- K. V. Kumar and A. Kumaran, Biochem. Eng. J., 2005, 27, 83–93 CrossRef CAS.
- A. Özer and G. Dursun, J. Hazard. Mater., 2007, 146, 262–269 CrossRef PubMed.
- Y. Zhou, L. Zhang and Z. Cheng, J. Mol. Liq., 2015, 212, 739–762 CrossRef CAS.
- M. Rafatullah, O. Sulaiman, R. Hashim and A. Ahmad, J. Hazard. Mater., 2010, 177, 70–80 CrossRef CAS PubMed.
- P. Sun, K. Wang and H. Zhu, Adv. Mater., 2016, 28, 2287–2310 CrossRef CAS PubMed.
- L. Hu, Z. Yang, Y. Wang, Y. Li, D. Fan, D. Wu, Q. Wei and B. Du, Sci. Rep., 2017, 7, 3611 CrossRef PubMed.
- A. K. Geim and K. S. Novoselov, Nat. Mater., 2007, 6, 183–191 CrossRef CAS PubMed.
- D. Li and R. B. Kaner, Science, 2008, 320, 1170–1171 CrossRef CAS PubMed.
- A. K. Geim, Science, 2009, 324, 1530–1534 CrossRef CAS PubMed.
- X. Huang, X. Qi, F. Boey and H. Zhang, Chem. Soc. Rev., 2012, 41, 666–686 RSC.
- J. Hou, Y. Chen, W. Shi, C. Bao and X. Hu, Appl. Surf. Sci., 2020, 505, 144145 CrossRef CAS.
- P. Sharma and M. R. Das, J. Chem. Eng. Data, 2012, 58, 151–158 CrossRef.
- S. L. Zhang and X. Huang, Modell. Simul. Mater. Sci. Eng., 2011, 19, 054004 CrossRef.
- Z. Sui, X. Zhang, Y. Lei and Y. Luo, Carbon, 2011, 49, 4314–4321 CrossRef CAS.
- C. N. R. Rao, A. K. Sood, K. S. Subrahmanyam and A. Govindaraj, Angew. Chem., Int. Ed., 2009, 48, 7752–7777 CrossRef CAS PubMed.
- S. Wu, Q. He, C. Tan, Y. Wang and H. Zhang, Small, 2013, 9, 1160–1172 CrossRef CAS PubMed.
- Z. Geng, Y. Lin, X. Yu, Q. Shen, L. Ma, Z. Li, N. Pan and X. Wang, J. Mater. Chem., 2012, 22, 3527 RSC.
- W. MingYan, Z. Wei, Z. DongEn, L. ShuAn, M. WeiXing, T. ZhiWei and C. Jun, Mater. Lett., 2014, 137, 229–232 CrossRef.
- F. Liu, S. Chung, G. Oh and T. S. Seo, ACS Appl. Mater. Interfaces, 2012, 4, 922–927 CrossRef CAS PubMed.
- O. Akhavan, E. Ghaderi and A. Esfandiar, J. Phys. Chem. B, 2011, 115, 6279–6288 CrossRef CAS PubMed.
- Y. Huang, M. Zeng, J. Ren, J. Wang, L. Fan and Q. Xu, Colloids Surf., A, 2012, 401, 97–106 CrossRef CAS.
- R. P. Medina, E. T. Nadres, F. C. Ballesteros and D. F. Rodrigues, Environ. Sci.: Nano, 2016, 3, 638–646 RSC.
- H. Guo, T. Jiao, Q. Zhang, W. Guo, Q. Peng and X. Yan, Nanoscale Res. Lett., 2015, 10, 931 Search PubMed.
- H. Kim, R. Namgung, K. Singha, I.-K. Oh and W. J. Kim, Bioconjugate Chem., 2011, 22, 2558–2567 CrossRef CAS PubMed.
- T. Ren, L. Li, X. Cai, H. Dong, S. Liu and Y. Li, Polym. Chem., 2012, 3, 2561–2569 RSC.
- L. Yan, Y.-N. Chang, L. Zhao, Z. Gu, X. Liu, G. Tian, L. Zhou, W. Ren, S. Jin, W. Yin, H. Chang, G. Xing, X. Gao and Y. Zhao, Carbon, 2013, 57, 120–129 CrossRef CAS.
- Y. Xie, Microchim. Acta, 2018, 185, 351 CrossRef PubMed.
- Z. Sideratou, M. Agathokleous, T. A. Theodossiou and D. Tsiourvas, Biomacromolecules, 2018, 19, 315–328 CrossRef CAS PubMed.
- H. Ahmad, C. Cai and C. Liu, Microchem. J., 2019, 145, 833–842 CrossRef CAS.
- F. Morales-Lara, M. Domingo-García, R. López-Garzón, M. Luz Godino-Salido, A. Peñas-Sanjuán, F. J. López-Garzón, M. Pérez-Mendoza and M. Melguizo, Sci. Technol. Adv. Mater., 2016, 17, 541–553 CrossRef CAS PubMed.
- M. Arkas, R. Allabashi, D. Tsiourvas, E.-M. Mattausch and R. Perfler, Environ. Sci. Technol., 2006, 40, 2771–2777 CrossRef CAS PubMed.
- X. Zhang, Y. Liu, C. Sun, H. Ji, W. Zhao, S. Sun and C. Zhao, RSC Adv., 2015, 5, 100651 RSC.
- N. B. Singh, G. Nagpal, S. Agrawal and Rachna, Environ. Technol. Innovation, 2018, 11, 187–240 CrossRef.
- K. Karatasos and G. Kritikos, RSC Adv., 2016, 6, 109267 RSC.
- S. Yang, S. Kwon, M. Y. Lee and M. Cho, Composites, Part B, 2019, 164, 425–436 CrossRef CAS.
- M. Azimi, S. S. Mirjavadi, A. M. S. Hamouda and H. Makki, Macromol. Theory Simul., 2017, 26, 1600086 CrossRef.
- M. Dadashi Firouzjaei, F. Akbari Afkhami, M. Rabbani Esfahani, C. H. Turner and S. Nejati, J. Water Process. Eng., 2020, 34, 101180 CrossRef.
- B. Zheng, Y. Tian, S. Jia, X. Zhao and H. Li, J. Membr. Sci., 2020, 603, 117996 CrossRef CAS.
- S. K. Salestan, S. F. Seyedpour, A. Rahimpour, A. A. Shamsabadi, A. Tiraferri and M. Soroush, Ind. Eng. Chem. Res., 2020, 59, 14447–14457 CrossRef CAS.
- H. Tang, S. Zhang, T. Huang, F. Cui and B. Xing, Environ. Sci.: Nano, 2020, 7, 984–995 RSC.
- V. Narayanaswamy, S. Alaabed, M. A. Al-Akhras and I. M. Obaidat, Mater. Today: Proc., 2020, 28, 1078–1083 CAS.
- R. S. DeFever, N. K. Geitner, P. Bhattacharya, F. Ding, P. C. Ke and S. Sarupria, Environ. Sci. Technol., 2015, 49, 4490–4497 CrossRef CAS PubMed.
- J. Liu, P. Li, H. Xiao, Y. Zhang, X. Shi, X. Lü and X. Chen, AIP Adv., 2015, 5, 117151 CrossRef.
- S. Chang, Q. Zhang, Y. Lu, S. Wu and W. Wang, Sep. Purif. Technol., 2020, 238, 116400 CrossRef CAS.
- M. Hezarkhani and R. Ghadari, ChemistrySelect, 2019, 4, 5968–5978 CrossRef CAS.
- A. Kommu, V. Velachi, M. N. D. S. Cordeiro and J. K. Singh, J. Phys. Chem. A, 2017, 121, 9320–9329 CrossRef CAS PubMed.
- Q. Zhao, X. Zhu and B. Chen, Chem. Eng. J., 2018, 334, 1119–1127 CrossRef CAS.
- A. Lerf, H. He, M. Forster and J. Klinowski, J. Phys. Chem. B, 1998, 102, 4477–4482 CrossRef CAS.
- B. Konkena and S. Vasudevan, J. Phys. Chem. Lett., 2012, 3, 867–872 CrossRef CAS PubMed.
- Y. Zhang, S. Zhang and T.-S. Chung, Environ. Sci. Technol., 2015, 49, 10235–10242 CrossRef CAS PubMed.
- M. J. Geerken, R. G. H. Lammertink and M. Wessling, J. Colloid Interface Sci., 2007, 312, 460–469 CrossRef CAS PubMed.
- H. Xu, F. P. Ouyang, S. L. Peng, H. Zhang and L. B. Weng, Chin. Phys. B, 2011, 20, 058504 CrossRef.
- Y. Liu, S. Huang, X. Zhao and Y. Zhang, Colloids Surf., A, 2018, 539, 1–10 CrossRef CAS.
- L. G. Bach, T. Van Tran, T. D. Nguyen, T. Van Pham and S. T. Do, Res. Chem. Intermed., 2018, 44, 1661–1687 CrossRef CAS.
- W. L. Jorgensen, D. S. Maxwell and J. Tirado-Rives, J. Am. Chem. Soc., 1996, 118, 11225–11236 CrossRef CAS.
- H. Tang, D. Liu, Y. Zhao, X. Yang, J. Lu and F. Cui, J. Phys. Chem. C, 2015, 119, 26712–26718 CrossRef CAS.
- H. Tang, Y. Zhao, X. Yang, D. Liu, S. Shan, F. Cui and B. Xing, Environ. Sci.: Nano, 2017, 4, 1935–1943 RSC.
- N. Wei, C. Lv and Z. Xu, Langmuir, 2014, 30, 3572–3578 CrossRef CAS PubMed.
- Y. Ai, Y. Liu, Y. Huo, C. Zhao, L. Sun, B. Han, X. Cao and X. Wang, Environ. Sci.: Nano, 2019, 6, 3336–3348 RSC.
- C. J. Shih, S. C. Lin, R. Sharma, M. S. Strano and D. Blankschtein, Langmuir, 2012, 28, 235–241 CrossRef CAS PubMed.
- E. Lin, X. You, R. M. Kriegel, R. D. Moffitt and R. C. Batra, Colloids Surf., A, 2017, 522, 152–160 CrossRef CAS.
- C. Wu, Mol. Simul., 2010, 36, 1164–1172 CrossRef.
- W. L. Jorgensen, J. Chandrasekhar, J. D. Madura, R. W. Impey and M. L. Klein, J. Chem. Phys., 1983, 79, 926–935 CrossRef CAS.
- L. Martínez, R. Andrade, E. G. Birgin and J. M. Martínez, J. Comput. Chem., 2009, 30, 2157–2164 CrossRef PubMed.
- J. C. Phillips, R. Braun, W. Wang, J. Gumbart, E. Tajkhorshid, E. Villa, C. Chipot, R. D. Skeel, L. Kalé and K. Schulten, J. Comput. Chem., 2005, 26, 1781–1802 CrossRef CAS PubMed.
- T. Darden, L. Perera, L. Li and L. Pedersen, Structure, 1999, 7, R55–R60 CrossRef CAS PubMed.
- S. E. Feller, Y. Zhang, R. W. Pastor and B. R. Brooks, J. Chem. Phys., 1995, 103, 4613–4621 CrossRef CAS.
- K. Steiakakis and K. Karatasos, J. Phys. Chem. C, 2020, 124, 9512–9522 CrossRef CAS.
- R. Zallen, The Physics of Amorphous Solids, Wiley, 1998 Search PubMed.
- G. Kritikos, R. Pant, S. Sengupta, K. Karatasos, A. Venkatnathan and A. V. Lyulin, J. Phys. Chem. C, 2018, 122, 22864–22875 CrossRef CAS.
- Y. Song, R. Li, F. Pan, Z. He, H. Yang, Y. Li, L. Yang, M. Wang, H. Wang and Z. Jiang, J. Mater. Chem. A, 2019, 7, 18642–18652 RSC.
- A. Amini, T. Y. Wah and H. Saboohi, J. Comput. Sci. Technol., 2014, 29, 116–141 CrossRef.
- B. Vorselaars, A. V. Lyulin, K. Karatasos and M. A. J. Michels, Phys. Rev. E: Stat., Nonlinear, Soft Matter Phys., 2007, 75, 011504 CrossRef PubMed.
- J.-P. Hansen and I. R. McDonald, Theory of Simple Liquids, Academic Press, 2006 Search PubMed.
- K. Karatasos and G. Kritikos, Soft Matter, 2018, 14, 614–627 RSC.
- T. Zhou, eXPRESS Polym. Lett., 2013, 7, 747–755 CrossRef CAS.
- G. S. Bocharov and A. V. Eletskii, Int. J. Mol. Sci., 2020, 21, 7634 CrossRef CAS PubMed.
Footnote |
| † Electronic supplementary information (ESI) available: Snapshots of the initial configurations of the systems, radial distribution functions arising from the centers of mass of the GO flakes, radial distribution functions arising from the centers of mass of MB, orientational order parameter of the GO, orientational order parameter of the MB molecules, center of mass distribution profiles of the GO molecules in a direction normal to the GO plane, charge distributions along a direction normal to the GO plane, MSD of the centers of mass of the dye molecules, comparison of the self van Hove functions describing the MBs’ motion, sulfur (MB) – hydroxyl oxygen (GO) radial distribution functions, sulfur (MB) – hydroxyl oxygen (GO) pair correlation functions. See DOI: 10.1039/d1cp02461b |
| This journal is © the Owner Societies 2021 |