 Open Access Article
Spontaneous NaCl-doped ices Ih, Ic, III, V and VI. Understanding the mechanism of ion inclusion and its dependence on the crystalline structure of ice†
M. M.
Conde
 *a,
M.
Rovere
b and
P.
Gallo
 *b
*b
aDepartamento de Ingeniería Química Industrial y Medio Ambiente, Escuela Técnica Superior de Ingenieros Industriales, Universidad Politecnica de Madrid, 28006 Madrid, Spain. E-mail: maria.mconde@upm.es
bDipartimento di Matematica e Fisica, Università Roma Tre, Via della Vasca Navale 84, 00146 Roma, Italy. E-mail: paola.gallo@uniroma3.it
First published on 17th September 2021
Abstract
Direct coexistence simulations on a microsecond time scale have been performed for different types of ice (Ih, Ic, III, V, and VI) in contact with a NaCl aqueous solution at different pressures. In line with the previous results obtained for ice Ih [Conde et al., Phys. Chem. Chem. Phys., 2017, 19, 9566–9574], our results reveal the spontaneous growth of a new ice doped phase and the formation of a brine rejection phase in all ices studied. However, both the preferential incorporation of ions into the ice lattice and the inclusion mechanisms depend on the crystalline structure of each ice. This work shows the inclusion of Cl− and Na+ ions in ice from salt using molecular dynamics simulation, in agreement with the experimental evidence found in the literature. The model used for water is TIP4P/2005. For NaCl we employ a set of potential parameters that uses unit charges for the ions.
1 Introduction
Since the discovery in recent years of icy satellites and the existence of salty oceans in the interior of this type of celestial bodies1–4 the study of the water-salt system is receiving much attention, with the special focus on the doping processes of the ice structures. These ice-doping processes are the main argument to explain the different electrical properties found in these icy bodies. Ice-doping events are not only interesting on a planetary level, there are also other processes related to climate change5–7 and desalination processes8–10 where ice doping plays an important role.The presence of a small amount of ion dopants in the solid structure of ice is already sufficient to modify its electrical properties. In particular, different experimental studies reveal how the inclusion of ions in the ice lattice modifies the dielectric properties of ice by increasing its static conductivity.11 The inclusion of ion dopants causes the appearance of Bjerrum defects.12 Depending on the type of ion, its inclusion in the solid structure can cause an increase or decrease in conductivity. Due to the enormous interest in nature for its abundance and properties, we will focus our study on the ions that come from NaCl salt. The presence of Cl− ions incorporated into the ice structure provokes the creation of Bjerrum L defects favoring an increase in conductivity.11,12
In the 1960s, Gross et al.13–15 performed numerous experimental studies explaining the role of ionic impurities found in ice on the electrical properties of ice. In 1965 Jaccard16 explained the mechanism of the electrical conductivity of ice through the creation of Bjerrum defects. Other authors continued to investigate these ice doping processes, such as Young and Salomon17 studying ice doped with HCl and later Kelly and Salomon18 evaluating the dielectric behaviour of ice doped with different NaOH concentrations. Moreover, Seidensticker and Longini19 analyzed the impurity effects on ice in presence of hydrogen fluoride and ammonia. However, it was not until the last few years that interest in these processes had reawakened. Bove and co-workers20,21 presented several studies on salty ice VII under pressure and recently Rozsa and Galli22 have reported first-principles molecular dynamics simulations of different ions (Li+, K+, Na+ and Cl−) in liquid water at extreme conditions (11 GPa, 1000 K).
Nevertheless, the details of the inclusion mechanisms of the different ions doping the ice structure have not been fully explored. In 2017, we carried out a detailed study using molecular dynamics simulations on the inclusion mechanism of a NaCl-doped ice.23 At seawater conditions, we observed the brine rejection phenomenon and the spontaneous growth of an ice slab doped by Cl− and Na+ ions. We found that Cl− ions substitutes not one but two water molecules in the lattice and that Na+ ions occupy interstitial sites.
In view of these findings and considering that when the pressure increases other stable phases of ice can appear, we proceeded here one step further in understanding doping processes and the mechanisms of ion inclusion. In the present work we study the role of pressure and the different crystalline structures of ice on doping processes for systems formed by a slab of ice and an aqueous solution of NaCl. We focus on studying ices Ic, III, V and VI. Likewise, we again analyze the doping process for ice Ih from an aqueous solution at a concentration above seawater conditions to evaluate the impact of the salt concentration in the aqueous solution on the ice doping.
The paper is structured as follows. In Section 2 we describe the methodology that we used in our simulations. In Section 3 we present the results obtained for each of the ice studied. We perform an exhaustive study for each ice analyzing different factors such as spontaneous doping, the preferential occupation of ions in the solid lattice and the inclusion mechanisms, among others. Finally, Section 4 summarizes the main conclusions obtained.
2 Methodology
In our previous work23 we studied the dynamics and evolution of the ice-doping process produced when a slab of ice Ih is in contact with an aqueous solution of NaCl at different degrees of subcooling and at temperatures above the eutectic formation temperature. We observed the spontaneous NaCl-doped ice at seawater conditions when the ice phase exposed to the interface was the common ice phase Ih.The interest in ice-doping processes extends not only to the ice phase Ih but also to other ice phases stable at high pressures that are postulated as the phases that may exist in planetary conditions, such as ice bodies with salty oceans. Thus, in this work we will study the process of doping ice for the ice Ih at higher concentrations than seawater conditions, for the metastable phase Ic at the same pressure and temperature conditions as ice Ih and for the stable ice phases at high pressures III, V and VI.
For our study, we will consider the equilibrium temperature for each ice phase obtained by simulation from the works of Conde et al.24,25 and Zaragoza et al.26 using the TIP4P/2005 water model. This model correctly describes many of the properties of water, including a qualitative description of the phase diagram. In agreement with the experimental diagram, the model predicts the ice phase Ih as the stable phase at atmospheric pressure and the Ic phase as a metastable phase under the same conditions. The ices III, V and VI occupy a region of stability within the phase diagram at increasingly higher pressures, respectively. Currently, TIP4P/2005 is considered one of the best models of potential for water in the literature. The Table 1 collects the melting temperatures of each pure ice in the region of the diagram where these phases are stable.
| Ice | Ih | Ic | III | V | VI |
|---|---|---|---|---|---|
| p (bar) | 1 | 1 | 3500 | 7000 | 12![[thin space (1/6-em)]](https://www.rsc.org/images/entities/char_2009.gif) 000 000 |
| T m (K) | 249(3) | 249(3) | 240(4) | 241(3) | 267(3) |
Regardless of the ice phase studied, we followed the same methodology to generate the initial configuration as in the previous work.23 A slab of ice is in contact with a solution of NaCl. For the ice Ih, we exposed the secondary prismatic plane (1![[2 with combining macron]](https://www.rsc.org/images/entities/char_0032_0304.gif) 10) at the interface because it is the plane with the fastest dynamics.27,28 For the rest of the ices we chose plane (100) because to our knowledge there are no studies about the growth rate. The number of molecules in the ice slab depends on the size of the unit cell of each phase and we replicate the unit cell until we obtain a solid phase around 2000 molecules. Finite size effects can be considered negligible for this system size.29 For the ices Ih, Ic and VI with full proton disordered and for the ices III and V with partial proton disordered, we used the algorithm of Buch et al.30 to generate a starting configuration that satisfies the Bernal–Fowler rules with a dipolar moment close to zero.31 The initial solid configurations were equilibrated for about 50 ns at the equilibrium pressure for each ice allowing the three different sides of the simulation box to fluctuate independently to avoid stress in the solid lattice. Once all the ices are in equilibrium, each solid phase is replicated four times in the direction x and it is completely melted to generate a fluid phase with the same box dimensions on the sides y and z, allowing its subsequent assembly. In the next step, the Cl− and Na+ ions necessary to have a NaCl solution in the fluid phase are incorporated. We choose in all cases a concentration of 1 M. The number of ion pairs varies for each system depending on the number of water molecules in the fluid phase as well as the pressure selected. Once the ions are introduced, we performed a NpxT simulation about 50 ns to equilibrate the NaCl(aq) phase. The Table 2 shows the number of initial molecules for each system at the beginning of the simulations. The last step consists of the assembly of both phases and a final short equilibration run (20 ps) to have equilibrium at the interface before starting the brine rejection simulations. All systems are formed by a slab of ice which acts as a seed crystal in contact with a liquid water phase containing Na+ and Cl− ions in solution with an initial salt concentration of 1 M.
10) at the interface because it is the plane with the fastest dynamics.27,28 For the rest of the ices we chose plane (100) because to our knowledge there are no studies about the growth rate. The number of molecules in the ice slab depends on the size of the unit cell of each phase and we replicate the unit cell until we obtain a solid phase around 2000 molecules. Finite size effects can be considered negligible for this system size.29 For the ices Ih, Ic and VI with full proton disordered and for the ices III and V with partial proton disordered, we used the algorithm of Buch et al.30 to generate a starting configuration that satisfies the Bernal–Fowler rules with a dipolar moment close to zero.31 The initial solid configurations were equilibrated for about 50 ns at the equilibrium pressure for each ice allowing the three different sides of the simulation box to fluctuate independently to avoid stress in the solid lattice. Once all the ices are in equilibrium, each solid phase is replicated four times in the direction x and it is completely melted to generate a fluid phase with the same box dimensions on the sides y and z, allowing its subsequent assembly. In the next step, the Cl− and Na+ ions necessary to have a NaCl solution in the fluid phase are incorporated. We choose in all cases a concentration of 1 M. The number of ion pairs varies for each system depending on the number of water molecules in the fluid phase as well as the pressure selected. Once the ions are introduced, we performed a NpxT simulation about 50 ns to equilibrate the NaCl(aq) phase. The Table 2 shows the number of initial molecules for each system at the beginning of the simulations. The last step consists of the assembly of both phases and a final short equilibration run (20 ps) to have equilibrium at the interface before starting the brine rejection simulations. All systems are formed by a slab of ice which acts as a seed crystal in contact with a liquid water phase containing Na+ and Cl− ions in solution with an initial salt concentration of 1 M.
| System | n ice | n solutionwater | n solutionNaCl | M | m |
|---|---|---|---|---|---|
| Ih/NaCl(aq) | 2000 | 8000 | 146 | 1.0 | 1.0 |
| Ic/NaCl(aq) | 2016 | 8064 | 147 | 1.0 | 1.0 |
| III/NaCl(aq) | 2592 | 10![[thin space (1/6-em)]](https://www.rsc.org/images/entities/char_2009.gif) 368 368 |
171 | 1.0 | 0.9 |
| V/NaCl(aq) | 2100 | 8400 | 130 | 1.0 | 0.9 |
| VI/NaCl(aq) | 2160 | 8640 | 126 | 1.0 | 0.8 |
The main difference of each system, in addition to the number of water molecules and ions that form it, it is the shape of the simulation box. The geometry of the simulation box is determined by the crystalline structure of the ice. Thus, for ice Ih the simulation box is orthorhombic (note that for ice Ih with hexagonal symmetry it is possible to use an orthorhombic cell11). For the other ices, we use a simulation box with geometry cubic for ice Ic, tetragonal for ice III, monoclinic for ice V and for ice VI a box of tetragonal symmetry. The NaCl aqueous solution adapts to the shape of the box for each ice.
We use samples with a very large size to reduce significantly the stochastic nature of the direct coexistence simulations.29 In addition, a large fluid phase size (more than 8000 molecules for all systems) gives us the possibility, in the case of spontaneous doping, to obtain a greater number of ions in the solid lattice and thus a better statistics of the results. The idea is to put a small solid seed and grow it as much as possible. In Fig. 1 all the initial configurations used in this work for the different systems studied are shown.
Recently, we observed for the ice Ih phase that the concentration of dopants in ice increased as the degree of subcooling is higher.23 Moreover, we observed that at temperatures close to the melting point of the ice, the Na+ ions did not incorporate into the crystalline lattice of the ice and remained in the solution. It was necessary to lower the temperature to observe the inclusion of Na+ ions in the solid lattice. For Cl− ions, even at temperatures close to the melting point, the ice doped by this ion was observed. Following these results, in the present work we choose the system temperature of 20 K below the melting point because that was the temperature that gave us a number of ion inclusions similar to the experimental values in our previous study of ice Ih and for this study we kept the same temperature also for the other ices. According to the water–NaCl phase diagram, the range of temperatures where it is possible to study the equilibrium between ice and solution must be below the melting point of ice and above the eutectic point. The pressure chosen for each system was the pressure at which Conde and co-workers determined the melting point of each pure ice by direct coexistence.24–26Table 3 shows the initial conditions of pressure and temperature for each system studied. The degree of subcooling chosen in all cases was ΔT = −20 K, where ΔT is the difference between the temperature of the system and the melting temperature of each ice.
| System | p (bar) | T (K) | ΔT (K) |
|---|---|---|---|
| Ih/NaCl(aq) | 1 | 229 | −20 |
| Ic/NaCl(aq) | 1 | 229 | −20 |
| III/NaCl(aq) | 3500 | 220 | −20 |
| V/NaCl(aq) | 7000 | 221 | −20 |
| VI/NaCl(aq) | 12![[thin space (1/6-em)]](https://www.rsc.org/images/entities/char_2009.gif) 000 000 |
247 | −20 |
For all direct coexistence simulations of the present work, we employ the NpxT ensemble.29,32 In this ensemble, the pressure is applied in the direction perpendicular to the interface (for all systems studied corresponds to the x-axis). To perform all simulations, we use the molecular dynamics package GROMACS (version 4.5.5).33 Periodic boundary conditions were employed in the three directions of space. Nosé–Hoover thermostat34,35 with a relaxation time of 2 ps was used to fix the temperature. Parrinello–Rahman barostat36 was used to keep the pressure constant with a relaxation time of 2 ps. The time-step used in the direct coexistence simulations was 2 fs. The length of each direct coexistence simulation was on the microsecond scale depending on the type of system, going from 3 microseconds for ices Ih and Ic to 5 microseconds for ices III, V and VI.
As it was previously mentioned, we used the well-known rigid and nonpolarizable TIP4P/2005 potential37 to describe the interactions of water molecules in our systems ice/NaCl(aq). In line with our previous work23 and in order to be able to compare the results on spontaneous doping and quantity of doping ions, we used the parameters proposed by Vega and co-workers38 for the ion–water and ion–ion interactions, which reproduce the solubility of NaCl in water in very good agreement with the experimental one. The potential parameters of TIP4P/2005 water and NaCl models are given in Table 4. There are other more recent potential models with scaled charges in the literature,39,40 we use this potential with unit charges for the ions to compare with our previous results. The geometry of the water molecules was enforced using constraints. The real part of the Coulombic potential and the Lennard-Jones part of the potential were truncated both at 8.5 Å. Ewald sums were used to deal with electrostatics interactions.41 The width of the mesh was 1 Å and we used a fourth-order polynomial.
| Site | C 6 | C 12 | q |
|---|---|---|---|
| O | 0.30798 × 10⁻² | 0.30601 × 10⁻⁵ | — |
| H | — | — | +0.5564 |
| M | — | — | −1.1128 |
| Na+ | — | 0.83200 × 10⁻⁷ | +1 |
| Cl− | — | 0.52000 × 10⁻⁴ | −1 |
| Na+–O | 0.08000 × 10⁻² | 2.09430 × 10⁻⁷ | — |
| Cl−–O | 0.15000 × 10⁻² | 1.64480 × 10⁻⁵ | — |
3 Results
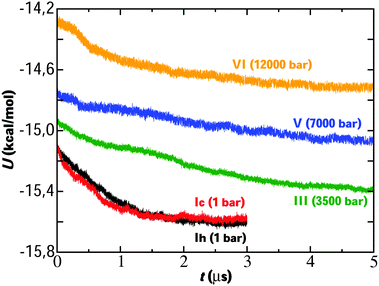
We start analyzing the results of the simulations performed by direct coexistence for the five systems studied containing ice Ih, Ic, III, V and VI as solid phase at ΔT = −20 K and the pressure selected in each system. The evolution of the potential energy as a function of time for each system along the simulation is shown in Fig. 2. For all systems studied at the same degree of subcooling, we observe a decrease in the potential energy indicating the growth of an ice slab. In all cases, long time simulations on a microsecond scale were necessary to carry out the growth of the solid phase.The evolution of potential energy allows us to understand the growth velocity of the ice phase. Thus, in view of the results, we observe how the growth rate is different depending on each ice. For example, for the ice Ih and Ic we see how the energy decreases until reaching a final plateau indicating that the system has reached the state of equilibrium. Initially, a very fast decrease in potential energy is observed for these ices until gradually reaching the plateau. Considering our previous work,23 if we compare the evolution of the energy for the system of ice Ih starting from two different initial concentrations for the NaCl solution (0.599 M in the previous work and 1 M in this work) it is observed that the growth rate is similar. Analogously, ice VI first presents a rapid fall and then its evolution is slow until it reaches the plateau. For ices III and V the fall in potential energy occurs more slowly and after simulating 5 microseconds, the final state of equilibrium is not reached. However, the portion of ice grown is sufficient for our study about ice-doping.
These results follow the trend of the growth rates obtained by Conde et al.24 for simulations of direct coexistence of pure ices in the absence of salt. Conde et al.24 revealed how the growth rates of ice III and V are slightly higher than those of ice Ih. A possible explanation for these differences in growth rates is due to the fact that ices III, V and VI present a much more complex structure than ice Ih. In the ice Ih all the water molecules are connected in a tetrahedral lattice and all the molecules are topologically equivalent. This is not the case for ices with more complex structures where not all molecules are topologically equivalent.11 The growth of ice from pure liquid water is much faster than from a NaCl solution and this leds an increase of the simulation time by an order of magnitude. For the pure water system, a noticeable growth of the ice phase could be observed in around 20 ns even for more complex ice phases such as ice III or ice V.24 Instead, from a NaCl solution, the simulation time necessary to observe that same ice growth rises to the scale of microseconds, so almost two orders of magnitude longer.
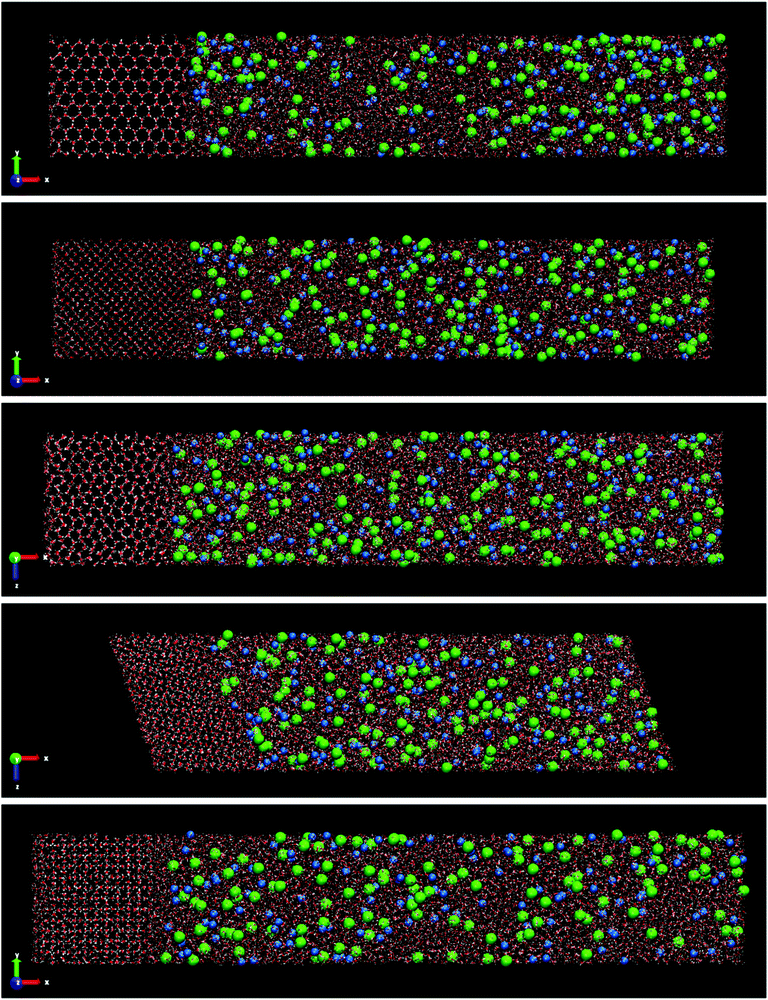
Fig. 3 shows the final snapshots for the systems studied. Each instantaneous configuration was taken at 3 microseconds for the systems formed by ice Ih and Ic, and 5 microseconds for the systems formed by ices III, V and VI. This time difference is due to the different growth rate mentioned above. As it can be seen in Fig. 3, the shape of the simulation box for the ice-solution systems is different depending on the symmetry of each ice. For ice Ih and Ic a frontal view of the XY plane is shown. For ice III and V the XZ projection is the front view. The different choice in the projection of the plane only addresses visualization issues about the type of simulation box shown, as in the case of the monoclinic box of the ice V, or a clearer visualization of the crystalline structures as the pentagonal rings of the ice III. These final snapshots show not only the growth of ice, as confirmed by the evolution of the potential energy, but also the spontaneous doping of Cl− and Na+ ions produced in all the ice phases studied besides the brine rejections.
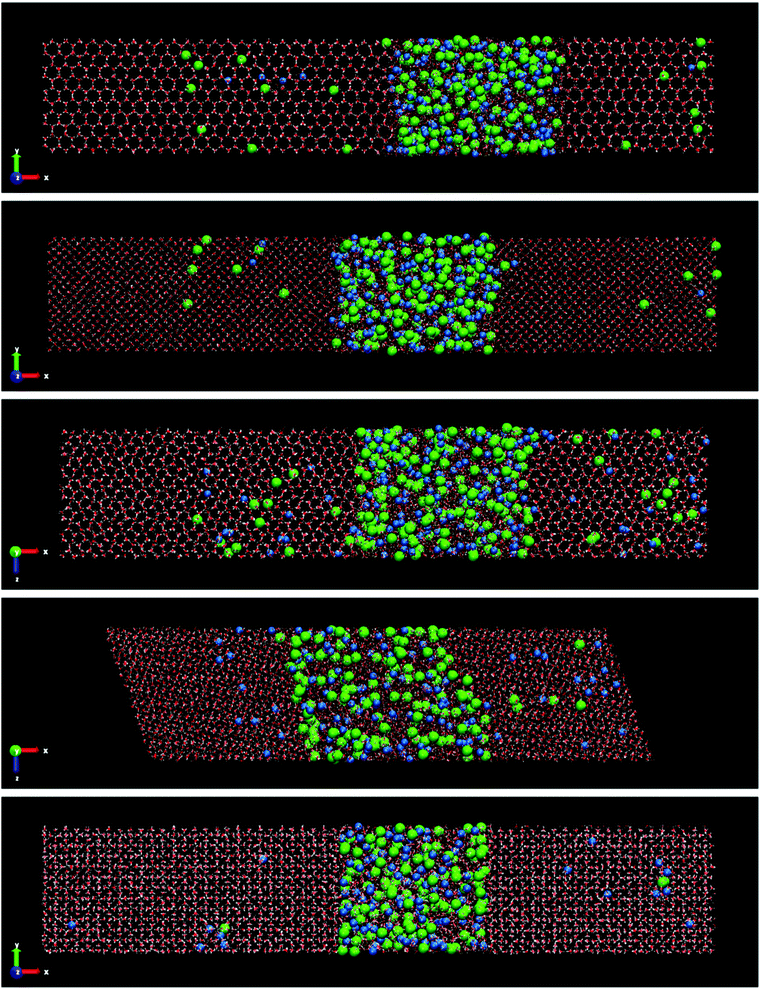 | ||
| Fig. 3 Snapshots of the final configurations obtained by direct coexistence simulations for the systems formed by a slab of ice and a NaCl aqueous solution at the temperature studied (ΔT = −20 K) and at different pressures depending on the ice phase (see Table 3). In order from top to bottom: ice Ih, Ic, III, V and VI. The time at which these instantaneous configurations were taken is 3 μs for the ices Ih and Ic, and 5 μs for the systems formed by ice III, V and VI. Water molecules are plotted in red and white color, Cl− ions are plotted as green spheres and Na+ ions as blue spheres. The size of the ions is enlarged with respect to the water molecules for a clearer visualization. | ||
In the ESI† of this work, the trajectory movies of each system are included. In these movies, the growth of ice and spontaneous doping of ions in the solid lattice are clearly observed. Already from a visual inspection we can see that the spontaneous doping of Na+ and Cl− ions, previously observed for direct coexistence molecular dynamics simulations of ice Ih, is obtained for all the ices investigated, not withstanding the more complex structures that they have. In fact, while in a previous work24 there was evidence that it was possible to grow pure ice by direct coexistence of complex ice phases such as ices III, V and VI, spontaneous doping is much more complex and here we show it for the first time in a study by molecular dynamics simulations. Similarly to what we observed for ice Ih at seawater conditions,23 the portion of doped ice for all systems corresponds to the new ice-grown phase, while the initial solid seed is pure ice. Notice that for the configuration of the Fig. 3 of the system formed by ice VI there are no ions incorporated in the initial ice slab. The Na+ ion observed in the Fig. 3 (bottom) to the left of the final configuration of ice VI corresponds to the new grown ice slab because the box has shifted. Likewise, a repetition pattern has not been found in the distribution of the ions along the solid lattice. The ions appear randomly located in the new slab of doped ice. We observed the doped ices during all the duration of the simulations, and they all look perfectly stable. The Cl− ions remain always in the same position while Na+ ions move a bit locally both when they are interstitial and when they are substitutional and it can be seen in the movies. The ice around the ions is unaltered.
For ice Ih the number of Cl− ions that are incorporated into ice is greater than Na+ ions. This preferential doping is in agreement with the results obtained previously for a system with different starting concentrations23 and in agreement with that reported in experimental studies.42–44 This result indicates that the preferential incorporation is independent of the starting concentration, for different initial solution concentrations (0.599 M in the previous work and 1 M in the present work) the preference is the same, the number of Cl− ions that is incorporated into the solid lattice is considerably greater than the number of Na+ ions for the same degree of subcooling (ΔT = −20 K). In our previous work for ice Ih we demonstrated how it was necessary to increase the degree of subcooling (above −15 K) to observe the doping of Na+ ions and a subcooling of −20 K allowed us to obtain concentrations of ionic species (Cl− and Na+) in the ice lattice similar to the experimental values. For this reason, we chose the same degree of subcooling in the present paper.
Ice Ic presents similar results to ice Ih in terms of number of doping ions and preferential incorporation. In both ices, at the same pressure and degree of subcooling, the number of Cl− ions incorporated in the solid lattice is considerably greater than the number of Na+ ions. In Table 5 the number of dopant ions present in each of the phases is given. For ice III the situation begins to change, there is a similar amount of Cl− and Na+ ions into the solid lattice, revealing that for this ice there is no preference for incorporation of either of the two ions. The number of Cl− dopants is similar to the number of Na+ dopants as shown in Fig. 3 and in the Table 5. Surprisingly, for ices V and VI the situation is completely opposite to what one would expect after the study of ice Ih. Now, the ion that is preferentially incorporated into the ice lattice is Na+. As can be seen in the Table 5, the number of Cl− ions that are incorporated into the portions of ice V and VI is very small. We have seen therefore that for the ices stable at increasing pressures, the preference for the incorporation of ions gradually changes from Cl− to Na+, and then the system points to an almost complete exclusion of both species upon further increasing the pressure as for ice VI both concentrations decrease with respect to ice V. This difference in the preferential incorporation of dopants is an essential finding that could explain different properties and pave the way to new applications for these ice phases.44,45
In addition to the growth and doping of the ice phase, the appearance of a brine phase rejected is observed in Fig. 3 for all the systems studied. The volume of the brine phase depends on the growth rate of ice. Thus, in the case of ice Ih, Ic and VI the volume occupied by the brine phase is smaller than in the other systems studied since for ice III and V the final equilibrium state has not been reached. In Table 5 the number of water molecules that form the jet brine phase are also collected.
The concentration of dopants in the portion of ice grown for each system is shown in the Table 6. As reflected in the results, the concentration of dopants is different for each ice. The ices Ih and Ic have a greater concentration of Cl− ions in the new ice slab and, consequently, a greater concentration of Na+ ions in the brine phase. Ice III has very similar concentrations for both the Cl− and Na+ ions. On the contrary, for the ice V and VI the concentration of Na+ ions is considerably higher in the ice phase. The concentration of the dopants in the portion of ice, although it is small, cannot be considered negligible and the incorporation of these ions in the solid lattice can modify electrical properties such as static conductivity.11
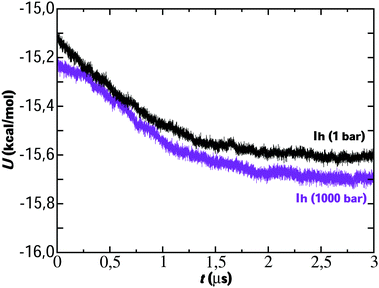
In view of the results, a question arises: is the preferential incorporation (and therefore the concentration of dopants) due to the type of crystalline structure of the ice or to the pressure applied? Our results show that for systems containing ice Ih and Ic and pressure 1 bar, the Cl− ion has preference in the ice-doping process. For ice III we simulate the system at 3500 bar and both dopants are incorporated into the lattice in a similar proportion. For ice V and VI, at pressures of 7000 bar and 12![[thin space (1/6-em)]](https://www.rsc.org/images/entities/char_2009.gif) 000 bar respectively, it is the Na+ ion that is preferentially incorporated into the slab of doped ice. To solve this issue, we have prepared a similar system to that of ice Ih in contact with a solution of 1 M and we have simulated it at a pressure of 1000 bar for 1.5 microseconds. In Fig. 4 a final snapshot of this system is given and it can be seen as even increasing the pressure the Cl− is preferentially incorporated into the ice lattice. Thus, the explanation of the preferential incorporation is due to the type of crystalline structure and its availability to accommodate ions in its network. This explanation makes sense since, if the determining factor were the pressure, the ice VI should present a greater concentration of dopants, on the contrary, it is the ice V which has a greater concentration revealing a greater availability to accommodate ions. Fig. 5 shows the comparison of the potential energy as a function of time for the same system (a slab of ice Ih in contact with a solution) at the two different pressures studied and at the same degree of subcooling. Both curves have a very similar slope, showing that the ice growth and the growth rate are similar for the same ice regardless of the applied pressure. In view of the results, we can conclude that the different preferential inclusion is due exclusively to the different crystalline structures and not to the pressure applied along the interface.
000 bar respectively, it is the Na+ ion that is preferentially incorporated into the slab of doped ice. To solve this issue, we have prepared a similar system to that of ice Ih in contact with a solution of 1 M and we have simulated it at a pressure of 1000 bar for 1.5 microseconds. In Fig. 4 a final snapshot of this system is given and it can be seen as even increasing the pressure the Cl− is preferentially incorporated into the ice lattice. Thus, the explanation of the preferential incorporation is due to the type of crystalline structure and its availability to accommodate ions in its network. This explanation makes sense since, if the determining factor were the pressure, the ice VI should present a greater concentration of dopants, on the contrary, it is the ice V which has a greater concentration revealing a greater availability to accommodate ions. Fig. 5 shows the comparison of the potential energy as a function of time for the same system (a slab of ice Ih in contact with a solution) at the two different pressures studied and at the same degree of subcooling. Both curves have a very similar slope, showing that the ice growth and the growth rate are similar for the same ice regardless of the applied pressure. In view of the results, we can conclude that the different preferential inclusion is due exclusively to the different crystalline structures and not to the pressure applied along the interface.
Once we have verified that it is possible to dope all the ice phases studied in this work, we are now going to analyze in detail the mechanism of inclusion of the two ionic species for each of the systems studied. For clarity and understanding, we select for each type of ice a small portion of the water molecules in the pure ice lattice to know exactly how these molecules are arranged and oriented and compare it with similar portions where there are Cl− and Na+ ions doping the network. These doped portions are taken from the final configurations and obtained in the slabs of new grown ices. For the study of pure ice we take small portions of the ice seed that we put initially and that is equilibrated at the conditions of pressure and temperature of the doped part. We note that our equilibrated configurations do not show the water molecules sitting at the sites of the perfect lattice. Because of finite temperature, the lattice sustains in fact thermal modes of vibration and these cause small misplacements of the molecules in the instantaneous configurations of the systems with respect to the equilibrium positions. In the following discussion, network defects included in the pure ice portion have not been considered. Only the possible defects that the ions can cause by doping the network are considered.
We now show, for each ice, the same portion selected for the pure ice, for the ice in the presence of a Cl− ion and for the ice in presence of a Na+ ion.
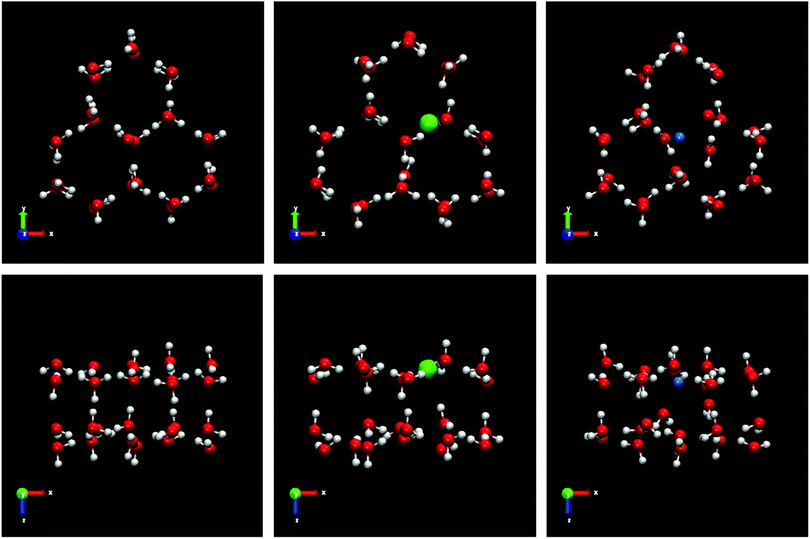
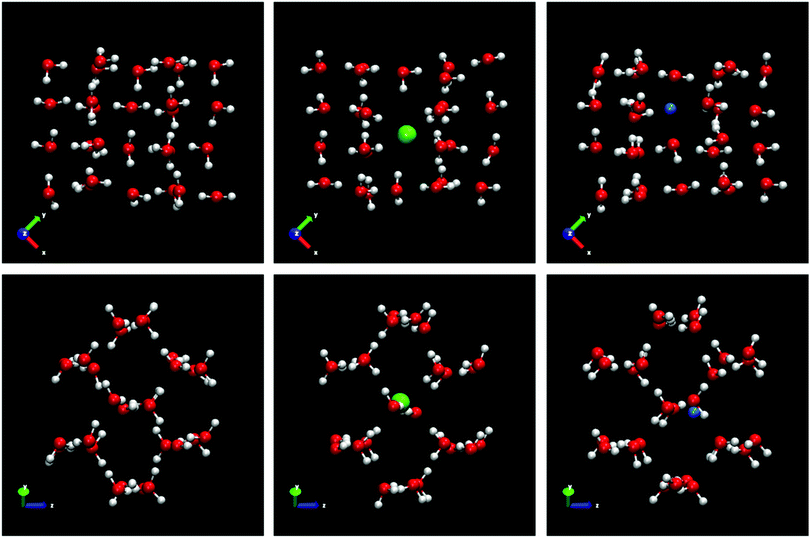
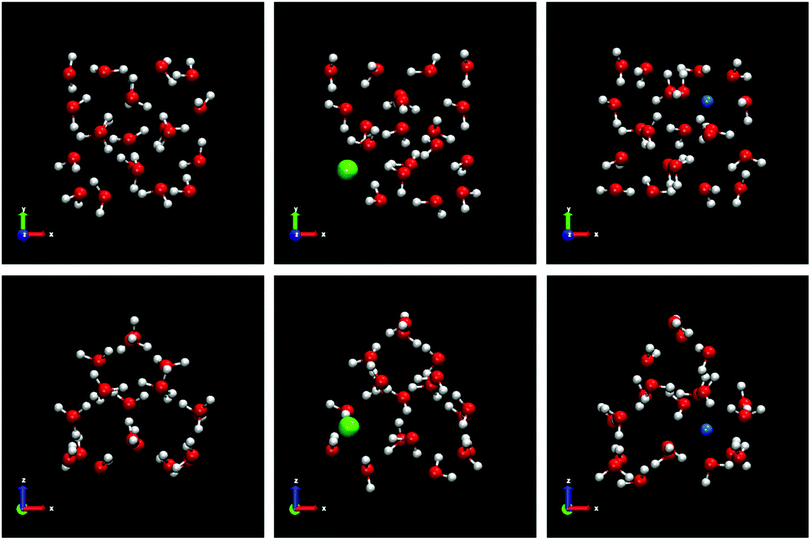
The crystal structure of pure ice Ih is displayed in the left panels of Fig. 6 and it shows a particular arrangement of the molecules characterized by the presence of large hexagonal channels. The basic structure consists of chair-form hexagonal rings (horizontal plane) or boat-form hexagonal rings (vertical plane). The portion of pure ice selected for our study is composed of 26 water molecules located in two layers of three hexagonal rings each. A front view of the projection of the xy plane where the hexagonal channels are clearly observed is shown in Fig. 6 (top left panel). Likewise, we use the xz-plane projection to help visualize the ion inclusion mechanisms (bottom left panel). We continue by analyzing what happens to the phase of ice Ih when it is doped by Cl− ions. Already in our previous work23 on seawater conditions, we found that Cl− ions included in the lattice always substitute not one but two water molecules. In the Fig. 6 it is clearly observed how, in both planes, the portion of ice that contains the Cl− ion presents 24 water molecules, revealing the loss of 2 water molecules replaced by a Cl− ion with respect to the portion of pure ice. We note also that the lattice is not distorted. This result is in perfect agreement with the results found in the previous study. The loss of water molecules in the lattice also causes the creation of a L-type Bjerrum defect. This type of defect, specific to ice and responsible for the electrical properties of ice,11,12 basically consists of the creation of a hydrogen bond in the absence of protons. This is the situation that occurs in the vicinity of each Cl− ion presents in the solid network where a hydrogen bond is created between the Cl− ion and the oxygen of a neighboring water molecule. The presence of these substitutional defects in ice favors conduction. The inclusion mechanism in the case of Na+ ion occurs via interstitial sites instead, as it is evident from the right panels of Fig. 6. We can see how the Na+ ion occupies an interstitial site. The presence of Na+ ions in the solid lattice does not generate the creation of defects although its presence causes a quite relevant local distortion of the ice lattice as can be clearly seen in both planes by the displacement of water molecules when incorporating the Na+ ion.
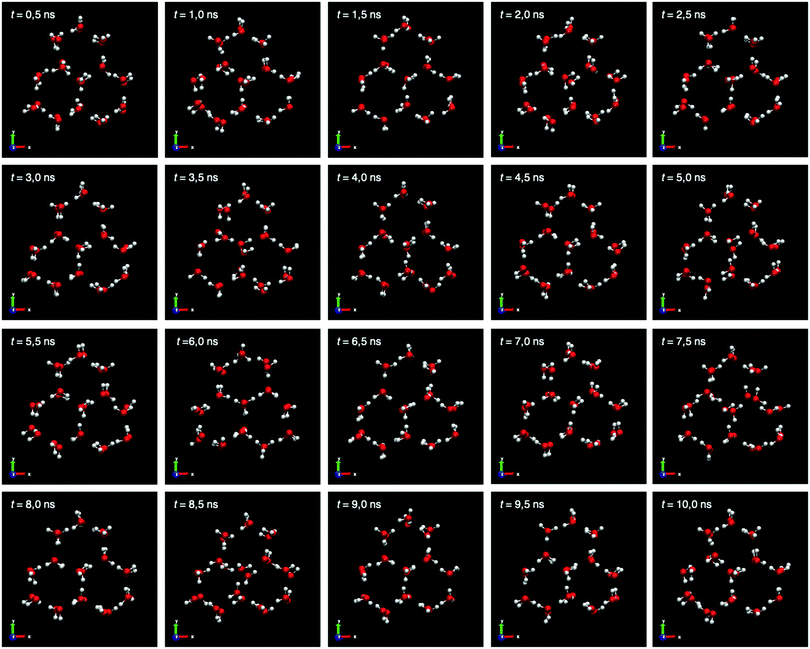
To confirm this local distortion of Na+ ions, we show a study on the positions of the water molecules in the solid network around their equilibrium positions for 10 ns. The instantaneous configurations for the portion of pure ice Ih are collected in Fig. 7. We take every 0.5 ns instantaneous configurations of the portion of pure ice and observe that although small displacements of the water molecules are shown, these are due to movements around the equilibrium position and no local distortion is observed as in the case of the Na+ dopants.
The inclusion of a Cl− or Na+ ion in the ice lattice affects the orientation of the hydrogens in nearby water molecules as a function of the charge on the ion. In the presence of the Cl− ion, the nearby water molecules are oriented towards the negatively charged ion. On the contrary, the hydrogens move away from the positive charge of the Na+ ion. These different hydrogen orientations of the water molecules depending on the type of ion accommodated in the ice lattice can be observed in the projections of the xy plane of Fig. 6.
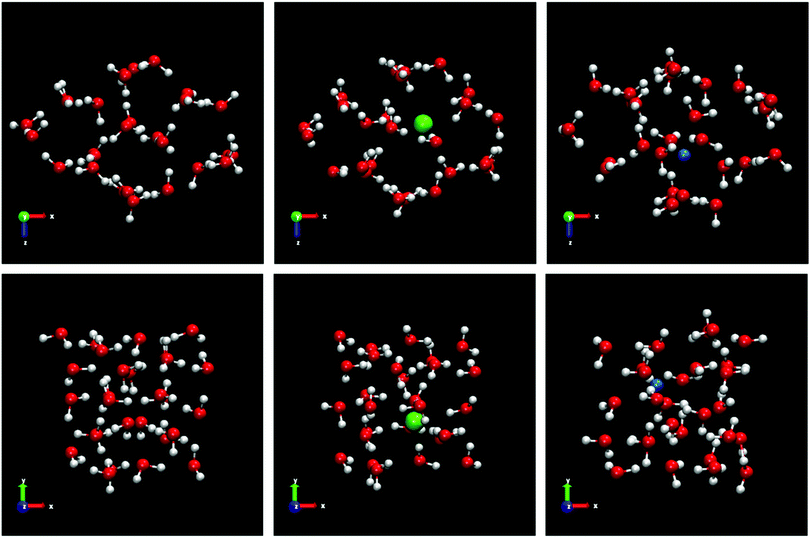
Ice Ic is the metastable phase of ice Ih. It is a proton disordered phase. In recent years, this cubic polymorph (ice Ic) has been interpreted not as a pure ice phase but as a structure with mixed cubic/hexagonal stacking.46,47 However, in 2020, it has been found that pure cubic ice could be produced from ice XVII without stacking defects.48 Ice Ih and Ic are crystalline structures very alike. Both forms have a very similar density and are open low-density structures. Moreover, both forms contain similar layers of hexagonal rings, but differ in the way these layers are connected. Ices Ih and Ic present an ABABAB and an ABCABC stacking sequence of planes, respectively. Fig. 8 shows the visualization of the inclusion mechanism for ice Ic. Two different projections in the plane have been used to improve the visualization and understanding of the inclusion mechanism. Pure ice Ic portion is composed of 28 water molecules. In the second column of the Fig. 8 a similar portion of ice Ic is shown with a Cl− ion doping the lattice. It is clearly observed in both projections as Cl− ion replaces two water molecules. This result is in agreement with the same mechanism found for doped ice Ih. The portion of ice Ic doped by Cl− ion contains 26 water molecules and 1 Cl− ion. Since both structures are very similar, this result does not seem surprising. However, when the Na+ ion dopes the ice lattice, the mechanism of inclusion changes with respect to that found for ice Ih. As can be seen in the Fig. 8 (right column), the Na+ ion replaces a water molecule resulting in the loss of a water molecule with respect to the portion of pure ice Ic. Contrary to ice Ih, in the ice Ic the mechanism of inclusion for the Na+ ions is a substitutional mechanism.
This difference in the mechanism can be explained through the arrangement of the water molecules in the lattice of ice Ih and ice Ic, especially in the differences in the numbers of water molecules in the hydration shells of both ices. Specifically, in ice Ih cavities are formed by twelve molecules while in ice Ic cavities are smaller and are formed by ten molecules.49 As ice Ic has smaller cavities, it means that the Na+ ion does not have space to be located in the interstitials and the substitution by a water molecule is the most favorable mechanism for its inclusion into the lattice. Moreover, while for ice Ih hexagonal rings can have both a chair conformation and a boat conformation, for ice Ic 6-membered rings can adopt only chair conformation. As a consequence of the chair conformation in ice Ic there are no open channels in the direction 111, while in ice Ih they exist as indicated in ref. 11.
Ice III is a complex and high-density phase.50 It is located in the intermediate pressure zone of the water phase diagram. It is a partial proton disordered phase. All water molecules are hydrogen bonded to four others, two as donor and two as acceptor. Ice III forms tetragonal crystals. Ice III presents a complicated arrangement of five-membered rings of hydrogen bonded molecules with several different bond lengths and angles. As in the previous cases, we use a portion of pure ice to compare the positions of the water molecules when the ions are incorporated into the lattice and thus study the mechanism of inclusion. For ice III, the pure ice portion selected is made up of 28 water molecules. The five-membered rings of ice III are clearly visible in the frontal view of the xy plane projection of the Fig. 9. When the ice portion is doped by a Cl− ion there is a water molecule missing. It is the only one of the ices studied in this work where the Cl− ion replaces one water molecule and not two water molecules. All the Cl− ions found for this ice III (see Table 5) follow the same mechanism of substitution of a single water molecule. A possible explanation of these differences is due to the arrangement of water molecules in ice and how their different connectivity favors the substitution of one or two water molecules by Cl− ion. In the case of ice III with 5-membered water molecule rings, and in view of the results obtained, the substitution mechanism of a water molecule is more energetically favorable than the substitution of two water molecules. On the contrary, Na+ ion occupies an interstitial site and its presence causes a local distortion of the ice lattice similar to the distortion observed in ice Ih by the presence of Na+ ions. In this portion of ice III doped by the Na+ ion, the same number of 28 water molecules is maintained as in the portion of pure ice.
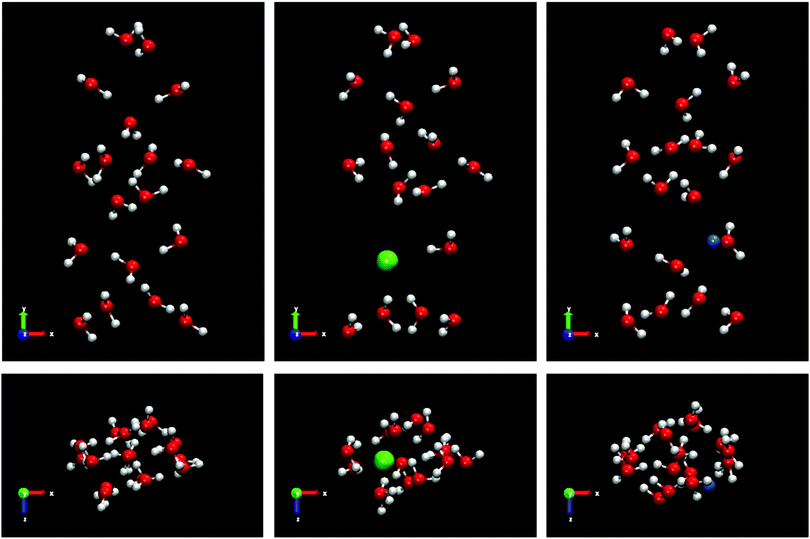
Ice V is a very complex structure with a monoclinic unit cell.51 It is a partially proton disordered phase. Ice V has several types of topologically non-equivalent water molecules. It contains four-, five-, six- and eight-membered rings of water molecules. All molecules form one connected lattice. For the portion of pure ice V we select 18 water molecules. Fig. 10 shows the frontal views of the xy and xz planes for the portions of pure ice V and for the portions of Cl−- and Na+-doped ice. From the portion of ice V doped by Cl−-ion it is clearly observed how the inclusion of an ion in the lattice causes the substitution of two water molecules. The number of molecules in the portion of doped ice by Cl−-ion is 16 water molecules and 1 Cl−-ion. Again, we observe a mechanism of substitution of two water molecules in a solid structure of water. This mechanism was observed in all Cl−-ions that doped the ice phase V studied in this work. Analogously to ice Ih and III, Na+ ions are located in the interstitial sites resulting in a portion formed by 18 water molecules and 1 Na+ ion. The Na+ ion does not appear to cause a local distortion as in the case of ice Ih and III. All portions of ice V (pure and doped) can be seen in Fig. 10.
Ice VI is a full proton disordered phase with tetragonal symmetry.52 Compared to ice III and ice V, ice VI occupies a large area on the water phase diagram in the high pressure region. Ice VI contains four-member rings of water molecules. The tetragonal unit cell of ice VI is formed by two independent but interpenetrating hydrogen bonded networks. These are two completely separated interpenetrating networks with no connecting hydrogen bond. Besides, in ice VI, not all molecules are topologically equivalent while all the molecules are topologically equivalent in ice Ih. In each sub-lattice, the structure of ice VI is made up of chains of water molecules linked by hydrogen bonding. The portions of ice VI used to elucidate the mechanism of inclusion of Cl− and Na+ ions are shown in the Fig. 11. For the portions of ice VI, in the frontal view of the projection of the xy plane, it can be clearly seen the 4-membered ring of water molecules from one of the sub-lattices surrounded by water molecules belonging to the other sub-lattice. In the xz projection the chains of water molecules linked by hydrogen bonds are observed. The portion of pure ice VI selected is composed of 21 water molecules. As can be seen in the central panel of the Fig. 11, when a Cl− ion dopes the structure of ice VI, the portion becomes formed by 19 water molecules resulting in the loss of 2 water molecules. As in previous cases for most of the ices studied except for ice III, the mechanism of inclusion of Cl− ion is through the substitution of two water molecules. As it expected, the substitution of molecules occurs in one of the sub-lattice that form the structure of ice VI. It is not possible to find a Cl− ion that connects both sub-lattices, the two missing molecules belong to the same sub-lattice, either one or the other. The presence of the Cl− ion provokes that the hydrogens of the nearby water molecules are oriented toward the ion. For the inclusion of Na+ ions, the mechanism is similar to that found for most ices. Na+ ions are incorporated into the solid structure through the interstitial sites causing a slight distortion of the water molecules neighboring the Na+ ion. In the right panel of the Fig. 11, it can be seen how, due to the presence of the Na+ ion in the ice VI, the hydrogens of the water molecules close to the Na+ ion are oriented away from the positive charge of the ion. This phenomenon about the different hydrogen orientations due to the presence of Cl− or Na+ ions in the vicinity are found in all ices studied.
Finally, it is important to note that for all the systems studied, dopant ions are obviously located only in the new slab of grown ice and not in the initial ice used as seed crystal. Since for all the ices the Cl− ions that doped the solid lattice substitute water molecules it is clear that they will remain in their positions in the lattice and will not be exchanged or diffused. As for Na+ ions located in the interstitial sites, in our previous work we observed small displacements of the Na+ through the lattice. But since the population of Na+ ions was very small we could not study this matter in detail. We assume that over time these Na+ ions will diffuse through the lattice. However our statistics did not allow us to inquiry on the problem of diffusion. In Table 7 a summary of the inclusion mechanisms of each one of the ices studied in this work is shown.
| Ice | Ion: inclusion mechanism | H2O subs. |
|---|---|---|
| Ih | Cl−: substitutional | 2 |
| Na+: interstitial | — | |
| Ic | Cl−: substitutional | 2 |
| Na+: substitutional | 1 | |
| III | Cl−: substitutional | 1 |
| Na+: interstitial | — | |
| V | Cl−: substitutional | 2 |
| Na+: interstitial | — | |
| VI | Cl−: substitutional | 2 |
| Na+: interstitial | — |
4 Conclusions
In this work we have studied the spontaneous NaCl-doped for different types of ice. We have performed computer simulations using the direct coexistence technique to analyze the mechanisms of ion inclusion. Additionally, our results show the growth of a new ice-doped phase from NaCl aqueous solution in contact with a solid phase of the different types of ice studied (ice Ih, Ic, III, V and VI). The model used for water is TIP4P/2005.37 For NaCl we have considered a set of potential parameters that use unit charges for the ions.38 The main conclusions of this work are as follows:• For the first time by molecular dynamic simulations, the spontaneous doping by Cl− and Na+ ions of all the ices studied is observed. This finding is very significant to explain the behavior of ice in the presence of ionic species as it occurs in planetary conditions.
• Long time simulations on a microsecond time scale are required to produce a slab of doped ice large enough to have a significant number of Cl− and Na+ ions doping the newly grown ice.
• In line with the previous results obtained for ice Ih, we also observed the formation of a brine rejection phase in all the ices studied. The growth rate of the ice phase from aqueous solutions is different depending on each ice and slower than the pure phase, following the trend of the growth rates of the pure ices in the absence of salt. The potential energy curves reveal that the time to reach the final state of equilibrium for the systems formed by ice Ih and Ic are considerably shorter than in the rest of the ices where the final state of equilibrium was not reached after 5 microseconds.
• The preferential incorporation of dopants depends exclusively on the crystal ice phase. The pressure applied to the system and the initial salt concentration do not appear to influence the preferential incorporation found for each type of ice.
• It is not possible to speak of a universal inclusion mechanism for the ices doped. Most of the ices studied present a different inclusion mechanism that depends on their crystalline structures.
• For all the ice networks studied, the inclusion of Cl− ions follows a mechanism of substitution of water molecules causing the appearance of L defects. The number of substituted water molecules depends on the type of ice studied. For most of the ices studied, each Cl− ion incorporated in the network replaces two water molecules. Only for the system formed by ice III the inclusion of Cl− ions produces the substitution of a single water molecule. This difference can be explained in terms of the arrangement of the water molecules in the ice crystal lattice. For all the systems studied, we did not observe the distortion of the network due to the incorporation of Cl− ions.
• In general, Na+ ions follow an inclusion mechanism through interstitial sites. Ice Ic is an exception for the mechanism of Na+ ions, in this case, a mechanism of substitution of a single water molecule is found. The presence of Na+ ions in the solid lattice does not provoke the creation of network defects, although its presence causes a quite relevant local distortion of the ice lattice except for ice Ic where it goes substitutional. The hydrogens of the water molecules close to the Na+ ion localized at the interstitial sites are oriented away from the positive charge of the ion. On the contrary, hydrogens are oriented towards the negative charge of Cl− in the vicinity of the ion.
In view of the results obtained, it would be interesting to extend this analysis to other types of dopants to study the effect of different dopants on the inclusion mechanisms and the preferential occupation of the ions in the solid ice network. The temperature of our study can be of relevance for the study of Jovian Satellites that is in progress.3 When salty solutions become highly concentrated, and their dynamics is slow and glassy, ice does not grow any longer. It would be of interest to see if we can supercool below the eutectic and still have a glassy brine rejection. Finally, in our previous paper23 we analyzed the Radial Distribution (RDF) of pure ice and doped ice and we found no perturbation in the doped lattice, at least in the RDF, with respect to the perfect lattice. Nonetheless the number of ions is very low so that we have a low statistic in the RDF. Thus, in the future we intend to study the local order in the vicinity of the few ions incorporated into the ice to investigate possible local deformations of the lattice.
Author contributions
All authors contributed equally to all the roles.Conflicts of interest
There are no conflicts to declare.Acknowledgements
This work was funded by Grant No. PID2019-105898GA-C22 of the MICINN and by Project No. ETSII-UPM20-PU01 from “Ayudas Primeros Proyectos de la ETSII-UPM”. M. M. C. acknowledges CAM and UPM for financial support of this work through the CavItieS project no. APOYO-JOVENES-01HQ1S-129-B5E4MM from “Accion financiada por la Comunidad de Madrid en el marco del Convenio Plurianual con la Universidad Politecnica de Madrid en la linea de actuacion estimulo a la investigacion de jovenes doctores”. The authors gratefully acknowledge the Universidad Politecnica de Madrid (http://www.upm.es) for providing computing resources on Magerit Supercomputer.Notes and references
- M. R. Frank, C. E. Runge, H. P. Scott, S. J. Maglio, J. Olson, V. B. Prakapenka and G. Shen, Phys. Earth Planet. Inter., 2006, 155, 152 CrossRef CAS.
- B. Journaux, I. Daniel, R. Caracas, G. Montagnac and H. Cardon, Icarus, 2013, 226, 355 CrossRef CAS.
- E. Pettinelli, B. Cosciotti, F. D. Paolo, S. E. Lauro, E. Mattei, R. Orosei and G. Vannaroni, Rev. Geophys., 2015, 53, 593 CrossRef.
- B. Brugger, O. Mousis, M. Deleuil and J. I. Lunine, Astrophys. J., Lett., 2015, 831, L16 CrossRef.
- K. Aagaard and E. C. Carmack, J. Geophys. Res., 1989, 94, 14485 CrossRef.
- A. Y. Shcherbina, L. D. Talley and D. L. Rudnick, Science, 2003, 302, 1952 CrossRef CAS PubMed.
- K. I. Ohshima, Y. Fukamachi, G. D. Williams, S. Nihashi, F. Roquet, Y. Kitade, T. Tamura, D. Hirano, L. Herraiz-Borreguero, I. Field, M. Hindell, S. Aoki and M. Wakatsuchi, Nat. Geosci., 2013, 6, 235 CrossRef CAS.
- I. Tsironi, D. Schlesinger, A. Spah, L. Eriksson, M. Segad and F. Perakis, Phys. Chem. Chem. Phys., 2020, 22, 7625 RSC.
- M. Conde, M. Rovere and P. Gallo, J. Mol. Liq., 2018, 261, 513–519 CrossRef CAS.
- J. S. Kim and A. Yethiraj, J. Chem. Phys., 2008, 129, 124504 CrossRef PubMed.
- V. F. Petrenko and R. W. Whitworth, Physics of Ice, Oxford University Press, 1999 Search PubMed.
- N. Bjerrum, Science, 1952, 115, 385–390 CrossRef CAS PubMed.
- G. W. Gross, Ann. N. Y. Acad. Sci., 1965, 125, 380 CrossRef CAS.
- G. W. Gross, Adv. Chem., 1968, 73, 27 Search PubMed.
- A. W. Cobb and G. W. Gross, J. Electrochem. Soc., 1969, 116, 796 CrossRef CAS.
- C. Jaccard, Ann. N. Y. Acad. Sci., 1965, 125, 390–400 CrossRef CAS.
- I. G. Young and R. E. Salomon, J. Chem. Phys., 1968, 48, 1635–1644 CrossRef CAS.
- D. J. Kelly and R. E. Salomon, J. Chem. Phys., 1969, 50, 75–79 CrossRef CAS.
- R. G. Seidensticker and R. L. Longini, J. Chem. Phys., 1969, 50, 204–213 CrossRef CAS.
- S. Klotz, L. E. Bove, T. Strässle, T. C. Hansen and A. M. Saitta, Nat. Mater., 2009, 8, 405 CrossRef CAS PubMed.
- L. E. Bove, R. Gaal, Z. Raza, A. A. Ludl, S. Klotz, A. M. Saitta, A. F. Goncharov and P. Gillet, Proc. Natl. Acad. Sci. U. S. A., 2015, 112, 8216 CrossRef CAS PubMed.
- V. Rozsa and G. Galli, J. Chem. Phys., 2021, 154, 144501 CrossRef CAS PubMed.
- M. M. Conde, M. Rovere and P. Gallo, Phys. Chem. Chem. Phys., 2017, 19, 9566 RSC.
- M. M. Conde, M. Gonzalez, J. Abascal and C. Vega, J. Chem. Phys., 2013, 139, 154505 CrossRef CAS PubMed.
- M. M. Conde, M. Rovere and P. Gallo, J. Chem. Phys., 2017, 147, 244506 CrossRef CAS PubMed.
- A. Zaragoza, M. M. Conde, J. R. Espinosa, C. Valeriani, C. Vega and E. Sanz, J. Chem. Phys., 2015, 143, 134504 CrossRef PubMed.
- H. Nada and Y. Furukawa, J. Cryst. Growth, 2005, 283, 242 CrossRef CAS.
- M. M. Conde, C. Vega and A. Patrykiejew, J. Chem. Phys., 2008, 129, 014702 CrossRef CAS PubMed.
- J. R. Espinosa, E. Sanz, C. Valeriani and C. Vega, J. Chem. Phys., 2013, 139, 144502 CrossRef PubMed.
- V. Buch, P. Sandler and J. Sadlej, J. Phys. Chem. B, 1998, 102, 8641 CrossRef CAS.
- J. D. Bernal and R. H. Fowler, J. Chem. Phys., 1933, 1, 515 CrossRef CAS.
- D. Frenkel, Eur. Phys. J. Plus, 2013, 128, 10 CrossRef.
- D. van Der Spoel, E. Lindahl, B. Hess, G. Groenhof, A. E. Mark and H. J. C. Berendsen, J. Comput. Chem., 2005, 26, 1701 CrossRef CAS PubMed.
- S. Nosé, J. Chem. Phys., 1984, 81, 511 CrossRef.
- W. G. Hoover, Phys. Rev. A: At., Mol., Opt. Phys., 1985, 31, 1695 CrossRef PubMed.
- M. Parrinello and A. Rahman, J. Appl. Phys., 1981, 52, 7182 CrossRef CAS.
- J. L. F. Abascal and C. Vega, J. Chem. Phys., 2005, 123, 234505 CrossRef CAS PubMed.
- C. Vega, 2016, private communication.
- A. L. Benavides, M. A. Portillo, V. C. Chamorro, J. R. Espinosa, J. L. F. Abascal and C. Vega, J. Chem. Phys., 2017, 147, 104501 CrossRef CAS PubMed.
- I. M. Zeron, J. L. F. Abascal and C. Vega, J. Chem. Phys., 2019, 151, 134504 CrossRef CAS PubMed.
- U. Essmann, L. Perera, M. L. Berkowitz, T. Darden, H. Lee and L. G. Pedersen, J. Chem. Phys., 1995, 103, 8577 CrossRef CAS.
- N. Maeno, Can. J. Phys., 1973, 51, 1045 CrossRef CAS.
- G. W. Gross, I. C. Hayslip and R. N. Hoy, J. Glaciol., 1978, 21, 143 CrossRef CAS.
- N. W. Riley, G. Noll and J. W. Glen, J. Glaciol., 1978, 21, 501 CrossRef CAS.
- R. E. Grimm, D. E. Stillman, S. F. Dec and M. A. Bullock, J. Phys. Chem. B, 2008, 112, 15382 CrossRef CAS PubMed.
- T. L. Malkin, B. J. Murray, A. V. Brukhno, J. Anwar and C. G. Salzmann, Proc. Natl. Acad. Sci. U. S. A., 2012, 109, 1041 CrossRef CAS PubMed.
- W. F. Kuhs, C. Sippel, A. Falenty and T. C. Hansen, Proc. Natl. Acad. Sci. U. S. A., 2012, 109, 21259 CrossRef CAS PubMed.
- L. del Rosso, M. Celli, F. Grazzi, M. Catti, T. C. Hansen, A. D. Fortes and L. Ulivi, Nat. Mater., 2020, 19, 663 CrossRef CAS PubMed.
- http://www.lsbu.ac.uk/water/ .
- B. Kamb and A. Prakash, Acta Crystallogr., Sect. B: Struct. Crystallogr. Cryst. Chem., 1968, 24, 1317 CrossRef CAS.
- B. Kamb, A. Prakash and C. Knobler, Acta Crystallogr., 1967, 22, 706 CrossRef CAS.
- B. Kamb, Science, 1965, 150, 205 CrossRef CAS PubMed.
Footnote |
| † Electronic supplementary information (ESI) available: Movies of MD trajectory of NaCl-doped ices Ih, Ic, III, V and VI. See DOI: 10.1039/d1cp02638k |
| This journal is © the Owner Societies 2021 |

