 Open Access Article
Creative Commons Attribution 3.0 Unported Licence
Electronic and steric effects of platinum(II) di-yne and poly-yne substituents on the photo-switching behaviour of stilbene: experimental and theoretical insights†
Idris Juma
Al-Busaidi
 a,
Ashanul
Haque
 b,
John
Husband
 a,
Nawal K.
Al Rasbi
a,
Osama K.
Abou-Zied
a,
Nawal K.
Al Rasbi
a,
Osama K.
Abou-Zied
 a,
Rayya
Al Balushi
c,
Muhammad S.
Khan
 *a and
Paul R.
Raithby
 *d
*d
aDepartment of Chemistry, Sultan Qaboos University, P.O. Box 36, Al Khoud 123, Sultanate of Oman. E-mail: msk@squ.edu.om
bDepartment of Chemistry, College of Science, University of Hail, Ha'il 81451, Kingdom of Saudi Arabia
cDepartment of Basic Science, College of Applied and Health Sciences, A'Sharqiyah University, Ibra 400, Sultanate of Oman
dDepartment of Chemistry, University of Bath, Claverton Down, Bath BA2 7AY, U.K.. E-mail: p.r.raithby@bath.ac.uk
First published on 25th January 2021
Abstract
A series of mono-, di-, and poly(platina-ynes) incorporating stilbene spacer units with the formulae trans-[R–C![[triple bond, length as m-dash]](https://www.rsc.org/images/entities/char_e002.gif) C–Pt(PBu3)2-C
C–Pt(PBu3)2-C![[triple bond, length as m-dash]](https://www.rsc.org/images/entities/char_e002.gif) C–R] (R = (E)-1,2-diphenylethene), trans-[(Ph)-(Et3P)2PtC
C–R] (R = (E)-1,2-diphenylethene), trans-[(Ph)-(Et3P)2PtC![[triple bond, length as m-dash]](https://www.rsc.org/images/entities/char_e002.gif) C–R–C
C–R–C![[triple bond, length as m-dash]](https://www.rsc.org/images/entities/char_e002.gif) CPt(PEt3)2(Ph)] (R = (E)-1,2-diphenylethene), and trans-[–(PnBu3)2PtC
CPt(PEt3)2(Ph)] (R = (E)-1,2-diphenylethene), and trans-[–(PnBu3)2PtC![[triple bond, length as m-dash]](https://www.rsc.org/images/entities/char_e002.gif) C–R–C
C–R–C![[triple bond, length as m-dash]](https://www.rsc.org/images/entities/char_e002.gif) C–]n (R = (E)-1,2-diphenylethene), respectively, have been synthesized and characterized to explore the effects of ligand topology on the photoisomerization and photophysical properties of these materials. The structural and photophysical properties of the complexes have been investigated and compared with those of the previously reported mono-, di- and poly(platina-ynes) incorporating azobenzene spacers. We found that the organometallic species 1M, 2M and 1P undergo topology-dependent reversible trans-to-cis photoisomerization in CH2Cl2 solution. Computational modelling supported the experimental findings.
C–]n (R = (E)-1,2-diphenylethene), respectively, have been synthesized and characterized to explore the effects of ligand topology on the photoisomerization and photophysical properties of these materials. The structural and photophysical properties of the complexes have been investigated and compared with those of the previously reported mono-, di- and poly(platina-ynes) incorporating azobenzene spacers. We found that the organometallic species 1M, 2M and 1P undergo topology-dependent reversible trans-to-cis photoisomerization in CH2Cl2 solution. Computational modelling supported the experimental findings.
Introduction
The term molecular switch is used to define a class of molecules that can undergo reversible chemical transformation between two or more states. This change in state, achieved by the action of light (photochromism) or other means (viz. mechanochromism, electrochromism) has found a variety of real-life applications.1–4 A plethora of organic and organometallic systems with dithienylethene,5 spiropyran,6 azobenzene,7 stilbene,8etc. scaffolds have demonstrated reversible switchability in the solid state as well as in solution. Among these scaffolds, photoisomerization processes in π-conjugated stilbene motifs have been known for more than seven decades.9 A vast number of studies have been carried out to shed light on the reactivity and excited-state properties of the stilbene-based chromophores. For example, it has been demonstrated that stilbene-based chromophores feature unique emission profiles, can undergo photoisomerization from the triplet manifold,10,11 and also display electrocyclisation.12 Another class of materials which have attracted the attention of researchers are π-conjugated “rigid-rod” poly-ynes and poly(metalla-ynes).13–19 Advantages of this class of materials include, but are not limited to, their high conductivity, tunable structural, photo-physical, photo-chemical and electrochemical properties, and solubility in organic as well aqueous media, etc. Because of these features, these materials have shown potential applications in optoelectronics, biologicals, catalysis, sensing and other areas.14,20,21 Comprehensive studies on poly-ynes and poly(metalla-ynes) by us and others21–23 have shown that the π-conjugation and the extent of delocalization in such systems are highly dependent on the geometry, the ligand environment around the metal centre and the presence or absence of other metal ions.10,24 For instance, we have recently shown that the incorporation of a second metal ion such Re(I)25 and Eu(III)26 is an effective strategy to fine tune their absorption and emission profiles. Prior to this, we found that Pt(II) di-ynes and poly-ynes incorporating azobenzene (I–IV, Chart 1) exhibit topology-dependent photophysical properties.27 In general, the incorporation of the Pt(II)-acetylide framework into the di-ynes and poly-ynes led to a reduction in the efficiency of the isomerization compared to that observed in the related acetylide-functionalized azobenzene compounds.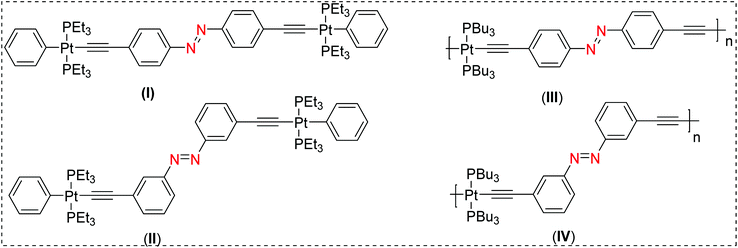 | ||
| Chart 1 Previously reported Pt(II) diynes (I & II) and poly-ynes (III & IV) incorporating azobenzene molecular switches.21 | ||
Extending our study, we report herein the synthesis and characterization of a new series of mono, di- and poly-nuclear platina-ynes incorporating stilbene ligands linking Pt(II) acetylide units in the dimeric and polymeric complexes. We demonstrate how the substitution pattern affects the photophysical profiles. We also compare the photophysical property differences between mono- and dinuclear Pt(II) acetylide complexes incorporating stilbene and azobenzene systems. The experimental measurements are supported by quantum-mechanical modelling for a subset of materials, which is used to interpret the spectroscopy and to investigate the energetics of the isomerization process.
Results and discussion
Synthesis and spectroscopic characterization
A modified Pd(II)/Cu(I)-catalyzed cross-coupling reaction between dibromo (1) and monobromostilbene (2) with trimethylsilylethyne was performed in diisopropylamine/tetrahydrofuran (iPr2NH/THF) to obtain 1,2-bis(4-((trimethylsilyl)ethynyl)phenyl)ethene (1a) and 1-(trimethylsilyl)ethynyl(4-styrylbenzene (2a) (Scheme 1).28 The protected di- and mono-alkynes (1a–2a) were stable to air and light and were characterized by IR and NMR (1H and 13C) spectroscopy, electrospray ionization mass spectrometry (ESI-MS), and elemental analysis. Protodesilylation of 1a–2a was accomplished with dilute aqueous KOH in methanol (MeOH)/THF to yield terminal di- and mono-alkynes 1,2-bis(4-ethynylphenyl)ethene (1b) and 1-ethynyl-4-styrylbenzene (2b). The terminal alkynes 1b–2b were purified by silica gel column chromatography and isolated as pale-orange powders in >80% yield. Due to the high reactivity of terminal alkynes, 1b–2b were freshly prepared before reaction with the Pt(II) precursor complexes. The dehydrohalogenation reaction between trans-[(Pt(Et3P)2PhCl] and 1b in a 2![[thin space (1/6-em)]](https://www.rsc.org/images/entities/char_2009.gif) :
:![[thin space (1/6-em)]](https://www.rsc.org/images/entities/char_2009.gif) 1 stoichiometry, in iPr2NH/CH2Cl2, in the presence of CuI, at room temperature, afforded the di-nuclear Pt(II) diyne 1M. Similarly, the mono-nuclear Pt(II) diyne 2M was obtained by reacting trans-[(PnBu3)2PtCl2] and 2b in a 1
1 stoichiometry, in iPr2NH/CH2Cl2, in the presence of CuI, at room temperature, afforded the di-nuclear Pt(II) diyne 1M. Similarly, the mono-nuclear Pt(II) diyne 2M was obtained by reacting trans-[(PnBu3)2PtCl2] and 2b in a 1![[thin space (1/6-em)]](https://www.rsc.org/images/entities/char_2009.gif) :
:![[thin space (1/6-em)]](https://www.rsc.org/images/entities/char_2009.gif) 2 ratio while polycondensation reaction between trans-[(PnBu3)2PtCl2] and 1b in a 1
2 ratio while polycondensation reaction between trans-[(PnBu3)2PtCl2] and 1b in a 1![[thin space (1/6-em)]](https://www.rsc.org/images/entities/char_2009.gif) :
:![[thin space (1/6-em)]](https://www.rsc.org/images/entities/char_2009.gif) 1 ratio under similar reaction conditions yielded the Pt(II) poly-yne 1P (Scheme 1). Purification of the Pt(II) diynes and poly-yne was carried out using silica and alumina columns, respectively.
1 ratio under similar reaction conditions yielded the Pt(II) poly-yne 1P (Scheme 1). Purification of the Pt(II) diynes and poly-yne was carried out using silica and alumina columns, respectively.
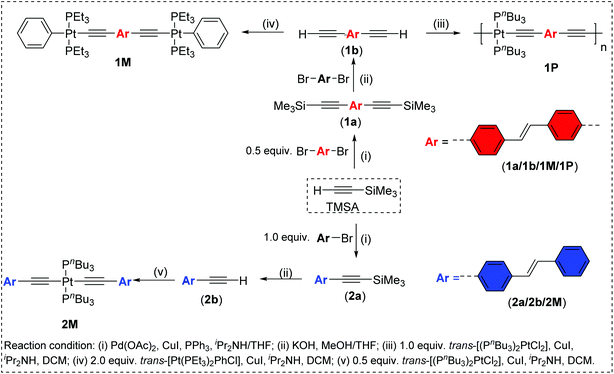 | ||
| Scheme 1 Synthesis of ligand precursors 1a–1b/2a–2b, the Pt(II) di-ynes (1M/2M) and the poly-yne 1P. | ||
The IR spectra of the Pt(II) diynes (1M–2M) and the poly-yne (1P) showed a single, sharp νC![[triple bond, length as m-dash]](https://www.rsc.org/images/entities/char_e002.gif) C absorption at 2092–2093 cm−1, consistent with a trans configuration of the ethynylenic units around Pt(II) centre.29 The νC
C absorption at 2092–2093 cm−1, consistent with a trans configuration of the ethynylenic units around Pt(II) centre.29 The νC![[triple bond, length as m-dash]](https://www.rsc.org/images/entities/char_e002.gif) C values for the terminal alkynes (1b–2b) were considerably lower (2101–2105 cm−1) than corresponding trimethylsilyl-protected alkynes 1a–2a (2152 cm−1). The Pt(II) diynes and poly-yne display lower νC
C values for the terminal alkynes (1b–2b) were considerably lower (2101–2105 cm−1) than corresponding trimethylsilyl-protected alkynes 1a–2a (2152 cm−1). The Pt(II) diynes and poly-yne display lower νC![[triple bond, length as m-dash]](https://www.rsc.org/images/entities/char_e002.gif) C values than those in the corresponding protected or terminal dialkynes, an observation that has been attributed to either metalla-yne π-back-bonding or the Mδ+–Cδ− polarity.30
C values than those in the corresponding protected or terminal dialkynes, an observation that has been attributed to either metalla-yne π-back-bonding or the Mδ+–Cδ− polarity.30
In all of the ligand precursors and the Pt(II) complexes, clear 1H NMR resonances from the protons of the aromatic ring systems were observed, indicating the formation of the expected products.31 In general, the aromatic and vinyl protons in Z isomers are shifted to higher field than in their E isomers.32,33 We found that the commercially available starting materials, i.e. 1-bromo-4-styrylbenzene (δ = 6.94 ppm, d, J = 16.3 Hz, 1H and 7.01 ppm, d, J = 16.4 Hz, 1H) and 1,2-bis(4-bromophenyl)ethane (δ = 7.02 ppm, d, J = 17.2 Hz, 2H) exhibited well defined olefinic peaks due to the trans configuration. Similar resonances (between 6.7 and 7.0 ppm) of the stilbene units were found in the monomer (2M), dimer (1M) and polymer (1P) in addition to the aromatic protons. Further confirmation was made by irradiating the samples with UV light (i.e. photo-isomerization). Upon irradiation, a new peak at 6.4–6.5 ppm arises, attributed to the olefin protons in cis-stilbene unit(s).10 The two distinct 13C NMR resonances of the ethynylic carbon atoms in the Pt(II) diynes and poly-yne were shifted downfield relative to the signals from the terminal alkynes, in agreement with the expected structures. The resonances due to the ethyl and butyl groups of the auxiliary ligands in the Pt(II) diynes and poly-yne, respectively, could be clearly identified.
The MS results confirm the molecular masses expected for the ethynyl ligands and the Pt(II) diyne complexes. For instance, the ESI-MS spectra of the complexes show molecular ion peaks at 372.70 (1a), 229.1 (1b), 276.5 (2a), 204.0 (2b), 1243.4 (1M) and 1006.0 (2M), confirming proposed formulations for the protected and deprotected ligands as well as the Pt(II) di-yne complexes. 1H and 13C NMR, IR and ESI-MS spectra of the intermediate and final compounds can be found in ESI (Fig. S1–S30†). Gel permeation chromatography (GPC) calibrated against a polystyrene standard gave weight-average molecular weight (Mw) of 39![[thin space (1/6-em)]](https://www.rsc.org/images/entities/char_2009.gif) 568 g mol−1 for the poly-yne 1P, corresponding to a degree of polymerization (DP) 48. The polydispersity index (PDI) was found to be 1.7. The relatively narrow polydispersity (PDI < 2) in the molecular weight is consistent with the proposed linear structure. A high DP in the poly-yne was also supported by NMR spectroscopy, in which resonances corresponding to protons on the terminal end groups were too weak to be observed.
568 g mol−1 for the poly-yne 1P, corresponding to a degree of polymerization (DP) 48. The polydispersity index (PDI) was found to be 1.7. The relatively narrow polydispersity (PDI < 2) in the molecular weight is consistent with the proposed linear structure. A high DP in the poly-yne was also supported by NMR spectroscopy, in which resonances corresponding to protons on the terminal end groups were too weak to be observed.
Structural characterization
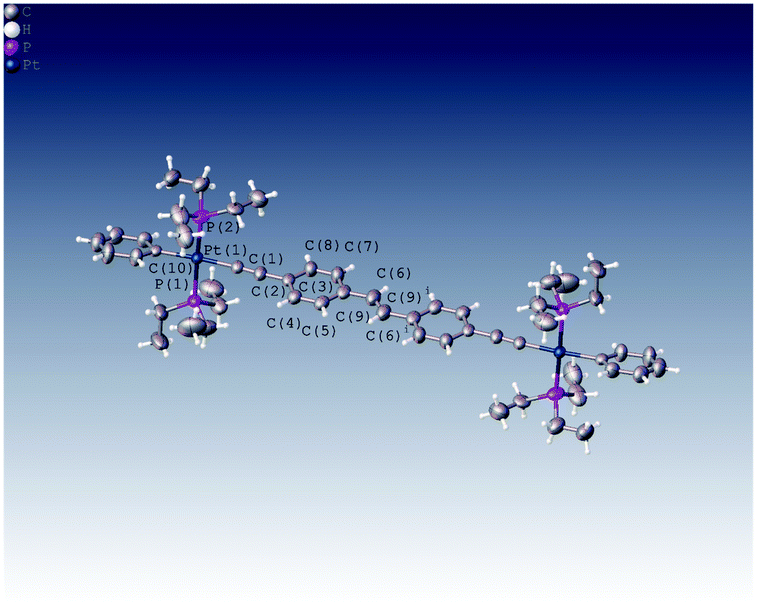
We were able to grow crystals of the Pt(II) diyne complexes 1M and 2M, suitable for single-crystal X-ray diffraction. The crystal structure of 2M has been reported previously;10 and a preliminary X-ray analysis confirms that the same polymorph was obtained in this study. The structure of 1M is shown in Fig. 1 and crystallographic parameters (Table ST1) and displacement parameters and bond parameters (Tables ST2–ST8) are presented in the ESI.†
1M crystallizes in the monoclinic space group P21/c, with half the dimeric complex in the asymmetric unit and the midpoint of the ethylene C![[double bond, length as m-dash]](https://www.rsc.org/images/entities/char_e001.gif) C bond corresponding to a crystallographic centre of symmetry. The X-ray structure of 1M confirms the dinuclear Pt(II) complex in which the stilbene spacer forms the central core of the complex, i.e., the Pt–C
C bond corresponding to a crystallographic centre of symmetry. The X-ray structure of 1M confirms the dinuclear Pt(II) complex in which the stilbene spacer forms the central core of the complex, i.e., the Pt–C![[triple bond, length as m-dash]](https://www.rsc.org/images/entities/char_e002.gif) C-p-C6H4-C
C-p-C6H4-C![[double bond, length as m-dash]](https://www.rsc.org/images/entities/char_e001.gif) C-p-C6H4C
C-p-C6H4C![[triple bond, length as m-dash]](https://www.rsc.org/images/entities/char_e002.gif) C–Pt unit. The two arene rings are in a trans arrangement about the ethylene C
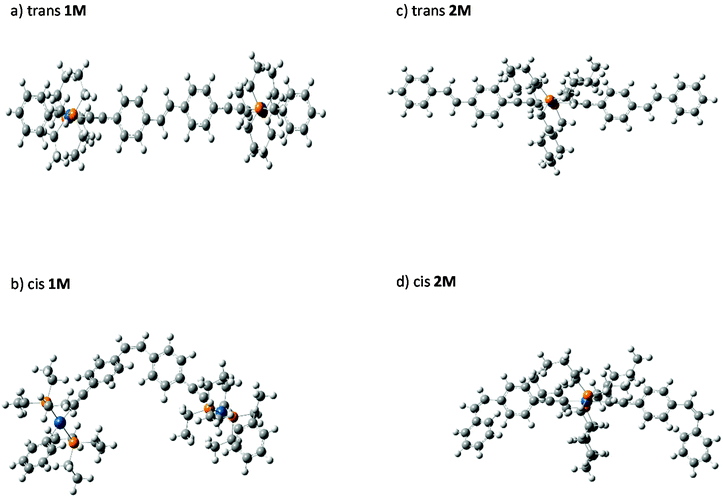
C–Pt unit. The two arene rings are in a trans arrangement about the ethylene C![[double bond, length as m-dash]](https://www.rsc.org/images/entities/char_e001.gif) C bond in the stilbene spacer unit. The coordination geometry around each of the two Pt(II) centres is square-planar (PtC2P2) with a trans relationship between the two phosphine groups. All bond distances about Pt(II) centre were found to be within the expected ranges for previously reported dimeric Pt(II) diyne complexes.21,29,34–37 The most interesting feature about this complex is the co-planarity of the stilbene spacer in which the two phenyl rings and the ethynylenic bond are in one plane as required by crystallographic symmetry. The measured dihedral angle between the two phenyl planes is 180.0°, identified by C7–C6⋯C6i–C7i. However, the terminal phenyl rings bonded to the Pt(II) centres are tilted from the planarity, with respect to the stilbene plane, with a dihedral angle of 17.97° identified by C11–C10–C8–C3. Moreover, the coordination plane of Pt(II) (PtC2P2) is almost perpendicular to the plane of stilbene spacer in which the measured dihedral angle is 95.66° (identified by C4–C3–C1–P2).
C bond in the stilbene spacer unit. The coordination geometry around each of the two Pt(II) centres is square-planar (PtC2P2) with a trans relationship between the two phosphine groups. All bond distances about Pt(II) centre were found to be within the expected ranges for previously reported dimeric Pt(II) diyne complexes.21,29,34–37 The most interesting feature about this complex is the co-planarity of the stilbene spacer in which the two phenyl rings and the ethynylenic bond are in one plane as required by crystallographic symmetry. The measured dihedral angle between the two phenyl planes is 180.0°, identified by C7–C6⋯C6i–C7i. However, the terminal phenyl rings bonded to the Pt(II) centres are tilted from the planarity, with respect to the stilbene plane, with a dihedral angle of 17.97° identified by C11–C10–C8–C3. Moreover, the coordination plane of Pt(II) (PtC2P2) is almost perpendicular to the plane of stilbene spacer in which the measured dihedral angle is 95.66° (identified by C4–C3–C1–P2).
Optical spectroscopy
The spectra of the ligand precursors (4-bromostilbene and 4,4′-dibromostilbene) show intense primary absorption bands at ∼317–325 nm in dichloromethane (Fig. S31, ESI†), respectively, assigned to π → π* transitions.40 The room temperature absorption spectra of trimethylsilyl-acetylide stilbene ligands (1a, 2a), Pt(II) di-ynes (1M, 2M) and the poly-yne (1P) in dichloromethane solution are shown in Fig. 2 and the spectral data are provided in Table 1.
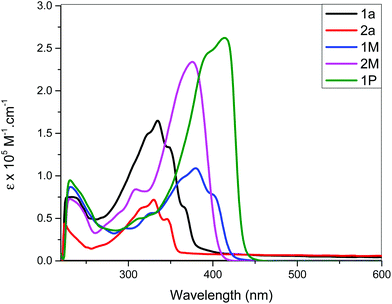 | ||
| Fig. 2 Absorption spectra of stilbene-acetylide ligands (1a–2a), Pt(II) di-ynes 1M, 2M and poly-yne 1P. | ||
| Photophysical data | Code | ||||||
|---|---|---|---|---|---|---|---|
| 1M | 2M | 1P | (I) | (II) | (III) | (IV) | |
| All measurements were taken in 1 × 10⁻⁵ M CH2Cl2 at room temperature.a Excitation wavelength in solution.b Uncertainty is ±0.03 ns.c Optical bandgaps (Eopg) were determined from onset of absorption in solutions.d Very weak emission.e Shorter than the instrument response function (IRF). | |||||||
| λ abs (nm) | 380 | 376 | 413 | 441 | 323 | 456 | 335 |
λ
ext![[thin space (1/6-em)]](https://www.rsc.org/images/entities/char_2009.gif) a (nm) a (nm) |
380 | 380 | 380 | 350 | — | — | 340 |
| λ ems (nm) | 423, 448, 477sh | 409, 432, 478sh | 436, 460sh | 380, 400 | |||
τ
flu![[thin space (1/6-em)]](https://www.rsc.org/images/entities/char_2009.gif) b (ns) b (ns) |
1.10 | 1.09 | 2.47 | — | — | ||
| E opg (eV) | 2.82 | 2.96 | 2.77 | 2.35 | 3.39 | 2.33 | 2.97 |
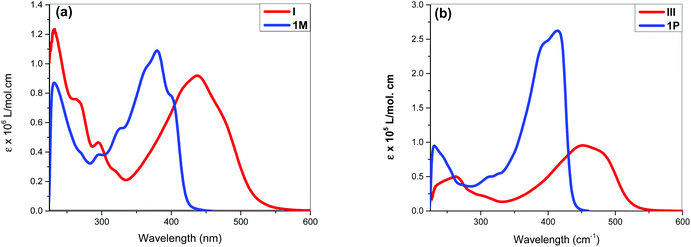
The acetylide-functionalised ligands show intense primary bands (2a: λmax = 331 nm, ε = 0.71 × 10⁵ M−1 cm−1) (1a: at λmax = 336 nm, ε = 1.66 × 10⁵ M−1 cm−1) as expected. The introduction of Pt(II) acetylide moieties modulates the absorption profile of the stilbene units more effectively. For example, a significant red shift in the absorption maximum was noted for the mononuclear Pt(II) di-yne complex 2M (λmax = 376 nm, ε = 2.34 × 10⁵ M−1 cm−1) compared to the 4-bromostilbene (λmax = 317 nm, ε = 2.69 × 10⁵ M−1 cm−1). A more pronounced effect was noted in the dinuclear Pt(II) di-yne complex 1M (λmax = 380 nm, ε = 1.09 × 10⁵ M−1 cm−1), which could be attributed to the extended conjugation length.27,28 In the case of the poly(platina-yne) 1P, the absorption maxima shifted to the visible region (λmax = 418 nm, ε = 2.59 × 10⁵ M−1 cm−1). Overall, using this strategy, the absorption maxima of the stilbene core can be shifted by up to 100 nm (λpolymermax − λligandmax = 99 nm).
Fig. 3 shows comparative absorption spectra of stilbene incorporated Pt(II) di-yne (1M) and poly-yne (1P) with their azobenzene counterparts (I & III, Chart 1 and Table 1).27 The absorption spectra of meta-azobenzene incorporated Pt(II) di-yne (II) and poly-yne (IV) systems are shown in Fig. S32 (ESI†). The absorption spectra of (I) show a red-shifted band (λmax = 441 nm, ε = 0.91 × 10⁵ M−1 cm−1) compared to 1M (λmax = 380 nm, ε = 1.09 × 10⁵ M−1 cm−1). The same behaviour was noted for poly-ynes, (III) was red-shifted (λmax = 456 nm, ε = 0.95 × 10⁵ M−1 cm−1) relative to 1P (λmax = 413 nm, ε = 2.59 × 10⁵ M−1 cm−1). Interestingly, azobenzene bearing platina-ynes exhibited absorption spectra that are broader than their stilbene counterparts are which may be due to more energy states being accessible in the azobenzene systems. On the other hand, the spectra of 1M and 1P show high ε values compared to those of the azobenzene counterparts, which are consistent with the enhanced electronic delocalization across stilbene units. The enhanced absorption at visible wavelengths can be attributed to metal-to-ligand charge-transfer (MLCT) excitations.41 The enhanced ε of A band (e.g. the lower energy 383 and 398 nm for 1M) is considered to be the conjugation band and is the most prominent feature in trans-stilbene complexes, which are assigned to IL π → π* excitations.40
![[triple bond, length as m-dash]](https://www.rsc.org/images/entities/char_e002.gif) C bond axis, which inhibits the barrier crossing and therefore increases the excited state lifetime.43,44
C bond axis, which inhibits the barrier crossing and therefore increases the excited state lifetime.43,44
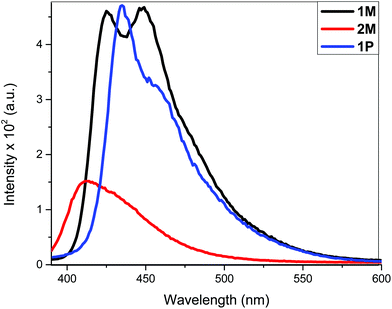
The fluorescence bands of 1M and 1P show bathochromic shifts with respect to those of 2M owing to the more conjugated backbone. The emission study of 2M was repeated at two lower concentrations (1 × 10⁻⁶ and 1 × 10⁻⁷ M) in order to investigate any possible self-quenching of emission due to high concentration of monomer or dimer formation. However, the emission spectra showed similar behaviour matching the trend, which is a low emission intensity with decreasing concentration. This means that the low emission behaviour of 2M is an inherent feature. The presence of two stilbene moieties in the chemical structure of 2M is responsible for the observed relatively large extinction coefficient. However, the absorbance band reflects a Franck–Condon (FC) envelope that is unstructured, compared to the absorption bands of 1M and 1P (Fig. 2), which indicates a large number of vibrational states accessible in 2M. This stems from the ability of the stilbene molecule to vibrate more freely in 2M due to its terminal location, whereas in 1M and 1P the motion of stilbene is much more restricted due to its central position and the more conjugated nature of the structures. On the other hand, high vibrational levels are usually populated in the excited state by FC excitation in which deactivation, in this case, is dominated by the vibrational dynamics of stilbene on the excited state potential energy surface. This is enhanced by the longer emission lifetime of the excited state of stilbene (nanoseconds, vide supra) than vibrational relaxation (typically picoseconds), which leads to population of a large number of vibrational states before emission takes place. This is evidenced in the unstructured emission band of 2M, compared to those of 1M and 1P (see Fig. 4). Also, the presence of a large group attached from one side to each stilbene molecule in 2M substantially increases the density of states, giving a large number of accessible vibrational states for the initially prepared excited state to populate at the expense of radiative decay. All of these factors lead to weaker emission from 2M, compared to 1M and 1P. The corresponding azobenzene incorporated Pt(II) diynes and poly-ynes show either no or weak emission, relative to 1M and 1P (Table 1). The whole azobenzene series shows no emission or only weak emission in solution (Fig. S33, in the ESI†).
Photo-isomerization study
Light/heat induced structural transformation (trans ↔ cis isomerization and electrocyclization) and the mechanisms involved in stilbene derivatives are well known.45,46 For example, the UV spectrum of stilbene exhibits two distinct features: a lower energy A-band, and a higher energy B-band.47 These two bands are blue shifted in cis isomers compared to the trans.39,46 This hypsochromism could be attributed to the increase in interplanar angle θ (the angle through which the plane of each phenyl group rotates out of the central plane of the, essentially, double bond for the cis isomers) due to the non-planarity of the most probable configuration of cis-stilbene.46 In addition to the hypsochromism, the A-band in the cis-stilbene is structureless, in contrast to the structured band observed in trans-stilbene, and has a much lower molar absorption coefficient.37,54 Contrarily the B-band of cis-stilbene (also structureless) is more intense than that of trans-stilbene.52–54 Therefore, trans ↔ cis isomerization can easily be monitored using these two bands. It has previously been reported that the mono-substitutions in the para-position reduce the activation energy and ease trans–cis isomerization compared to pure stilbene. This is attributed to the high contribution of the charge-separated resonance form in which the central carbon–carbon bond is considered to be single.48The photo-isomerization behaviour of Pt(II) di- and poly-ynes incorporating stilbene spacers were assessed at 254 and 365 nm, at ambient temperature, in dichloromethane for different time intervals. The absorption profile of non-irradiated (t = 0 min) and irradiated (t = 10, 20 and 25 min) poly-yne 1P is depicted in Fig. 5. The absorption profiles of photo-isomerization behaviour of stilbene-acetylide ligands (1a, 2a) and Pt(II) di-ynes (1M, 2M) are shown in Fig. S34 and S35, respectively (see the ESI†).
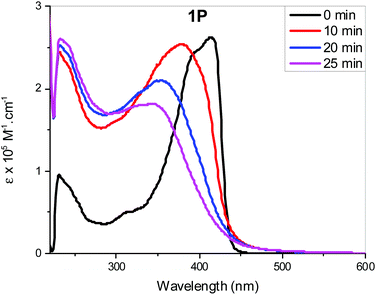 | ||
| Fig. 5 Absorption spectral profile of 1P upon irradiation with light at 365 nm at different exposure times. | ||
As can be seen, 1a, 2a started to photoisomerize after 10 min of irradiation, leading to a reduction in intensity of band A and intensification of band B. On the other hand, for 2M and 1P, changes in the absorption profile were noted after 20 min of UV irradiation (Fig. S35a, see the ESI†). As is evident from the spectra, irradiation of UV light converted trans isomers to cis in a time dependent manner. In general, all compounds exhibited following spectral features: band broadening (unstructured), blue shift of band A and an increase in molar absorption coefficient of band B upon increasing UV exposure time. Similar results were noted for both wavelengths (254 and 365 nm).
Schanze et al.10 demonstrated that in Pt(II) acetylides bearing two photoactive stilbene units, the irradiation of UV light (365 nm) causes isomerization only in one unit. Linseis et al.40 reported similar findings with vinyl ruthenium complexes derived from differently configured stilbenes. We find that upon radiation, at t = 0, the electronic spectra of 1M and 2M resemble those of the trans stilbenyl ruthenium complexes while after 10–25 min of light exposure, the peaks shifted to higher energy, more closely resembling the spectra for the cis-configuration.
The photo-isomerization studies of azobenzene-based materials in solution showed that acetylide ligands (Fig. S34c, see the ESI†) and, to a limited extent, their Pt(II) complexes (Fig. S35(c), see the ESI†) undergo reversible cis–trans photo-isomerization under irradiation at UV wavelengths.27 This was evident from a general decrease in the intensity of the absorption bands at longer wavelengths coupled with an increased intensity of shorter-wavelength bands in a similar manner to the stilbene analogues (1a, 1M and 1P). In both stilbene and azobenzene systems, the extent of isomerization is less marked in the Pt(II) di- and poly-ynes compared to their free acetylide-containing ligands. The effect of photo-irradiation or photo-isomerization process in Pt(II) di-ynes (1M and 2M) and poly-yne (1P) was also monitored by1H-NMR spectroscopy and the results are depicted in Fig. S18, S22, S26 and S28–S30.† Among others, emergence of new signal between δ 6.46–6.55 ppm clearly indicated the presence of cis-stilbene containing complexes in the solution.
Recovery time study
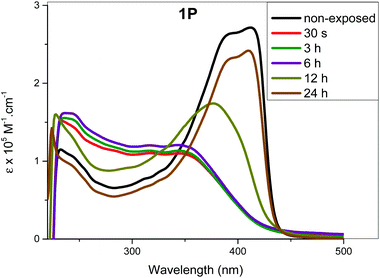
The determination of recovery time (time required to attain the most stable configuration) is an important factor that determines the application of a molecular switch. If the recovery is complete (i.e. the absorption profile matches that at t = 0 prior to exposure), it can be concluded that the isomerization process is efficient and no side reaction (photoaddition, photo-degradation or aggregation, etc.) is taking place. We determined the recovery time by monitoring spectral changes after irradiating the complexes in solution at λmax = 254 or 365 nm for 25 min. Following irradiation, the samples were left in dark and the absorption spectra were collected after regular periods (i.e. one measurement per hour). Fig. 6 and Fig. S36 (see the ESI†) shows the most prominent changes noted during the recovery time study. As it is clear from the figures, recovery time depends on the structure of the complexes. For 1M and 1P, the spectra started to resemble those of the trans-configuration after 19 h (Fig. 7 and Fig. S36, ESI†). On the other hand, the spectra of 2M started to resemble that of the trans-configuration after 7 h and a full recovery was achieved within 21 h. In the case of 1P, it took 24 h to attain the absorption features similar to the original trans-configuration absorption profile (Fig. 6). The 1P sample was further monitored for an additional 6 h, however, no change was observed in the absorption profile. This indicates that the compounds remained stable even after exposure to UV irradiation either at the low or high energy. The percentage increase in the cis-isomer absorbance and the corresponding decrease in the trans-isomer absorbance are included in Tables ST9–13† for the different periods of irradiation. It is noteworthy that after 25 min of UV exposure, the absorption spectra for all the compounds remain unchanged for almost 7 h, indicating the ability of the cis-configuration to retain the energy efficiently for a relatively long period before starting the recovery process to the trans-configuration.Considering the complex kinetics of the photoisomerization process that depend on several parameters (light energy and intensity, time of irradiation, temperature), a more detailed study on irradiation and recovery of the current compounds will be the subject of future work.
Computational modelling
trans-Stilbene is known to be 19.2 kJ mol−1 more stable than the cis isomer.9 To underpin the effect of metalation on the stability and isomerization of the stilbene isomers, cis–trans energy differences (ΔEcis–trans) of mono- (2M) and di-nuclear (1M) Pt(II) di-ynes were calculated computationally. Optimized (DFT) gas-phase structures for cis- and trans-isomers of 1M and 2M are shown in Fig. 7. The predicted gas-phase structures are in close correspondence to those determined for the crystalline forms. Continuing with the numbering scheme previously used for trans-1M, the dihedral C7–C6⋯C6′–C7′ equal to 178.4° while C4–C3–C1–P2 equals 92.8°. In a notable difference between the gas-phase and crystalline structures, the C11–C10–C3–C8 dihedral is predicted to be 5.3°, suggesting that the observed tilting of the terminal phenyl rings maybe due to a packing effect in the crystal. In the cis structures the expected, large, interplanar angle θ, is clearly evident with C7–C6⋯C6′–C7′ equal to 60.2° in cis-1M and the equivalent angles equal to 61.5° and 61.6° for cis-2M. A summary of the calculated energy differences is given in Table 2. It is clear, the calculated energy differences for the metal-containing compounds (2M & 1M) are close to those of stilbene itself.The cis–trans value calculated for 1M is only slightly higher than that calculated for stilbene (20.9 kJ mol−1 gas phase, 23.0 kJ mol−1 the polarizable continuum model, PCM); suggesting that the metal centres are sufficiently well separated in the cis isomer to not cause appreciable extra steric crowding. The energy difference in 2M is greater than that for 1M: presumably because of the double-cis configuration; indeed, the energy difference per cis configuration is less than that for 1M reflecting that the terminal stilbenes in 2M are closer in behaviour to free stilbene than is the bridging stilbene in 1M. The PCM results show no strong effect on the calculated energy differences although ΔEcis–trans is slightly larger for both 1M and 2M when the PCM is included compared to the gas-phase values. It should be noted that these ΔEcis–trans values are well below both the expected isomerization barrier (the isomerization barrier is 202 kJ mol−1 in stilbene9) and the photon energies used in the photoisomerization studies reported here. Further, while the steric bulk of the Pt(II) centres has been shown here not to strongly effect the energy difference between isomers, this does not preclude a strong steric effect on the barrier to internal rotation leading to isomerization. For comparison, the calculated27cis–trans energy difference for the azobenzene incorporated platinum(II) di-yne complex (I, Chart 1) is 72.21 kJ mol−1. The much larger energy difference for the azobenzene bearing complex reflects the larger cis–trans energy difference for azobenzene49 itself (49 kJ mol−1) compared to stilbene.
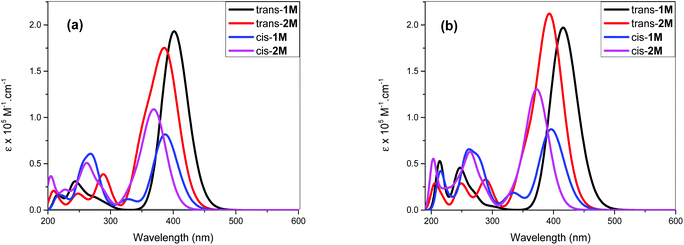
TD-DFT calculations at the ground-state optimized geometry were performed to calculate excitation energies. These vertical energy differences together with the calculated oscillator strengths can be used to provide comparison with the measured electronic absorption spectra. The TD-DFT calculations were performed with, and without, the inclusion of the PCM. Overlapped spectra resulting from the TD-DFT (gas phase and PCM) calculations are shown in Fig. 8a/b and Fig. S37–46 (ESI†).
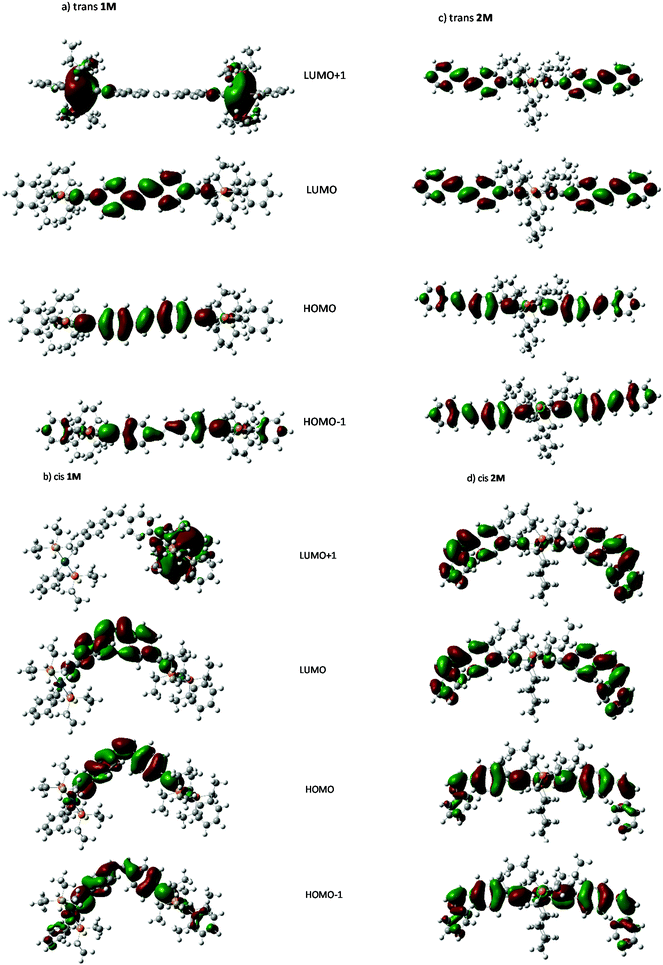
Individual spectra with line spectra indicating transitions from the ground state, are included in the ESI:† as shown in Fig. 8a and b the spectrum of the trans isomer of 1M is dominated by an absorbance maximum at 416 nm (402 nm gas-phase) while that for trans-2M the peak is blue-shifted by 23 nm with a concurrent increase in absorptivity. These trends match well with the absorbance spectra shown in Fig. 2. Compared to the trans spectra, the corresponding bands in the cis spectra show a blue shift of 20 nm and a concurrent dramatic decrease in absorptivity. These trends match well with the known absorbance spectra of cis- and trans-stilbene.9 Analysis of the calculated transitions indicate that the longest wavelength transition is overwhelmingly LUMO ← HOMO in character for both cis- and trans-isomers of 1M (99%) and that the largest contribution for cis- and trans-isomers of 2M is also LUMO ← HOMO (88% and 93%, respectively) with a minor contribution from LUMO+1 ← HOMO−1 (11% and 6% respectively). The predicted blue-shift in the absorbance of the cis isomers compared to those for the trans help to account for the spectral changes observed in the photoisomerization experiments performed in CH2Cl2. The calculated electronic energy levels along with relevant frontier orbitals are shown in Fig. 9 and 10, respectively.
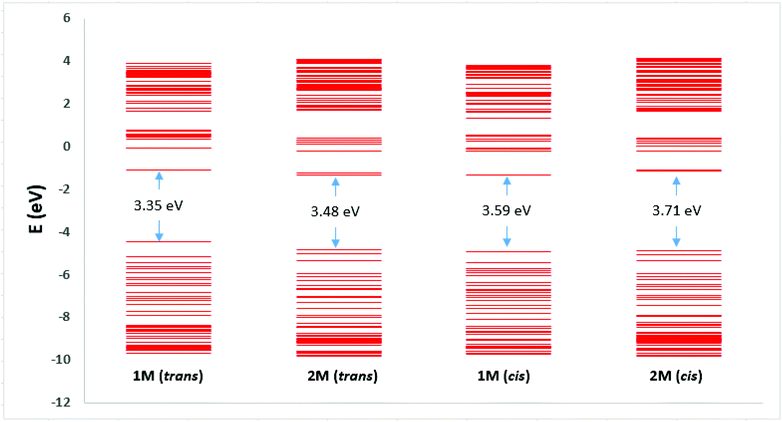 | ||
| Fig. 9 Electronic energy levels. In each case the first 50 levels above and below the LUMO and HOMO are shown. | ||
The HOMO/LUMO gaps of dinuclear Pt(II) complexes (1M) are lower than those of mononuclear Pt(II) complexes (2M) at 3.35/3.59 and 3.48/3.71 eV for the trans/cis stilbene geometries, respectively. And for both complexes the HOMO/LUMO gaps are smaller for the trans isomers than the cis, thus the LUMO/HOMO energy gaps correlate with the position of the lowest energy transition in the predicted absorption spectra (Table ST14, ESI†). Similar observations were noted for dinuclear Pt(II) complexes of azobenezene. However, compound I with para-substituted azobenezene, HOMO/LUMO gaps are significantly lower than 1M at 2.87/2.99 eV for the trans/cis azo geometries (Table ST15, ESI†). This may explain the red shift observed in optical absorption for I in Fig. 3a.
Visual analysis of the orbitals suggests that LUMO ← HOMO transition in both 1M and 2M, and the LUMO+1 ← HOMO−1 transition in 2M represent transitions between states of π symmetry, and result in locally excited (LE) states with electron density spatially distributed in the excited state very similarly to that in the ground state. Those features are similar to those reported for Ru-based stilbene units with dinuclear and mononuclear complexes.40 Further visual analysis of the frontier orbitals suggests that the degree of spatial overlap between the HOMO and LUMO orbitals is slightly greater for the trans isomer of each complex than the cis which correlates with the lower absorptivities, and oscillator strengths calculated for the cis complexes.
A Natural bond orbital analysis (Gaussian NBO Version 3.1) of trans-stilbene, based on the ground and excited-state populations, gives occupations of 1.98 and 1.87 respectively for the σ- and π-components of the central bond in S0, while only a σ-bond is indicated in S1′ with an occupation of 1.98. This is entirely consistent with there being a large barrier for internal rotation about the central bond (and hence isomerization) in the ground state, and that vibrational relaxation following excitation to S1, at the ground-state equilibrium geometry, results in rotation about the central bond and the subsequent formation of ground state cis- and trans-isomers. NBO analysis for trans-1M gives a similar picture for S0 (occupations 1.98 and 1.86 for the σ- and π-components) while in S1 the pertinent occupations are given as 1.98 and 1.70. Thus, the π-component is seen to be only partially reduced (10%), and implying a barrier for internal rotation about the central bond remains in S1. This would suggest that photoisomerization via S1 requires light of sufficient energy to initially excite the complex to a vibronic state above the barrier, and further, that rotation to a cis-like conformer must occur before vibrational relaxation below the barrier height takes place. While further study is indicated, residual double-bond character in S1 is consistent with the limited extent of photoisomerization observed for these complexes.
Conclusion
A new series of Pt(II) di- and poly-ynes incorporating para-substituted stilbene spacers have been successfully synthesized. The synthesized ligands and Pt(II) complexes have been fully characterized and the solid-state structure of a model di-yne compound has also been determined. Photo-physical properties of the materials in solution states have been determined. The structural and photo-physical features of the compounds were supplemented by computational studies at TD-DFT level.We have demonstrated that all compounds undergo photo-induced reversible trans-to-cis isomerization in solution. The extent of isomerization in stilbene derivatives, like azobenzene systems, has been found to be affected by the metalation. We found that the simulated spectra of the cis and trans isomers of 1M and 2M show a blue shift of the most prominent band with a concurrent reduction in molar absorptivity, while an enhancement of the molar absorptivity of the high energy peaks is also predicted. These results are consistent with conclusions drawn from the photoisomerization study.
Experimental section
General procedures
All reactions were performed under a dry argon atmosphere using standard Schlenk-line techniques. Solvents were pre-dried and distilled before use according to standard procedures.50 All chemicals, except where stated otherwise, were obtained from Sigma-Aldrich and used as received. The compounds trans-[Ph(Et3P)2PtCl],51trans-[(P nBu3)2PtCl2]51 and 2M![[thin space (1/6-em)]](https://www.rsc.org/images/entities/char_2009.gif) 10 were prepared following reported procedures.
10 were prepared following reported procedures.
Column chromatography was performed either with Kieselgel 60 (230–400 mesh) silica gel or alumina (Brockman Grade-I). NMR spectra were recorded in CDCl3 using Bruker WM-250 and AM-400 spectrometers and a Bruker Avance III HD 700 MHz spectrometer equipped with 5 mm TCI H/C/N cryoprobe. The 1H and 13C NMR spectra were referenced to solvent resonances. For labelled (numbered) chemical structures, please refer to Fig. S47 (ESI†). IR spectra were recorded using a Cary 630 FTIR spectrometer. UV/vis spectra were recorded with Shimadzu UV- 2450 spectrometer. Mass spectra were acquired using a Kratos MS 890 spectrometer using electrospray-ionization (ESI) techniques. Microanalysis was carried out at the Department of Chemistry, Sultan Qaboos University. UV–visible spectra were recorded on a Varian Cary 50 spectrophotometer in 200–800 nm range. Quartz cuvettes of 1 cm path length were used, and solvent background corrections were applied.
Fluorescence spectra were recorded on a Shimadzu RF-5301 spectrofluorophotometer and a PerkinElmer LS 55 fluorescence spectrometer. The fluorescence spectra were corrected for the difference in optical density at the excitation wavelength and inner-filter effect using the following equation:52,53
| Fcorr = Fobs × antilog((ODex + ODem)/2) | (1) |
The photoirradiation experiments were carried out in dichloromethane (CH2Cl2) under a multiband UV lamp (Mineralight Lamp UVGL-55; 230 V and 6 W). This type of lamp emits radiation at both short (254 nm) and longer (365 nm) wavelengths; the shorter wavelength window was used for these experiments. Spectra were recorded at different intervals (0, 10, 20 and 25 min).
Gel permeation chromatography (GPC) system was used to characterize the synthesized polymer (organic poly-ynes). A Viscotek GPCmax instrument (VE2001) equipped with a TDA 305 triple detector array consisting of refractive index (RI), light scattering both at right and low angles (RALS, and LALS respectively), viscometer detectors, and as well, a UV detector (Viscotek 2600) was used. Three Polyanalytik SupeRes™ Series 300 mm × 8 mm linear mixed bed columns having linear polystyrene molar mass ranges of 103 to 106 were used in the analysis. The instrument was operated at a temperature of 35 °C and THF at a flow rate of 1 mL min−1 served as eluent for the analysis. The absolute number-average molecular weight (Mn), weight-average molecular weight (Mw) and polydispersity index (Mw/Mn) of the synthesized polymers were obtained by analyzing the chromatograms with the OmniSEC 4.6.1 software package. An estimated value of (0.12) for refractive index increment (dn/dc) was used in all cases.
Ligand synthesis
![[thin space (1/6-em)]](https://www.rsc.org/images/entities/char_2009.gif) :
:![[thin space (1/6-em)]](https://www.rsc.org/images/entities/char_2009.gif) 4 v/v) under an argon atmosphere were added catalytic amounts of CuI (5 mg), Pd(OAc)2 (6 mg), and PPh3 (45 mg). The solution was stirred for 30 min at room temperature followed by the addition of (trimethylsilyl)ethyne (0.67 mL, 4.79 mmol) with vigorous stirring. The reaction mixture was then refluxed overnight. Completion of the reaction was confirmed by silica thin-layer chromatography (TLC) and IR spectroscopy. The solvent mixture was removed in vacuo and the residue was dissolved in CH2Cl2 and purified by silica column chromatography, eluting with hexane/CH2Cl2 (1
4 v/v) under an argon atmosphere were added catalytic amounts of CuI (5 mg), Pd(OAc)2 (6 mg), and PPh3 (45 mg). The solution was stirred for 30 min at room temperature followed by the addition of (trimethylsilyl)ethyne (0.67 mL, 4.79 mmol) with vigorous stirring. The reaction mixture was then refluxed overnight. Completion of the reaction was confirmed by silica thin-layer chromatography (TLC) and IR spectroscopy. The solvent mixture was removed in vacuo and the residue was dissolved in CH2Cl2 and purified by silica column chromatography, eluting with hexane/CH2Cl2 (1![[thin space (1/6-em)]](https://www.rsc.org/images/entities/char_2009.gif) :
:![[thin space (1/6-em)]](https://www.rsc.org/images/entities/char_2009.gif) 1 v/v) to obtain the title compound as an orange solid (0.58 g, 74.29% yield, mp = 120.5 °C). IR (cm−1): ν 2152 (C
1 v/v) to obtain the title compound as an orange solid (0.58 g, 74.29% yield, mp = 120.5 °C). IR (cm−1): ν 2152 (C![[triple bond, length as m-dash]](https://www.rsc.org/images/entities/char_e002.gif) C). 1H NMR (700 MHz, CDCl3): δ 7.49–7.45 (m, 4 Harom.), 7.44 (m, 4Harom.), 7.07 (s, 2Ha, HC
C). 1H NMR (700 MHz, CDCl3): δ 7.49–7.45 (m, 4 Harom.), 7.44 (m, 4Harom.), 7.07 (s, 2Ha, HC![[double bond, length as m-dash]](https://www.rsc.org/images/entities/char_e001.gif) CH), 0.26 (s, 18 Hb, SiMe3). 13C NMR (176 MHz, CDCl3): δ 137.17, 132.36, 128.75 (aromatic carbons), 126.37, 122.46 (C
CH), 0.26 (s, 18 Hb, SiMe3). 13C NMR (176 MHz, CDCl3): δ 137.17, 132.36, 128.75 (aromatic carbons), 126.37, 122.46 (C![[double bond, length as m-dash]](https://www.rsc.org/images/entities/char_e001.gif) C), 105.11, 95.37 (C
C), 105.11, 95.37 (C![[triple bond, length as m-dash]](https://www.rsc.org/images/entities/char_e002.gif) C), 0.14 (SiMe3). ESI-MS m/z 372.70 [M+]. Elemental Analysis: calculated; C, 77.35; H, 7.57; found; C, 77.31; H, 7.48.
C), 0.14 (SiMe3). ESI-MS m/z 372.70 [M+]. Elemental Analysis: calculated; C, 77.35; H, 7.57; found; C, 77.31; H, 7.48.
![[thin space (1/6-em)]](https://www.rsc.org/images/entities/char_2009.gif) :
:![[thin space (1/6-em)]](https://www.rsc.org/images/entities/char_2009.gif) 1 (v/v) THF/MeOH (20 mL) using aqueous KOH (0.15 g, 2.67 mmol). The reaction mixture was stirred at room temperature for 45 min, after which time TLC and IR revealed that all protected compound had been converted to the terminal dialkyne compound. The solvent mixture was then removed, and the residue dissolved in CH2Cl2 and purified by column chromatography on silica using hexane/CH2Cl2 (1
1 (v/v) THF/MeOH (20 mL) using aqueous KOH (0.15 g, 2.67 mmol). The reaction mixture was stirred at room temperature for 45 min, after which time TLC and IR revealed that all protected compound had been converted to the terminal dialkyne compound. The solvent mixture was then removed, and the residue dissolved in CH2Cl2 and purified by column chromatography on silica using hexane/CH2Cl2 (1![[thin space (1/6-em)]](https://www.rsc.org/images/entities/char_2009.gif) :
:![[thin space (1/6-em)]](https://www.rsc.org/images/entities/char_2009.gif) 1 v/v) as the eluent, affording 1b as a pale-orange powder (0.25 g, 91% yield). IR (cm−1): ν 2158 (C
1 v/v) as the eluent, affording 1b as a pale-orange powder (0.25 g, 91% yield). IR (cm−1): ν 2158 (C![[triple bond, length as m-dash]](https://www.rsc.org/images/entities/char_e002.gif) C), 3261 (C
C), 3261 (C![[triple bond, length as m-dash]](https://www.rsc.org/images/entities/char_e002.gif) C–H). 1H NMR (700 MHz, CDCl3) δ 7.49–7.46 (q, 8Harom.), 7.10 (s, 2Ha, HC
C–H). 1H NMR (700 MHz, CDCl3) δ 7.49–7.46 (q, 8Harom.), 7.10 (s, 2Ha, HC![[double bond, length as m-dash]](https://www.rsc.org/images/entities/char_e001.gif) CH), 3.14 (s, 2Hb, C
CH), 3.14 (s, 2Hb, C![[triple bond, length as m-dash]](https://www.rsc.org/images/entities/char_e002.gif) CH). 13C NMR (176 MHz, CDCl3): δ 137.43, 132.50, 128.96 (aromatic carbons), 126.37 (C
CH). 13C NMR (176 MHz, CDCl3): δ 137.43, 132.50, 128.96 (aromatic carbons), 126.37 (C![[double bond, length as m-dash]](https://www.rsc.org/images/entities/char_e001.gif) C), 121.38, 83.63 (C
C), 121.38, 83.63 (C![[triple bond, length as m-dash]](https://www.rsc.org/images/entities/char_e002.gif) C). ESI-MS m/z 229.10 [M+ + H]. Elemental Analysis: Calculated; C, 94.70; H, 5.30, found: C, 94.58; H, 5.26.
C). ESI-MS m/z 229.10 [M+ + H]. Elemental Analysis: Calculated; C, 94.70; H, 5.30, found: C, 94.58; H, 5.26.
![[thin space (1/6-em)]](https://www.rsc.org/images/entities/char_2009.gif) :
:![[thin space (1/6-em)]](https://www.rsc.org/images/entities/char_2009.gif) 4 v/v) under an argon atmosphere were added catalytic amounts of CuI (10 mg), Pd(OAc)2 (10 mg), and PPh3 (50 mg). The solution was stirred for 30 min at room temperature followed by the addition of (trimethylsilyl)ethyne (0.82 mL, 5.80 mmol) with vigorous stirring. The reaction mixture was then refluxed overnight. Completion of the reaction was confirmed by silica thin-layer chromatography (TLC) and IR spectroscopy. The solvent mixture was removed under reduced pressure. The solid residue was dissolved in CH2Cl2 and purified by silica column chromatography, eluting with hexane/CH2Cl2 (1
4 v/v) under an argon atmosphere were added catalytic amounts of CuI (10 mg), Pd(OAc)2 (10 mg), and PPh3 (50 mg). The solution was stirred for 30 min at room temperature followed by the addition of (trimethylsilyl)ethyne (0.82 mL, 5.80 mmol) with vigorous stirring. The reaction mixture was then refluxed overnight. Completion of the reaction was confirmed by silica thin-layer chromatography (TLC) and IR spectroscopy. The solvent mixture was removed under reduced pressure. The solid residue was dissolved in CH2Cl2 and purified by silica column chromatography, eluting with hexane/CH2Cl2 (1![[thin space (1/6-em)]](https://www.rsc.org/images/entities/char_2009.gif) :
:![[thin space (1/6-em)]](https://www.rsc.org/images/entities/char_2009.gif) 1 v/v) to obtain the title compound as an orange solid (0.83 g, 78% yield, m.p. = 117 °C). IR (cm−1): ν 2152 (C
1 v/v) to obtain the title compound as an orange solid (0.83 g, 78% yield, m.p. = 117 °C). IR (cm−1): ν 2152 (C![[triple bond, length as m-dash]](https://www.rsc.org/images/entities/char_e002.gif) C). 1H NMR (700 MHz, CDCl3): δ 7.51–7.50 (d, 2Harom., J = 7 Hz), 7.45 (dd, 4H arom., J = 7 Hz), 7.36 (t, 1Harom., J = 14, 7 Hz), 7.28 (d, 2Harom., J = 7 Hz), 7.13 (d, 2H(a), J = 14 Hz, HC
C). 1H NMR (700 MHz, CDCl3): δ 7.51–7.50 (d, 2Harom., J = 7 Hz), 7.45 (dd, 4H arom., J = 7 Hz), 7.36 (t, 1Harom., J = 14, 7 Hz), 7.28 (d, 2Harom., J = 7 Hz), 7.13 (d, 2H(a), J = 14 Hz, HC![[double bond, length as m-dash]](https://www.rsc.org/images/entities/char_e001.gif) CH), 0.26 (s, 9 Hb, SiMe3). 13C NMR (176 MHz, CDCl3): δ 137.46, 137.04, 132.30, 129.66, 128.73, 127.93, 127.89, 126.60, 126.51 (aromatic carbons), 126.26 (C
CH), 0.26 (s, 9 Hb, SiMe3). 13C NMR (176 MHz, CDCl3): δ 137.46, 137.04, 132.30, 129.66, 128.73, 127.93, 127.89, 126.60, 126.51 (aromatic carbons), 126.26 (C![[double bond, length as m-dash]](https://www.rsc.org/images/entities/char_e001.gif) C), 122.07, 105.18, 95.06 (C
C), 122.07, 105.18, 95.06 (C![[triple bond, length as m-dash]](https://www.rsc.org/images/entities/char_e002.gif) C), 0.15 (SiMe3). ESI-MS: m/z 276.50 [M+]. Elemental Analysis: calculated C, 82.55; H, 7.29; found; C, 82.48; H, 7.27.
C), 0.15 (SiMe3). ESI-MS: m/z 276.50 [M+]. Elemental Analysis: calculated C, 82.55; H, 7.29; found; C, 82.48; H, 7.27.
![[thin space (1/6-em)]](https://www.rsc.org/images/entities/char_2009.gif) :
:![[thin space (1/6-em)]](https://www.rsc.org/images/entities/char_2009.gif) 1 (v/v) THF/MeOH (20 mL) using aqueous KOH (0.16 g, 2.85 mmol). The reaction mixture was stirred at room temperature for 45 min, after which time TLC and IR revealed that all protected compound had been converted to the terminal dialkyne compound. The solvent mixture was then removed, and the residue dissolved in CH2Cl2 and purified by column chromatography on silica using hexane/CH2Cl2 (1
1 (v/v) THF/MeOH (20 mL) using aqueous KOH (0.16 g, 2.85 mmol). The reaction mixture was stirred at room temperature for 45 min, after which time TLC and IR revealed that all protected compound had been converted to the terminal dialkyne compound. The solvent mixture was then removed, and the residue dissolved in CH2Cl2 and purified by column chromatography on silica using hexane/CH2Cl2 (1![[thin space (1/6-em)]](https://www.rsc.org/images/entities/char_2009.gif) :
:![[thin space (1/6-em)]](https://www.rsc.org/images/entities/char_2009.gif) 1 v/v) as the eluent, affording 2b as a pale-orange powder (0.40 g, 83% yield). IR (cm−1): ν 2105 (C
1 v/v) as the eluent, affording 2b as a pale-orange powder (0.40 g, 83% yield). IR (cm−1): ν 2105 (C![[triple bond, length as m-dash]](https://www.rsc.org/images/entities/char_e002.gif) C), 3271 (C
C), 3271 (C![[triple bond, length as m-dash]](https://www.rsc.org/images/entities/char_e002.gif) C–H). 1H NMR (700 MHz, CDCl3) δ 7.52 (d, 2Harom., J = 7 Hz), 7.48 (dd, 4Harom., J = 7 Hz), 7.37 (t, 1Harom., J = 14, 7 Hz), 7.27 (t, 2Harom., J = 14, 7 Hz), 7.13 (d, 1Ha, J = 14 Hz, HC
C–H). 1H NMR (700 MHz, CDCl3) δ 7.52 (d, 2Harom., J = 7 Hz), 7.48 (dd, 4Harom., J = 7 Hz), 7.37 (t, 1Harom., J = 14, 7 Hz), 7.27 (t, 2Harom., J = 14, 7 Hz), 7.13 (d, 1Ha, J = 14 Hz, HC![[double bond, length as m-dash]](https://www.rsc.org/images/entities/char_e001.gif) CH), 7.08 (d, 1Ha, J = 14 Hz, HC
CH), 7.08 (d, 1Ha, J = 14 Hz, HC![[double bond, length as m-dash]](https://www.rsc.org/images/entities/char_e001.gif) CH), 3.13 (s, 1Hb, C
CH), 3.13 (s, 1Hb, C![[triple bond, length as m-dash]](https://www.rsc.org/images/entities/char_e002.gif) CH). 13C NMR (176 MHz, CDCl3): δ 137.83, 136.69, 132.46, 129.90, 128.74, 127.97, 127.80 (aromatic carbons), 126.64, 126.34 (C
CH). 13C NMR (176 MHz, CDCl3): δ 137.83, 136.69, 132.46, 129.90, 128.74, 127.97, 127.80 (aromatic carbons), 126.64, 126.34 (C![[double bond, length as m-dash]](https://www.rsc.org/images/entities/char_e001.gif) C), 121.01, 83.74 (C
C), 121.01, 83.74 (C![[triple bond, length as m-dash]](https://www.rsc.org/images/entities/char_e002.gif) C). ESI-MS: m/z 204.00 [M+]. Elemental Analysis: calculated; C, 94.08; H, 5.92, found; C, 93.99; H, 5.95.
C). ESI-MS: m/z 204.00 [M+]. Elemental Analysis: calculated; C, 94.08; H, 5.92, found; C, 93.99; H, 5.95.
Synthesis of Pt(II) di-ynes and poly-ynes
![[triple bond, length as m-dash]](https://www.rsc.org/images/entities/b_char_e002.gif) C–R–C
C–R–C![[triple bond, length as m-dash]](https://www.rsc.org/images/entities/b_char_e002.gif) CPt(PEt3)2(Ph)] (1M) (R = (E)-1,2-diphenylethene).
To a stirred mixture of 1b (0.15 g, 0.66 mmol) and trans-[Pt(PEt3)2PhCl] (0.71 g, 1.31 mmol) in iPr2NH (3 mL) and CH2Cl2 (20 mL) was added CuI (0.5 mg). The solution was stirred at room temperature under an argon atmosphere over a period of 18 h, after which all volatile components were removed under reduced pressure. The crude product was taken up in CH2Cl2 and passed through a silica column with 1
CPt(PEt3)2(Ph)] (1M) (R = (E)-1,2-diphenylethene).
To a stirred mixture of 1b (0.15 g, 0.66 mmol) and trans-[Pt(PEt3)2PhCl] (0.71 g, 1.31 mmol) in iPr2NH (3 mL) and CH2Cl2 (20 mL) was added CuI (0.5 mg). The solution was stirred at room temperature under an argon atmosphere over a period of 18 h, after which all volatile components were removed under reduced pressure. The crude product was taken up in CH2Cl2 and passed through a silica column with 1![[thin space (1/6-em)]](https://www.rsc.org/images/entities/char_2009.gif) :
:![[thin space (1/6-em)]](https://www.rsc.org/images/entities/char_2009.gif) 1 (v/v) hexane/CH2Cl2 as the eluent. The product was obtained as a yellow solid (0.19 g, 23% yield, mp = 185 °C). IR (cm−1): ν 2092 (C
1 (v/v) hexane/CH2Cl2 as the eluent. The product was obtained as a yellow solid (0.19 g, 23% yield, mp = 185 °C). IR (cm−1): ν 2092 (C![[triple bond, length as m-dash]](https://www.rsc.org/images/entities/char_e002.gif) C). 1H NMR (500 MHz, CDCl3) δ 7.31–7.23 (m, 7Harom), 7.23–7.16 (m, 5Harom.), 6.94–6.86 (m, 6Harom.), 6.74 (t, 2Ha), 1.69 (qt, J = 7.5, 3.4 Hz, 24Hb), 1.03 (p, J = 7.7 Hz, 36Hc). 13C NMR (176 MHz, CDCl3): δ 139.33, 134.09, 131.25, 128.66, 127.59, 127.43, 121.37 (aromatic carbons), 126.11 (C
C). 1H NMR (500 MHz, CDCl3) δ 7.31–7.23 (m, 7Harom), 7.23–7.16 (m, 5Harom.), 6.94–6.86 (m, 6Harom.), 6.74 (t, 2Ha), 1.69 (qt, J = 7.5, 3.4 Hz, 24Hb), 1.03 (p, J = 7.7 Hz, 36Hc). 13C NMR (176 MHz, CDCl3): δ 139.33, 134.09, 131.25, 128.66, 127.59, 127.43, 121.37 (aromatic carbons), 126.11 (C![[double bond, length as m-dash]](https://www.rsc.org/images/entities/char_e001.gif) C), 121.37 (C
C), 121.37 (C![[triple bond, length as m-dash]](https://www.rsc.org/images/entities/char_e002.gif) C), 15.37, 13.24, 5.10, 8.18 (alkyl carbons). ESI-MS m/z 1243.40 [M+]. Anal. Calcd: C, 52.17; H, 6.49; P, 9.97; found; C, 52.16; H, 6.44; P, 9.94.
C), 15.37, 13.24, 5.10, 8.18 (alkyl carbons). ESI-MS m/z 1243.40 [M+]. Anal. Calcd: C, 52.17; H, 6.49; P, 9.97; found; C, 52.16; H, 6.44; P, 9.94.
![[triple bond, length as m-dash]](https://www.rsc.org/images/entities/b_char_e002.gif) C-Pt(PBu3)2-C
C-Pt(PBu3)2-C![[triple bond, length as m-dash]](https://www.rsc.org/images/entities/b_char_e002.gif) C–R] (2M, R = (E)-1,2-diphenylethene).
A slightly modified literature procedure10 was followed using 2b (0.15 g, 0.73 mmol), trans-[(PBu3)2PtCl2] (0.25 g, 0.37 mmol), and CuI (1 mg). 2M was obtained as yellow crystals (0.27 g, 37% yield, m.p. = 242 °C). IR: ν cm−1 2093 (–C
C–R] (2M, R = (E)-1,2-diphenylethene).
A slightly modified literature procedure10 was followed using 2b (0.15 g, 0.73 mmol), trans-[(PBu3)2PtCl2] (0.25 g, 0.37 mmol), and CuI (1 mg). 2M was obtained as yellow crystals (0.27 g, 37% yield, m.p. = 242 °C). IR: ν cm−1 2093 (–C![[triple bond, length as m-dash]](https://www.rsc.org/images/entities/char_e002.gif) C–). 1H NMR (500 MHz, CDCl3) δ 7.51 (d, J = 7.5 Hz, 5Harom.), 7.46–7.32 (m, 8Harom.), 7.26 (t, J = 6.1 Hz, 5Harom.), 7.09 (s, 2Ha), 7.07 (s, 2Ha), 2.15 (td, J = 7.9, 3.8 Hz, 12Hb), 1.72–1.57 (m, 12Hc), 1.47 (h, J = 7.3 Hz, 12Hd), 0.95 (t, J = 7.3 Hz, 18He). 13C NMR (176 MHz, CDCl3): δ 131.16, 128.80, 127.60, 127.47, 126.50 (aromatic carbons), 126.27 (C
C–). 1H NMR (500 MHz, CDCl3) δ 7.51 (d, J = 7.5 Hz, 5Harom.), 7.46–7.32 (m, 8Harom.), 7.26 (t, J = 6.1 Hz, 5Harom.), 7.09 (s, 2Ha), 7.07 (s, 2Ha), 2.15 (td, J = 7.9, 3.8 Hz, 12Hb), 1.72–1.57 (m, 12Hc), 1.47 (h, J = 7.3 Hz, 12Hd), 0.95 (t, J = 7.3 Hz, 18He). 13C NMR (176 MHz, CDCl3): δ 131.16, 128.80, 127.60, 127.47, 126.50 (aromatic carbons), 126.27 (C![[double bond, length as m-dash]](https://www.rsc.org/images/entities/char_e001.gif) C), 109.43 (C
C), 109.43 (C![[triple bond, length as m-dash]](https://www.rsc.org/images/entities/char_e002.gif) C), 26.53, 26.51, 24.62, 24.56, 24.51, 24.07, 13.98 (alkyl carbons). ESI-MS: m/z 1006 [M]+. Anal. Calcd: C, 66.84; H, 7.61; P, 6.16; found; C, 66.77; H, 7.60; P, 6.14.
C), 26.53, 26.51, 24.62, 24.56, 24.51, 24.07, 13.98 (alkyl carbons). ESI-MS: m/z 1006 [M]+. Anal. Calcd: C, 66.84; H, 7.61; P, 6.16; found; C, 66.77; H, 7.60; P, 6.14.
![[triple bond, length as m-dash]](https://www.rsc.org/images/entities/b_char_e002.gif) C–R–C
C–R–C![[triple bond, length as m-dash]](https://www.rsc.org/images/entities/b_char_e002.gif) C–]n (1P, R = (E)-1,2-diphenylethene).
To a stirred mixture of 1b (0.10 g, 0.44 mmol) and trans-[(PnBu3)2PtCl2] (0.29 g, 0.44 mmol) in iPr2NH (10 mL) and CH2Cl2 (10 mL) was added CuI (1 mg) under argon. After stirring at room temperature overnight, the solvent mixture was removed under reduced pressure. The solid residue was dissolved in CH2Cl2 and filtered through a short alumina column to remove ionic impurities and residual catalysts. After removal of the solvent, the crude product was purified by precipitation from MeOH in CH2Cl2. Subsequent washing with hexane and drying under reduced pressure gave yellow powders (0.38 g, mp = 285 °C). IR: ν cm−1 2093 (–C
C–]n (1P, R = (E)-1,2-diphenylethene).
To a stirred mixture of 1b (0.10 g, 0.44 mmol) and trans-[(PnBu3)2PtCl2] (0.29 g, 0.44 mmol) in iPr2NH (10 mL) and CH2Cl2 (10 mL) was added CuI (1 mg) under argon. After stirring at room temperature overnight, the solvent mixture was removed under reduced pressure. The solid residue was dissolved in CH2Cl2 and filtered through a short alumina column to remove ionic impurities and residual catalysts. After removal of the solvent, the crude product was purified by precipitation from MeOH in CH2Cl2. Subsequent washing with hexane and drying under reduced pressure gave yellow powders (0.38 g, mp = 285 °C). IR: ν cm−1 2093 (–C![[triple bond, length as m-dash]](https://www.rsc.org/images/entities/char_e002.gif) C–). 1H NMR (500 MHz, CDCl3) δ 7.34–7.22 (m, 6Harom.), 7.21–7.10 (m, 2Harom.), 6.92 (s, 2Ha), 2.22–2.00 (m, 12Hb), 1.54 (ddp, J = 12.0, 8.2, 3.8 Hz, 12Hc), 1.38 (h, J = 7.4 Hz, 12Hd), 0.86 (t, J = 7.0 Hz, 18He). 13C NMR (176 MHz, CDCl3): δ 131.17, 127.66 (aromatic carbons), 126.11 (C
C–). 1H NMR (500 MHz, CDCl3) δ 7.34–7.22 (m, 6Harom.), 7.21–7.10 (m, 2Harom.), 6.92 (s, 2Ha), 2.22–2.00 (m, 12Hb), 1.54 (ddp, J = 12.0, 8.2, 3.8 Hz, 12Hc), 1.38 (h, J = 7.4 Hz, 12Hd), 0.86 (t, J = 7.0 Hz, 18He). 13C NMR (176 MHz, CDCl3): δ 131.17, 127.66 (aromatic carbons), 126.11 (C![[double bond, length as m-dash]](https://www.rsc.org/images/entities/char_e001.gif) C), 110.26 (C
C), 110.26 (C![[triple bond, length as m-dash]](https://www.rsc.org/images/entities/char_e002.gif) C), 26.62, 26.51, 26.44, 24.61, 24.56, 24.50, 24.19, 24.05, 23.91, 13.93 (alkyl carbons). GPC (THF):
C), 26.62, 26.51, 26.44, 24.61, 24.56, 24.50, 24.19, 24.05, 23.91, 13.93 (alkyl carbons). GPC (THF): ![[M with combining macron]](https://www.rsc.org/images/entities/i_char_004d_0304.gif) nn = 22
nn = 22![[thin space (1/6-em)]](https://www.rsc.org/images/entities/char_2009.gif) 632 g mol−1 (n = 48);
632 g mol−1 (n = 48); ![[M with combining macron]](https://www.rsc.org/images/entities/i_char_004d_0304.gif) w = 39
w = 39![[thin space (1/6-em)]](https://www.rsc.org/images/entities/char_2009.gif) 568 g mol−1; PDI = 1.7. Anal. Calcd: C, 57.90; H, 8.30; P, 8.14; found; C, 57.88; H, 8.27; P, 8.12.
568 g mol−1; PDI = 1.7. Anal. Calcd: C, 57.90; H, 8.30; P, 8.14; found; C, 57.88; H, 8.27; P, 8.12.
Computational modelling
Density Functional (DFT) calculations were carried out for cis- and trans-isomers of 1M and 2M using the B3LYP hybrid functional as implemented by Gaussian 09.54 The 6-31G(d,p) basis set was used for main group elements, while the Def2SVP basis set, with corresponding effective-core pseudopotential, was used for Pt. Geometry optimizations for the trans isomers where initiated from structures extracted from the corresponding cif files, while initial structures for the cis isomers were created by manual rotation of the stilbene double bond(s) – in the case of 2M, the cis isomer modelled was that with both of the stilbene bonds having a cis configuration. In all cases geometry optimization was followed by frequency calculations to confirm the nature of the stationary point. In addition to gas-phase calculations, the effect of the solvent (dichloromethane, ε = 8.93) was approximated using the PCM. GaussView 555 was used to create input files and for visualization of results.Excitation energies were calculated using the TD-DFT method at the ground state optimized geometry, with, and without, the inclusion of the PCM. The 100 lowest-energy single states were calculated, and the excitation energies and oscillator strengths used to simulate the electronic absorption spectra. GaussSum 356 was used to create the convoluted spectra using gaussian curves with a FWHM of 3000 cm−1, and to extract the orbital contribution for each transition.
Single-crystal X-ray structure determination
The single-crystal X-ray structure determination was performed at room temperature on a Stoe IPS II diffractometer using monochromatic Mo-Kα radiation (λ = 0.71073 Å). A multiscan absorption correction was applied. The data reduction, including an empirical absorption correction using spherical harmonics, was implemented in LANA. The crystal structures were solved by direct methods using the online version of WinGX57 and then refined by full-matrix least-squares (SHELXL-2014) on F2.58,59 The non-hydrogen atoms were refined anisotropically. One of the triethylphosphine ligands was severely disordered and the PEt3 fragment was refined over two sites with the total occupancy set at unity, and the C–C bond lengths and angles were restrained to be similar to those found in the ordered ethyl groups. All of the hydrogen atoms were positioned geometrically in idealized positions and refined with the riding model approximation, with Uiso(H) = 1.2 or 1.5Ueq(C). The molecular graphics the program MERCURY from the CSD package was used.60Data-access statement
The crystal structure of 1M is available under the CCDC reference number 2035894.† Raw data from spectroscopic characterization and computational modelling are available from the authors on request.Conflicts of interest
The authors have no conflicts of interest to declare.Acknowledgements
IJAB thanks the Ministry of Education (MOE), Sultanate of Oman for a Ph.D. scholarship. MSK thanks The BP Oman Research Grant (EG/SQU-BP/SCI/CHEM/19/01) and The Ministry of Higher Education, Research and Innovation (MoHERI), Oman (Grant: RC/RG-SCI/CHEM/20/01) for funding. PRR is grateful to the Engineering and Physical Sciences Research Council (EPSRC) for continued funding (Grant no. EP/K004956/1).References
- H. Li and D.-H. Qu, Sci. China: Chem., 2015, 58, 916–921 CrossRef CAS.
- A. G. Martynov, E. A. Safonova, A. Y. Tsivadze and Y. G. Gorbunova, Coord. Chem. Rev., 2019, 387, 325–347 CrossRef CAS.
- J. L. Zhang, J. Q. Zhong, J. D. Lin, W. P. Hu, K. Wu, G. Q. Xu, A. T. S. Wee and W. Chen, Chem. Soc. Rev., 2015, 44, 2998–3022 RSC.
- B. K. Pathem, S. A. Claridge, Y. B. Zheng and P. S. Weiss, Annu. Rev. Phys. Chem., 2013, 64, 605–630 CrossRef CAS.
- H. Tian and S. Yang, Chem. Soc. Rev., 2004, 33, 85–97 RSC.
- T. Niazov, B. Shlyahovsky and I. Willner, J. Am. Chem. Soc., 2007, 129, 6374–6375 CrossRef CAS.
- M. Izquierdo-Serra, M. Gascón-Moya, J. J. Hirtz, S. Pittolo, K. E. Poskanzer, È. Ferrer, R. Alibés, F. Busqué, R. Yuste, J. Hernando and P. Gorostiza, J. Am. Chem. Soc., 2014, 136, 8693–8701 CrossRef CAS.
- H. Rau, in Photoreactive Organic Thin Films, ed. Z. Sekkat and W. Knoll, Academic Press, San Diego, 2002, pp. 3–47 Search PubMed.
- D. H. Waldeck, Chem. Rev., 1991, 91, 415–436 CrossRef CAS.
- K. Haskins-Glusac, I. Ghiviriga, K. A. Abboud and K. S. Schanze, J. Phys. Chem. B, 2004, 108, 4969–4978 CrossRef CAS.
- R. S. Price, G. Dubinina, G. Wicks, M. Drobizhev, A. Rebane and K. S. Schanze, ACS Appl. Mater. Interfaces, 2015, 7, 10795–10805 CrossRef CAS.
- M. Irie and M. Mohri, J. Org. Chem., 1988, 53, 803–808 CrossRef CAS.
- I. J. Al-Busaidi, A. Haque, N. K. Al Rasbi and M. S. Khan, Synth. Met., 2019, 257, 116189 CrossRef CAS.
- C.-L. Ho, Z.-Q. Yu and W.-Y. Wong, Chem. Soc. Rev., 2016, 45, 5264–5295 RSC.
- W. Wang and H.-B. Yang, Chem. Commun., 2014, 50, 5171–5186 RSC.
- W. Y. Wong and C. L. Ho, Coord. Chem. Rev., 2006, 250, 2627–2690 CrossRef CAS.
- W.-Y. Wong, X.-Z. Wang, Z. He, A. B. Djurisic, C.-T. Yip, K.-Y. Cheung, H. Wang, C. S. K. Mak and W.-K. Chan, Nat. Mater., 2007, 6, 521–527 CrossRef CAS.
- J. Xiang, C.-L. Ho and W.-Y. Wong, Polym. Chem., 2015, 6, 6905–6930 RSC.
- X. L. Yang, G. J. Zhou and W. Y. Wong, Chem. Soc. Rev., 2015, 44, 8484–8575 RSC.
- M. Jayapal, A. Haque, I. J. Al-Busaidi, R. Al-Balushi, M. K. Al-Suti, S. M. Islam, M. S. Khan and J. J. Dittmer, Curr. Org. Chem., 2017, 21, 2017–2027 CrossRef CAS.
- A. Haque, R. A. Al-Balushi, I. J. Al-Busaidi, M. S. Khan and P. R. Raithby, Chem. Rev., 2018, 118, 8474–8597 CrossRef CAS.
- A. Haque, L. Xu, R. A. Al-Balushi, M. K. Al-Suti, R. Ilmi, Z. Guo, M. S. Khan, W.-Y. Wong and P. R. Raithby, Chem. Soc. Rev., 2019, 48, 5547–5563 RSC.
- A. Haque, R. A. Al-Balushi and M. S. Khan, J. Organomet. Chem., 2019, 897, 95–106 CrossRef CAS.
- Z. Li, E. Badaeva, D. Zhou, J. Bjorgaard, K. D. Glusac, S. Killina and W. Sun, J. Phys. Chem. A, 2012, 116, 4878–4889 CrossRef CAS.
- A. Haque, R. Al-Balushi, I. J. Al-Busaidi, N. K. Al-Rasbi, S. Al-Bahri, M. K. Al-Suti, M. S. Khan, O. K. Abou-Zied, J. M. Skelton and P. R. Raithby, Inorg. Chem., 2021, 60, 745–759 CrossRef CAS.
- S. Al-Busaidi, R. Ilmi, J. D. Dutra, W. F. Oliveira, A. Haque, N. K. Al Rasbi, F. Marken, P. R. Raithby and M. S. Khan, Dalton Trans., 2021 10.1039/D0DT04198J.
- R. A. Al-Balushi, A. Haque, M. Jayapal, M. K. Al-Suti, J. Husband, M. S. Khan, J. M. Skelton, K. C. Molloy and P. R. Raithby, Inorg. Chem., 2016, 55, 10955–10967 CrossRef CAS.
- R. A. Al-Balushi, A. Haque, M. Jayapal, M. K. Al-Suti, J. Husband, M. S. Khan, O. F. Koentjoro, K. C. Molloy, J. M. Skelton and P. R. Raithby, Inorg. Chem., 2016, 55, 6465–6480 CrossRef CAS.
- M. S. Khan, M. R. A. Al-Mandhary, M. K. Al-Suti, N. Feeder, S. Nahar, A. Köhler, R. H. Friend, P. J. Wilson and P. R. Raithby, Dalton Trans., 2002, 2441–2448 RSC.
- J. Manna, K. D. John and M. D. Hopkins, in Adv. Organomet. Chem, ed. F. G. A. Stone and R. West, Academic Press, 1995, vol. 38, pp. 79–154 Search PubMed.
- I. Fleming and D. H. Williams, Spectroscopic methods in organic chemistry, Springer, 1966 Search PubMed.
- R. Adhikary, C. A. Barnes, R. L. Trampel, S. J. Wallace, T. W. Kee and J. W. Petrich, J. Phys. Chem. B, 2011, 115, 10707–10714 CrossRef CAS.
- M. Edgar, B. C. Percival, M. Gibson, J. Masania, K. Beresford, P. B. Wilson and M. Grootveld, J. Chem. Educ., 2019, 96, 1938–1947 CrossRef CAS.
- M. S. Khan, M. K. Al-Suti, H. H. Shah, S. Al-Humaimi, F. R. Al-Battashi, J. K. Bjernemose, L. Male, P. R. Raithby, N. Zhang, A. Köhler and J. E. Warren, Dalton Trans., 2011, 40, 10174–10183 RSC.
- M. S. Khan, M. R. A. Al-Mandhary, M. K. Al-Suti, F. R. Al-Battashi, S. Al-Saadi, B. Ahrens, J. K. Bjernemose, M. F. Mahon, P. R. Raithby, M. Younus, N. Chawdhury, A. Köhler, E. A. Marseglia, E. Tedesco, N. Feeder and S. J. Teat, Dalton Trans., 2004, 2377–2385, 10.1039/B405070C.
- M. S. Khan, M. R. A. Al-Mandhary, M. K. Al-Suti, T. C. Corcoran, Y. Al-Mahrooqi, J. P. Attfield, N. Feeder, W. I. F. David, K. Shankland, R. H. Friend, A. Köhler, E. A. Marseglia, E. Tedesco, C. C. Tang, P. R. Raithby, J. C. Collings, K. P. Roscoe, A. S. Batsanov, L. M. Stimson and T. B. Marder, New J. Chem., 2003, 27, 140–149 RSC.
- M. S. Khan, M. R. A. Al-Mandhary, M. K. Al-Suti, A. K. Hisahm, P. R. Raithby, B. Ahrens, M. F. Mahon, L. Male, E. A. Marseglia, E. Tedesco, R. H. Friend, A. Köhler, N. Feeder and S. J. Teat, Dalton Trans., 2002, 1358–1368, 10.1039/B110658A.
- R. H. Dyck and D. S. McClure, J. Chem. Phys., 1962, 36, 2326–2345 CrossRef CAS.
- A. B. Myers and R. A. Mathies, J. Chem. Phys., 1984, 81, 1552–1558 CrossRef CAS.
- M. Linseis, S. Záliš, M. Zabel and R. F. Winter, J. Am. Chem. Soc., 2012, 134, 16671–16692 CrossRef CAS.
- K. N. Gherab, R. Gatri, Z. Hank, B. Dick, R.-J. Kutta, R. Winter, J. Luc, B. Sahraoui and J.-L. Fillaut, J. Mater. Chem., 2010, 20, 2858–2864 RSC.
- F. Guo, Y.-G. Kim, J. R. Reynolds and K. S. Schanze, ChemComm, 2006, 1887–1889, 10.1039/B516086C.
- C. J. Otolski, A. Mohan Raj, G. Sharma, R. Prabhakar, V. Ramamurthy and C. G. Elles, J. Phys. Chem. A, 2019, 123, 5061–5071 CrossRef CAS.
- S. Wang, W. J. Oldham, R. A. Hudack and G. C. Bazan, J. Am. Chem. Soc., 2000, 122, 5695–5709 CrossRef CAS.
- Y. Kanda, Memoirs of the Faculty of Science, Kyusyu University. Series C, Chemistry, 1950, vol. 1, pp. 179–181 Search PubMed.
- S. Hiroshi, Bull. Chem. Soc. Jpn., 1960, 33, 396–405 CrossRef.
- S. Hiroshi, Bull. Chem. Soc. Jpn., 1959, 32, 1340–1350 CrossRef.
- M. Calvin and H. W. Alter, J. Chem. Phys., 1951, 19, 768–770 CrossRef CAS.
- A. W. Adamson, A. Vogler, H. Kunkely and R. Wachter, J. Am. Chem. Soc., 1978, 100, 1298–1300 CrossRef CAS.
- W. L. Armarego, Purification of laboratory chemicals, Butterworth-Heinemann, 2017 Search PubMed.
- L. A. T. George, B. Kauffman and J. E. Huheey, in Inorg. Synth, ed. J. Kleinberg, 2007, pp. 245–249, DOI:10.1002/9780470132388.ch64.
- J. Lakowicz, Principles of fluorescence spectroscopy, New York, 2006, pp. 158–204 Search PubMed.
- M. Lovelle, T. Mach, K. R. Mahendran, H. Weingart, M. Winterhalter and P. Gameiro, Phys. Chem. Chem. Phys., 2011, 13, 1521–1530 RSC.
- M. Frisch, G. Trucks, H. Schlegel, G. Scuseria, M. Robb, J. Cheeseman, G. Scalmani, V. Barone, B. Mennucci and G. Petersson, See also: URL: http://www.gaussian.com, 2009.
- R. Dennington, T. Keith and J. Millam, GaussView, Version 5, Semichem Inc., Shawnee Mission KS, 2009 Search PubMed.
- N. M. O'boyle, A. L. Tenderholt and K. M. Langner, J. Comput. Chem., 2008, 29, 839–845 CrossRef.
- L. Farrugia, J. Appl. Crystallogr., 1999, 32, 837–838 CrossRef CAS.
- G. M. Sheldrick, Acta Crystallogr., Sect. C: Struct. Chem., 2015, 71, 3–8 Search PubMed.
- G. M. Sheldrick, Acta Crystallogr., Sect. A: Found. Adv., 2015, 71, 3–8 CrossRef.
- C. F. Macrae, P. R. Edgington, P. McCabe, E. Pidcock, G. P. Shields, R. Taylor, M. Towler and J. Streek, J. Appl. Crystallogr., 2006, 39, 453–457 CrossRef CAS.
Footnote |
| † Electronic supplementary information (ESI) available: Crystallographic data for 1M; absorption spectra of mono- and dibromo stilbene, absorption and emission spectra of azobenzene systems, photo-isomerization results, simulated, convoluted and line spectra of the complexes. CCDC 2035894 (1M). For ESI and crystallographic data in CIF or other electronic format see DOI: 10.1039/d0dt03502e |
| This journal is © The Royal Society of Chemistry 2021 |

