 Open Access Article
Modeling the effect of reduced traffic due to COVID-19 measures on air quality using a chemical transport model: impacts on the Po Valley and the Swiss Plateau regions†
Giancarlo
Ciarelli
*a,
Jianhui
Jiang
 *bc,
Imad
El Haddad
 c,
Alessandro
Bigi
 d,
Sebnem
Aksoyoglu
c,
André S. H.
Prévôt
c,
Angela
Marinoni
e,
Jiali
Shen
a,
Chao
Yan
a and
Federico
Bianchi
 a
a
aInstitute for Atmospheric and Earth System Research/Physics, Faculty of Science, University of Helsinki, Finland. E-mail: giancarlo.ciarelli@helsinki.fi
bShanghai Key Lab for Urban Ecological Processes and Eco-Restoration, School of Ecological and Environmental Sciences, East China Normal University, 200241 Shanghai, China. E-mail: jhjiang@des.ecnu.edu.cn
cLaboratory of Atmospheric Chemistry, Paul Scherrer Institute, 5232 Villigen PSI, Switzerland
dDepartment of Engineering “Enzo Ferrari”, Università di Modena e Reggio Emilia, Modena, Italy
eInstitute of Atmospheric Sciences and Climate, National Research Council of Italy, Bologna, Italy
First published on 12th July 2021
Abstract
The spread of COVID-19 has posed serious challenges for the global communities. To reduce the circulation of the infection, governmental bodies have imposed different lockdown measures at various levels of complexity and duration. As a result, a substantial reduction in mobility might have important, yet unknown, implications for air quality. In this study, we applied the Comprehensive Air quality Model with eXtensions (CAMx) to investigate potential changes in air quality and its chemical composition over northern Italy and Switzerland during periods when lockdown measures were enforced. Our results indicated that lockdown measures reduced nitrogen dioxide (NO2) air concentrations by up to 46% and 25% in the Po Valley and Swiss Plateau regions, respectively, whereas fine particulate matter (PM2.5) air concentrations were reduced only by up to 10% and 6%. This highlights the importance of other emission categories other than traffic for the total PM2.5 levels. The analysis of the PM2.5 components indicated that elemental carbon (EC) and particulate nitrate (NO3−) were the species most affected by the lockdown measures, whereas a mild increase in the secondary organic aerosol (SOA) concentrations occurred in the Po Valley, and specifically over the metropolitan area of Milan. Our results indicated that an increase in the oxidation capacity of the atmosphere, i.e. in the ˙OH and ˙NO3 radicals, was mainly responsible for the mild increase in SOA concentrations.
1. Introduction
The spread of the new coronavirus SARS-CoV-2 leading to COVID-19 has posed serious threats for global communities around the world.1–3 In December 2019, infections were detected in Wuhan (China). As of the 15th of October, 2020 more than 31 million cases worldwide and 1 million deaths linked to COVID-19 were registered.4As a response to this emergency, governmental bodies have enforced specific actions and recommendations to prevent the spread of the disease.5 In Europe, Italy was the first country to enforce a progressive set of lockdown measures aimed at increasing social distancing. On 21 February 2020, first lockdowns were enforced in the provinces of Lodi (Lombardy) and Padua (Veneto). These preliminary measures were later extended to the entire Lombardy on 8 March and to the entire nation on 9 March 2020. This has been followed by other European countries in the following weeks of March. As a result, population mobility, outdoor activities and gatherings were largely reduced.
Among all the economic sectors, the transportation of goods, commodities and people were the ones most affected by the restrictions. The transportation sector, i.e. on-road transportation, is the most important source of nitrogen oxides (NOx) emissions in Europe.6 NOx is deeply rooted in the atmospheric photochemical cycles, affecting the formation of secondary species such as ozone (O3) and secondary aerosols. The reactions leading to the formation of such species are complex, highly nonlinear, and involves numerous cycles and re-formation of several chemical species.7
After being emitted, nitrogen oxide (NO) rapidly reacts with the hydroperoxyl radical (˙HO2) to yield the hydroxyl radical (˙OH) and nitrogen dioxide (NO2). NO2 reacts with OH to form nitric acid (HNO3), which in the presence of ammonia (NH3), produces particulate nitrate. NOx also plays an important role during nighttime periods. Especially in urban areas, it depletes the O3 formed during intense photochemical activity and favors the formation of the nitrate radical (i.e. NO2 + O3 → ˙NO3), which additionally reacts with NO2 yielding dinitrogen pentoxide (N2O5) and, in presence of H2O, leading to the heterogeneous formation of HNO3. Additionally, it can also react with various volatile organic compounds (VOCs) (e.g. aromatics and terpenes), promoting the formation of secondary organic aerosols (SOA).
Very recent studies performed in China have investigated the potential effects of the drastic reduction in NOx emissions following the enforcement of lockdown measures. Le et al.,8 investigated the changes in PM2.5, NO2, SO2, and O3 concentrations over eastern China during the lockdown (i.e. from 23 January to 13 February 2020) using air pollutants satellite and climatological data for the 2015–2019 years. Additionally, detailed chemical transport model (CTM) simulations were performed with the WRF-Chem model. Compared to climatological satellites retrievals of NO2, their study indicated a reduction of about 72% over eastern China and up to about 93% in Wuhan at the peak of the infections. PM2.5 concentrations were reduced by about 32 and 37%, depending on the climatological scenario, whereas O3 increased by about 25% due to the nonlinear chemistry of O3. Over northern China, however, their analysis indicated a substantial increase in PM2.5 concentrations. The latter was mainly attributed to the unusual higher relative humidity compared to climatological data and to the increased oxidation capacity of atmosphere which enhanced particulate sulfate (SO42−) as well as secondary organic aerosol (SOA) production. Similarly, Huang et al.,9 conducted air quality modeling simulations over eastern China using the WRF-Chem model during the Chinese lockdown periods applying several levels of NOx reduction (i.e. between 10–90%). Their results indicated that such rapid decrease in NOx emissions can lead to an increase in nighttime O3 and ˙NO3 concentrations, and therefore enhancing the overall oxidation capacity of the atmosphere.
In this study we conducted explicit chemical transport model simulations for northern Italy (Po Valley) and Switzerland (Swiss Plateau), to investigate the impact of COVID-19 lockdown measures on several pollutants.
2. Method
2.1. Model description
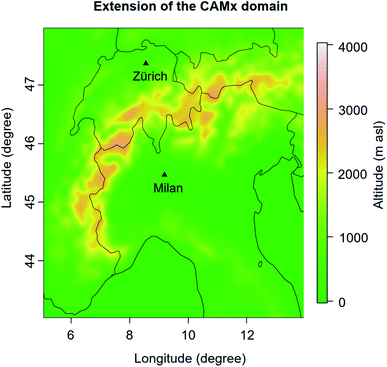
Model simulations covering northern Italy and Switzerland were performed using the regional air quality model CAMx (Comprehensive Air quality Model with eXtensions) version 6.50![[thin space (1/6-em)]](https://www.rsc.org/images/entities/char_2009.gif) 10 for a period between 1 February 2020 and 27 April 2020. The first two weeks of the simulations were used as spin-up period. The model domain covers an area from 5.06°W to 13.93°E and from 43.03°N to 47.96°N with a horizontal resolution of 0.125° and 0.0625° (Fig. 1). The gas-phase chemical mechanism was the Carbon Bond 6 Revision 2 (CB6r2).11 The two-sectional method for the particle size was selected to calculate the aerosol concentrations in the fine fraction (PM2.5). Organic aerosols were calculated using the secondary organic aerosol chemistry/partitioning (SOAP2.1) module10 and the ISORROPIA thermodynamic model was used for the partitioning of inorganic aerosol components.12 Anthropogenic SOA gas-phase precursors include benzene, toluene, xylene and intermediate-volatility organic compounds (IVOCs), while biogenic SOA precursors consist of isoprene, monoterpenes and sesquiterpenes. Each gas-phase precursor produces three classes of condensable gases species: more-volatile, less-volatile and non-volatile products. The more-volatile and less-volatile classes of condensable gases from the anthropogenic sources (i.e. benzene, toluene, xylene and IVOC) have a saturation concentration (C*) of 14 and 0.31 μg m−3 (at 300 K) and an enthalpy of vaporization of 116 and 147 kJ mol−1, respectively. Biogenic precursors, i.e. isoprene, monoterpenes and sesquiterpenes have a C* of 26 and 0.45 μg m−3 (at 300 K) and an enthalpy of vaporization of 118 and 123 kJ mol−1, respectively. Aerosol yield data are based on corrected vapor wall losses experiments performed in smog chamber13,14 except for monoterpene yields, which are based on Pye et al.15,16 Dry and wet deposition of gas phase and particulate species were calculated using the Zhang scheme.10 The meteorological parameters were produced with the Weather Research and Forecasting model (WRF, version 4.1.2;17), based on the European Centre for Medium-range Weather Forecasts (ECMWF) ERA5 global re-analysis data. Boundary conditions fields were produced from the Whole Atmosphere Community Climate Model (WACCM).18 As the influence of lockdown was not considered in the WACCM dataset, the O3 in the boundary were scaled based on the surface measurements available from the European Environmental Agency (EEA).
10 for a period between 1 February 2020 and 27 April 2020. The first two weeks of the simulations were used as spin-up period. The model domain covers an area from 5.06°W to 13.93°E and from 43.03°N to 47.96°N with a horizontal resolution of 0.125° and 0.0625° (Fig. 1). The gas-phase chemical mechanism was the Carbon Bond 6 Revision 2 (CB6r2).11 The two-sectional method for the particle size was selected to calculate the aerosol concentrations in the fine fraction (PM2.5). Organic aerosols were calculated using the secondary organic aerosol chemistry/partitioning (SOAP2.1) module10 and the ISORROPIA thermodynamic model was used for the partitioning of inorganic aerosol components.12 Anthropogenic SOA gas-phase precursors include benzene, toluene, xylene and intermediate-volatility organic compounds (IVOCs), while biogenic SOA precursors consist of isoprene, monoterpenes and sesquiterpenes. Each gas-phase precursor produces three classes of condensable gases species: more-volatile, less-volatile and non-volatile products. The more-volatile and less-volatile classes of condensable gases from the anthropogenic sources (i.e. benzene, toluene, xylene and IVOC) have a saturation concentration (C*) of 14 and 0.31 μg m−3 (at 300 K) and an enthalpy of vaporization of 116 and 147 kJ mol−1, respectively. Biogenic precursors, i.e. isoprene, monoterpenes and sesquiterpenes have a C* of 26 and 0.45 μg m−3 (at 300 K) and an enthalpy of vaporization of 118 and 123 kJ mol−1, respectively. Aerosol yield data are based on corrected vapor wall losses experiments performed in smog chamber13,14 except for monoterpene yields, which are based on Pye et al.15,16 Dry and wet deposition of gas phase and particulate species were calculated using the Zhang scheme.10 The meteorological parameters were produced with the Weather Research and Forecasting model (WRF, version 4.1.2;17), based on the European Centre for Medium-range Weather Forecasts (ECMWF) ERA5 global re-analysis data. Boundary conditions fields were produced from the Whole Atmosphere Community Climate Model (WACCM).18 As the influence of lockdown was not considered in the WACCM dataset, the O3 in the boundary were scaled based on the surface measurements available from the European Environmental Agency (EEA).
The ozone column densities were prepared using the Total Ozone Mapping Spectrometer (TOMS) data from NASA, and photolysis rates were calculated using the Tropospheric Ultraviolet and Visible (TUV) Radiation Model version 4.8.
The Chemical Process Analysis (CPA) tool was enabled in the CAMx simulations in order to track the contributions from individual chemical processes and tagged chemical reactions operating within the model.19
2.2. Emissions data
The anthropogenic emissions were prepared based on the high-resolution European emission inventory TNO-MACC (Monitoring Atmospheric Composition and Climate)-III, which is an extension of the TNO-MACC-II.20 Biogenic emissions (isoprene, monoterpenes, sesquiterpenes, soil NO) were estimated by the PSI model developed at the Laboratory of Atmospheric Chemistry at the Paul Scherrer Institute21 and further improved by Oderbolz et al.,22 and Jiang et al.23The annual emissions of non-methane volatile organic compounds (NMVOCs), SO2, NOx, carbon monoxide (CO), NH3, coarse particulate matter (PM10) and PM2.5 were hourly distributed using the TNO temporal variation profiles. Two emission scenarios were prepared to retrieve the impacts of lockdown measures on pollutant levels and composition. This includes a business as usual scenario, referred to as CAMx-BAU, based on the standard TNO-MACC emission inventories and a rescaled emission scenario, referred to as CAMx-LOCK, where emissions from the road transportation sectors were reduced according to the mobility data available from two different sources. For Italy, emissions were scaled based on the weekly change of heavy and light duty vehicle-fluxes as available in the PrepAIR report (https://www.lifeprepair.eu/wp-content/uploads/2020/06/COVIDQA-Prepair-19Giugno2020_final.pdf). In general, light duty traffic fluxes were reported to have been reduced between 20 and 80% following the gradual progression of lockdown measures, whereas heavy duty traffic declined by up to 50%. For the neighboring countries we used the mobility trends report made available by Apple Maps (https://www.apple.com/covid19/mobility) and averaged to a weekly time-step in order to be consistent with the Italian data. For Italy, the scaling factor (E/E0) for each week was calculated as:
| E0 = ∑(EFi × Ni × Mi) | (1) |
| E/E0 = ∑(ri × EFi × Ni × Mi)/∑(EFi × Ni × Mi) | (2) |
 | (3) |
For the other neighboring countries, the scaling factor during week 1 to 4 of February eqn (1), and the values afterwards were calculated by dividing the weekly mobility data with mobility in week 4 of February. The emissions from gasoline and diesel vehicles used the same scaling factor for these countries. The scaling factors for each country can be found in Fig, S1.† The remaining emission categories, e.g. agricultural, industrial, and residential heating activity, were not altered in our analysis since detailed data were not available at the time the sensitivity tests were prepared. Moreover, recent study indicates traffic-related emissions are the main factors influencing NO2 concentrations in Italy during lockdown periods. A study from Guevara et al.,24 based on the Copernicus Atmosphere Monitoring Service (CAMS) emission dataset (referred to as CAMS-REG-AP), tested two different lockdown scenarios: a first one where only traffic-related emissions where reduced, and a second one where all the remaining emission sectors were also reduced. The authors found that the reductions in NO2 concentrations (compared to a baseline scenario with no emissions reductions) were almost identical in the two scenarios for Italy (e.g. around 54 and 56% reduction over the Milan area, in the covid19_traffic and covid19_all scenarios, respectively). Therefore, our analysis should be interpreted as the impact on air quality due to lockdown measures that only affected the on-road transportation sector (i.e. SNAP7 in the Standard Nomenclature for Air Pollution).
The impact of lockdown, i.e. changes in NO2, O3, PM2.5 (and its components) concentrations, as well as changes in tagged chemical reactions, are presented throughout the text as the difference between the CAMx-LOCK and CAMx-BAU scenarios for the period between 8 March and 27 April 2020.
2.3. Observational data
Changes in NO2, O3 and PM2.5 concentrations are first presented at the surface measurement sites available in Italy and Switzerland (by sampling the model cells belonging to each measurements sites, Section 3.2), as well as for the entire Po Valley and Swiss Plateau regions (Section 3.3); these two regions were subsetted by selecting model grid cells below 650 meters above sea level (asl), for each of the two regions they belong to. Measurement sites were additionally used to provide a benchmark for model evaluation for the CAMx-LOCK scenario (Section 3.1) based on daily averages data.Data for Italy was retrieved from the Agenzia Regionale per la Protezione Ambientale Emilia-Romagna (referred to as ARPAE) database (https://www.arpae.it/), whereas the National Air Pollution Monitoring Network (referred to as NABEL) database (https://www.bafu.admin.ch/bafu/de/home.html) was used for the Swiss measurements.
Fig. S2 and Table S1† report the spatial distribution, characteristics, and locations of the stations used for the analysis. Since lockdown measures have largely affected the transportation sector, we additionally included stations classified as urban and suburban, despite the rather coarse resolution of the model, but excluded elevated sites (i.e. above 1000 meters) and mountain sites.
3. Results
3.1. Model evaluation
Model performance was evaluated for the CAMx-LOCK scenario in terms of mean bias (MB), mean gross error (MGE), root mean square error (RMSE), index of agreement (IOA), Pearson correlation coefficient (r), mean fractional bias (MFB), and mean fractional error (MFE) (Table S2†) and compared against the metrics proposed by Boylan et al.,25 and EPA26 (Table S3†). We computed the daily mean concentrations from hourly measurements for each day included in the simulations (i.e. 8 March – 27 April 2020) and calculated the statistics of the model-observation pairs obtained from all monitoring stations data at once (therefore avoiding averages of the single station metrics).Modeled O3 concentrations were well reproduced by the model, and both the EPA model performance goals and criteria were met (Table 1).26 The model tends to slightly underestimate the daytime O3 peaks and to over predict the night time levels, as indicated by the diurnal profile in Fig. S3† which might be attributed to an underestimation in O3 precursors (i.e. NOx and VOCs), therefore affecting the overall model O3 production efficiency,6 as well as to the too strong dilution of the lower layers of the atmosphere. Almost the complete observational datasets were reproduced within the 1![[thin space (1/6-em)]](https://www.rsc.org/images/entities/char_2009.gif) :
:![[thin space (1/6-em)]](https://www.rsc.org/images/entities/char_2009.gif) 2 lines (Table 1 and Fig. 2).
2 lines (Table 1 and Fig. 2).
| Region | Species | FAC2 | MB | MGE | RMSE | r | IOA | MFB (%) | MFE (%) |
|---|---|---|---|---|---|---|---|---|---|
| Italy (ARPAE) | NO2 | 0.56 | −5.35 | 5.88 | 7.99 | 0.74 | 0.55 | −29.09 | 38.10 |
| O3 | 1.00 | −2.35 | 10.14 | 12.67 | 0.69 | 0.62 | −1.04 | 10.82 | |
| PM2.5 | 0.81 | −0.40 | 6.60 | 9.83 | 0.41 | 0.47 | −0.08 | 27.72 | |
| Switzerland (NABEL) | NO2 | 0.49 | −7.82 | 8.95 | 11.48 | 0.39 | 0.39 | −33.79 | 40.01 |
| O3 | 0.99 | 0.58 | 11.25 | 13.83 | 0.64 | 0.60 | 2.01 | 12.16 | |
| PM2.5 | 0.91 | −0.84 | 2.99 | 4.08 | 0.73 | 0.67 | −0.87 | 19.34 |
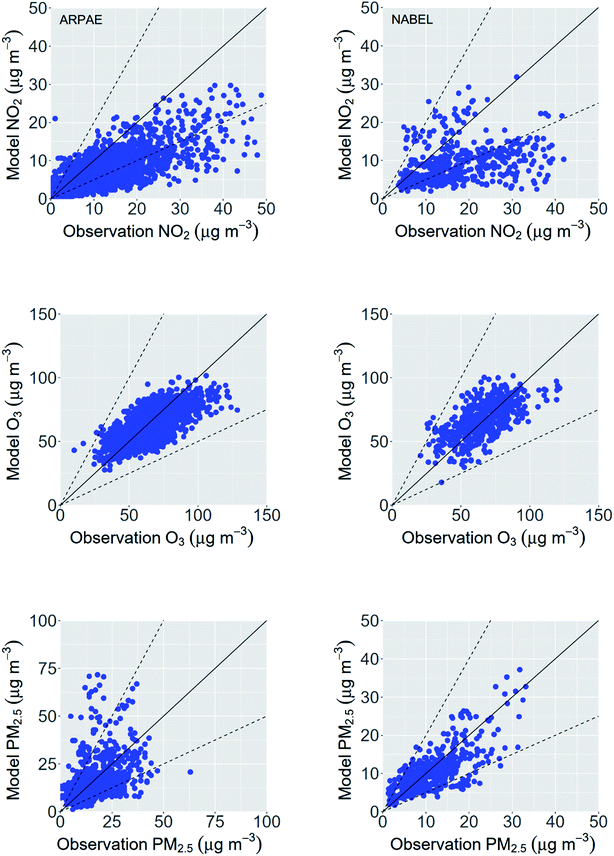 | ||
| Fig. 2 Scatterplots of daily average modeled vs. observed surface concentrations of NO2, O3 and PM2.5 at the ARPAE (left panel) and NABEL (right panel) networks (8 March – 27 April 2020). | ||
NO2 concentrations were generally underestimated (Table 1) with around 50% of the data points within a factor of two (Fig. 2), consistent with previous modeling study performed in Europe with the CAMx model6,27,28 as well as with other recent applications covering the same period.29 Such underestimation is particularly evident during daytime, which might indicate a too strong dilution of the lower layers of the atmosphere (Fig. S3†). Correlation coefficient is relatively higher for the ARPAE (Italy) stations. Both the MB and MGE are in the same absolute ranges suggesting a systematic negative bias in NO2 concentration (about 5 μg m−3 on average). At the NABEL stations (Switzerland) the MB and MGE tend to differ to a larger extent (in absolute terms) which suggest a possible compensation between underestimation and overestimation at the investigated sites (as also indicated by the lower correlation coefficient, i.e. around 0.4, compared to the ARPAE data).
Model performance for NO2 is influenced by (i) uncertainties in emission inventories (Oikonomakis et al.,6) and (ii) model resolution that might not capture the full emission strength, especially at urban sites, where local emissions are spatially very inhomogeneous. Additionally, uncertainties in NOx emission from road transport were rated as C (C corresponds to a typical error range of 50 to 200%) by the European Environment Agency.30 In this study the model resolution corresponds to about 7–10 km, which is too coarse to represent the concentrations gradient of heavily polluted sites located in the Po Valley, as well as sites located in complex topography regions like southern Switzerland. During the lockdown period, for example, concentrations up to 80 μg m−3 were observed around the urban background sites of the Milan area, whereas rural stations reported concentrations around 15 μg m−3 (Guevara et al.,24). A comparison with the study of Menut et al.,29 conducted at 20 km grid resolution over the European domain with the CHIMERE model, also indicated similar performance for NO2 concentrations, with substantial underestimations at multiple European sites (i.e. in different countries), and with even larger underestimations when using emissions data representative of the lockdown scenario. Additionally, Guevara et al.,24 compared the model performance of the MONARCH v1.0 model for NO2 during the COVID-19 lockdown periods for several European stations taken from the European Environmental Agency (EEA) database, and with emission datasets based and scaled from the Copernicus Atmosphere Monitoring Service (CAMS). Their analysis indicated that at several Italian urban sites, located near the metropolitan area of Milan, NO2 concentrations were substantially under predicted in the COVID-19 lockdown scenario (23 March to 26 April), but also during pre-lockdown periods (20 January to 20 February). The latter, was mainly attributed to the inability of the model to reproduce the strong atmospheric stability conditions of the Po Valley region. Underestimation in NO2 concentrations were also reported for several other rural sites in Italy during both pre-lockdown and strict lockdown periods (Guevara et al.,24).
The underestimation of NO2 concentrations in such areas might have several effects on the production of secondary species, and specifically: (i) reduce the titration of O3 concentrations during night time, resulting in an over prediction of O3, (ii) reduce the production efficiency of O3 during day time (Oikonomakis et al.,6) and (iii) acting as limiting agent for the production of particulate nitrate (see Section 3.3).
The total PM2.5 concentrations were satisfactorily reproduced by the model (Table 1), and both the model performance goals and performance criteria proposed by Boylan et al.,25 were met with more than 80% of the data points reproduced within a factor of 2 (Table 1 and Fig. 2). PM2.5 concentrations are generally underestimated in the model, indicating uncertainties in the emissions sources or secondary formation pathways. The relatively low temporal correlation coefficient observed at the ARPAE stations can indicate possible error compensation between the PM2.5 components, with the MB found to be around −0.4 μg m−3 but a MGE around 6.60 μg m−3. The latter effect was less pronounced at the NABEL stations (MB of around −0.84 μg m−3 and MGE around 2.99 μg m−3, resulting in higher correlation coefficient respect to the ARPAE sites, i.e. around 0.73).
3.2. Impacts of the lockdown on NO2, O3 and PM2.5 concentrations at ARPAE and NABEL stations
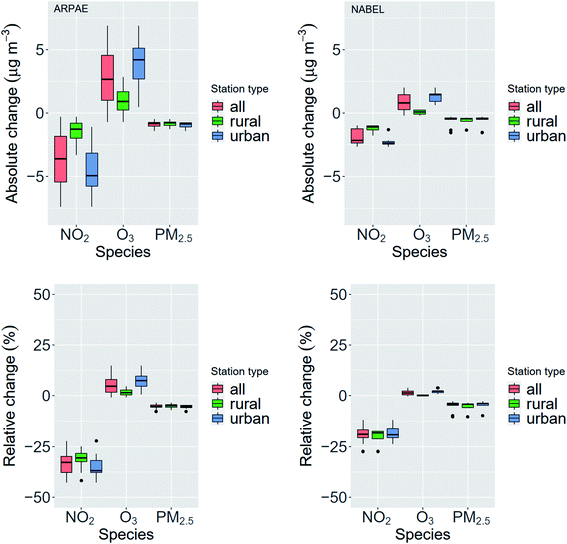
Fig. 3 shows the absolute and relative changes in modeled NO2, O3 and PM2.5 concentrations at the ARPAE and NABEL stations described in Section 2.3 and differentiated by station type (e.g. urban, rural and all sites). At the ARPAE sites, the model indicates reductions between 22% and 43% in NO2 concentrations (absolute changes between 0.3 and 7.4 μg m−3). Reductions were larger in urban areas (Fig. 3), and mainly localized along major traffic highways and highly populated areas (Fig. 4 and S4†). The model reproduced the NO2 diurnals profile (Fig. S3†), and results show that most of the reductions occurred during rush hour traffic peaks.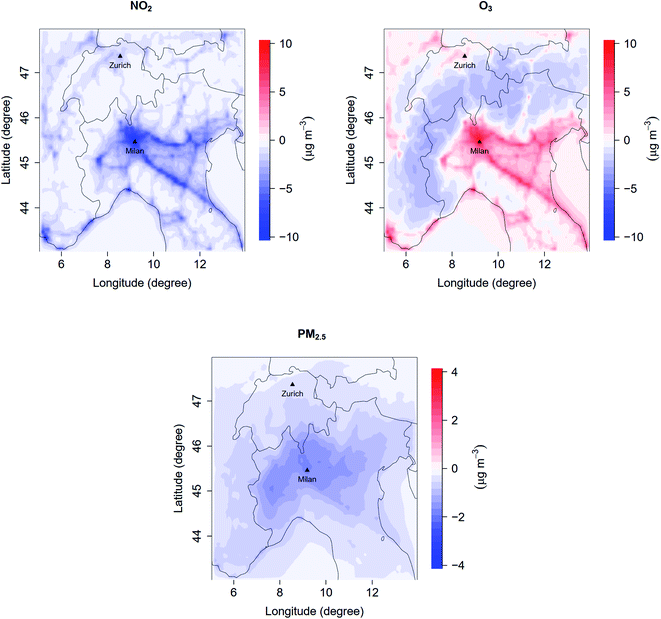 | ||
| Fig. 4 Modeled NO2, O3, and PM2.5 average absolute changes (i.e. CAMx-LOCK – CAMx-BAU) over the CAMx domain (8 March – 27 April 2020). | ||
O3 showed an increase by up to about 15% (up to 7 μg m−3), especially localized along areas where reductions in NO2 concentrations were the largest (Fig. 4). Such increases largely occurred during nighttime (Fig. S3†). As NO decreases, the depletion of O3 during nighttime proceeds less efficiently, resulting in more O3 available at night particularly around urban areas and major highways (Fig. 4 and S4†). The implications of the increase in oxidant levels are discussed in Sections 3.3 and 3.4.
Despite the large reductions in the emissions from the transport sector, differences in PM2.5 concentrations were found to be rather minimal. PM2.5 was reduced by ∼3 to 8% with absolute reductions by up to 1.4 μg m−3 (Fig. 3). The differences in PM2.5 concentrations appear to be less localized compared to the one of NO2 and more distributed over the entire Po Valley region (Fig. 4) with absolute differences below 2 μg m−3 on average (Fig. 3). These results are in line with the relative changes retrieved by comparing 2020 measurement data with available historical data, i.e. 2016–2019 period (Shen et al.,31).
At the NABEL sites, the results are generally in line with the ones discussed for the ARPAE sites, but the impact of the lockdown on air quality was less pronounced, given the less stringent lockdown measures in Switzerland compared to Italy (Fig. S1†). The model indicates reductions in NO2 concentrations to be around 12% and 27% (Fig. 3), especially during traffic rush hours (Fig. S3†).
A slight increase in O3 concentrations was also indicated at the majority of the stations, by up to almost 4% (i.e. around 2 μg m−3 in Basel) (Fig. 3 and 2). Similarly, PM2.5 showed very little changes compared to the CAMx-BAU scenario: i.e. in the range of 3 and 10% (Fig. 3). Larger absolute reductions occurred closer to Italian boarder (i.e. at the Magadino-Cadenazzo measurement sites, with the model indicating an average absolute reduction of around 1.3 μg m−3).
3.3. Impacts of lockdown measurements on concentrations of PM2.5 components in the Po Valley and Swiss Plateau regions
The main reduction in PM2.5 can be related to the decrease in particle nitrate (NO3−), elemental carbon (EC) and particle ammonium (NH4+) (Fig. 5 and 6). The model indicates a reduction in EC of about up to 29% over the Po Valley, and 14% over the Swiss Plateau (Fig. S5†). These results are in line with the study of Evangeliou et al.,32 which suggested a decline in black carbon (BC) emissions in Europe of around 11% (20% for Italy) as compared to the same period during the 2015–2019 climatological data. Similarly, model results indicated a reduction in NO3− concentrations of around 20% and 11% for the Po Valley and the Swiss Plateau regions, respectively (Fig. 5 and S5†). With the reduction of NOx, the HNO3 production was reduced (see next Section 3.4), resulting in lower particulate nitrate concentrations. The average absolute reduction in NO3− was ∼0.8 μg m−3 and less than 0.3 μg m−3, over the Po Valley and the Swiss Plateau, respectively (Fig. 6 and Table 2). We acknowledge that the modeled reduction of NO3− concentrations might have been influenced by the under prediction in the modeled NO2 concentrations, which might act as a limiting agent, and therefore possibly over predicting such a reduction. The absolute reductions in NO3− concentrations over the “Greater Milan” area are lower compared to the surrounding areas despite being the area which exhibited the largest reduction in NO2 concentration (Fig. 4). Additionally, the model did not indicate any substantial changes in NH3 concentrations (Fig. S6†). The mild increase in NH3 concentrations is likely related to the reduction of NOx emissions which leaves more ammonia in the gas-phase,33 as also suggested by additional studies in Beijing.34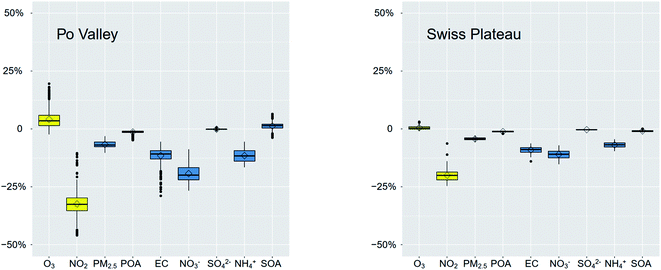 | ||
| Fig. 5 Relative differences in NO2, PM2.5, POA, EC, NO3−, SO42−, NH4+ and SOA concentrations between the CAMx-COVID and the CAMx-BAU scenarios. Po Valley, left panel, and Swiss Plateau, right panel (see Fig. S2† for the details on the regions). The PM2.5 also includes crustal materials (not altered in the CAMx-COVID scenario). | ||
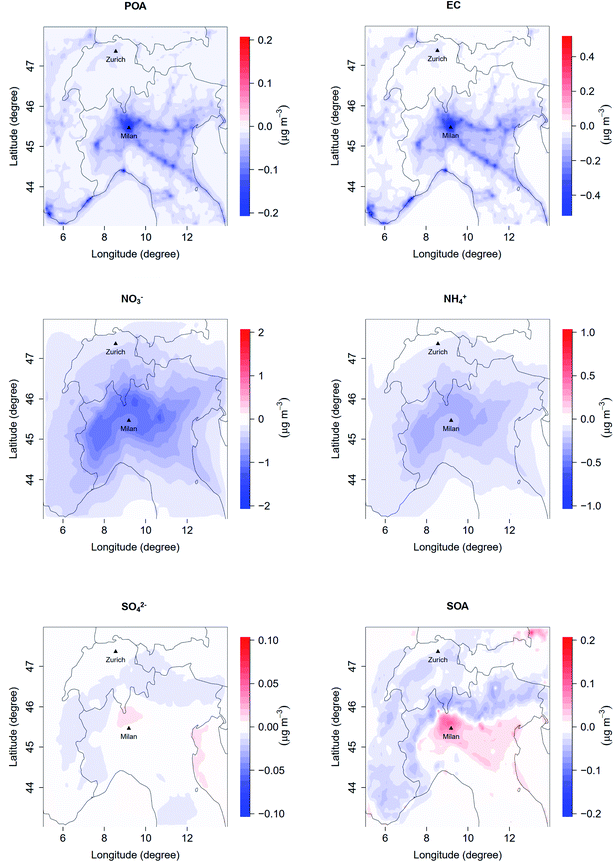 | ||
| Fig. 6 Absolute changes (i.e. CAMx-LOCK – CAMx-BAU) concentrations of POA, EC, NO3−, NH4+, SO42− and SOA over the CAMx domain (8 March – 27 April 2020). | ||
| Species | Po Valley | Swiss Plateau | ||||
|---|---|---|---|---|---|---|
| Min | Mean | Max | Min | Mean | Max | |
| O3 | −1.84 | 2.40 | 8.75 | −0.70 | 0.34 | 1.86 |
| NO2 | −9.25 | −3.19 | −0.38 | −2.91 | −1.47 | −0.55 |
| PM2.5 | −1.84 | −1.16 | −0.53 | −0.59 | −0.43 | −0.27 |
| POA | −0.21 | −0.05 | −0.01 | −0.03 | −0.02 | −0.01 |
| EC | −0.52 | −0.13 | −0.03 | −0.09 | −0.05 | −0.02 |
| NO3− | −1.09 | −0.76 | −0.33 | −0.36 | −0.27 | −0.17 |
| SO42− | −0.01 | 0.00 | 0.01 | −0.01 | 0.00 | 0.00 |
| NH4+ | −0.31 | −0.22 | −0.10 | −0.11 | −0.08 | −0.05 |
| SOA | −0.06 | 0.02 | 0.11 | −0.04 | −0.02 | 0.00 |
No substantial changes in SO42− concentrations were predicted either in the Po Valley, or in the Swiss Plateau regions (Table 2). This differs from previous study performed over the Chinese domain which indicated a substantial increase in the production of particle sulfate during lockdown periods.8 Such discrepancy might be related to (i) the extent of which NOx emissions were reduced (i.e.) a reduction of up to 80% in NOx emission were considered in the study of Le et al.,8 and (ii) the availability of sulfuric acid (H2SO4) molecules that can be neutralized by ammonia (NH3). Europe has experienced substantial reductions in sulfur dioxide concentrations (SO2, a sulfuric acid precursor) starting from the early '90 s, rapidly bringing the concentrations to very low values.35 This might not be the case for regions such as China where, despite constant improvements in several air quality indicators, sulfur containing species are still abundant due to the extensive use of coal as a principal commodity of the energy market.36
Modeled SOA concentrations showed a mild increase over the Po Valley (around 1% on average, Fig. 5 and S5†) and especially over the “Greater Milan” area (around 6% increase in SOA concentrations) and along major highways, whereas the model indicated no substantial difference in SOA over the Swiss Plateau.
3.4. Chemical Process Analysis (CPA) application over the “Greater Milan” area
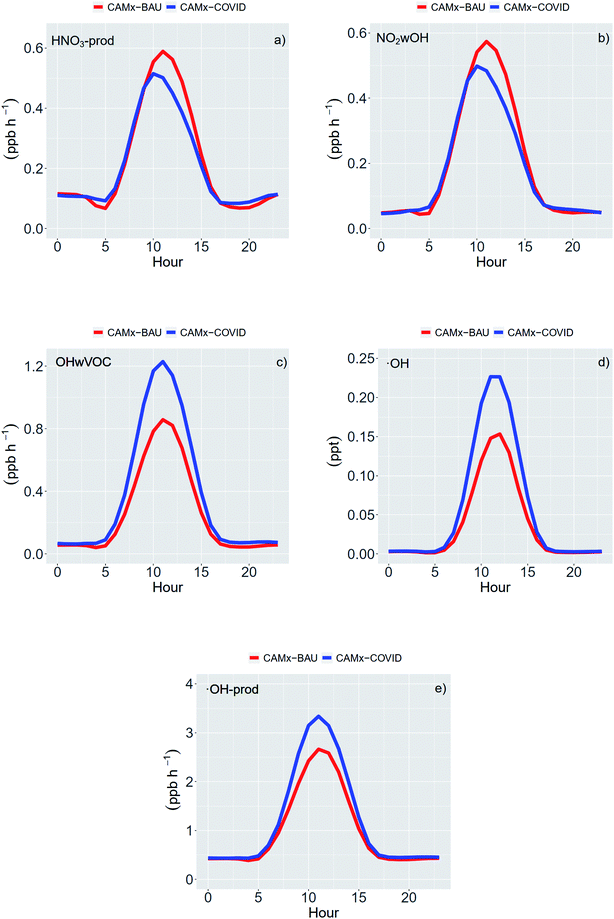
The Chemical Process Analysis (CPA) tool,10 provides in-depth information on the physical and chemical processes occurring during a CAMx run. CPA results were analyzed over the “Greater Milan” area for cells where the O3 enhancements were predicted to be larger than 15% (Fig. S4†). We tagged specific reaction pathways (Table S4†), involved in the formation of SOA, ˙NO3 and HNO3 and we reported the analysis for the full period of the simulation (8 March – 27 April 2020). The diurnal changes for the different chemical reactions are reported in Fig. 7.An increase in SOA concentrations was predicted by the model mainly for the anthropogenic fraction of SOA during daytime hours (Fig. 8) and in areas where substantial reductions of NO2 concentrations occurred. Because anthropogenic SOA precursors from traffic were also reduced in our simulations, this suggests that an increase of the oxidation capacity of the atmosphere might have compensated for such a reduction.
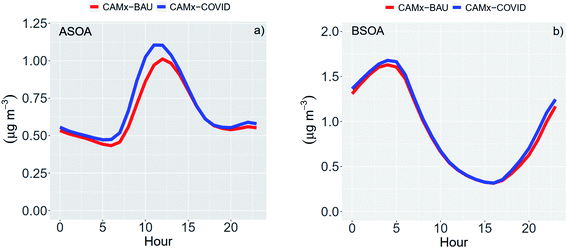 | ||
| Fig. 8 Diurnals variations of ASOA concentrations (a) (μg m−3) and BSOA concentrations (b) (μg m−3) for the “Greater Milan” area (8 March – 27 April 2020). | ||
A decrease in the production of nitric acid (HNO3-prod) during the lockdown period can be seen throughout daytime hours, mainly because of the reduced NO2 oxidation with ˙OH (NO2wOH, Fig. 7). An analysis of both the modeled ˙OH radicals concentrations and ˙OH production rates, indicated substantial increases, by 55% and 25% respectively, during daytime hours, i.e. 9:00–15:00 UTC.
We also report the analysis of three main pathways of ·OH radicals as available in the model: (i) the reactions of oxygen in the excited states with water, i.e. O(1D) + H2O, (ii) the reactions of O3 with VOCs (e.g. isoprene, alkenes, terpenes) and (iii) the photolysis of chemical species such as HONO, HNO3, and H2O2 (among others). Using the PA tools we observed that the model did not indicate any substantial changes between the two scenarios (Fig. S7†). Additionally, the model calculated an increase in both the concentrations and production rates of the ˙HO2 radical (formed in the model as a sub-product of the reactions of VOCs with the ˙OH radicals), with production rates up to 38% more compared to the business as usual scenario during day time hours (Fig. S8†). Likely, as NO2 emissions were reduced, the reactions of VOCs against ˙OH radicals are favored, leading to the mild increase in SOA concentrations, as well as to the additional production of ˙HO2. As ˙HO2 can rapidly recombine with O3 and NO2 to reform ˙OH, we hypothesize that this could explain the modeled increase in the ˙OH production rates. Also, the emission model estimates that the relative contribution of traffic related VOCs in the Po Valley is around 5 to 15%, and with total toluene emissions reductions being around 15% (Fig. S9†). This suggests that a large pool of VOCs is still available to react with ˙OH during the lockdown period.
A very small increase in HNO3-prod is noticeable during traffic rush hours peak (Fig. 7), i.e. around 5:00 and 18:00 UTC, as well as in the production rate of the nitrate radical ˙NO3 during these hours (Fig. S8†). This resulted in an additional very small increase in the production rate of N2O5 (NO3 to N2O5) and therefore in the production rate of HNO3via heterogeneous chemistry (N2O5wH2O) during nighttime hours when the photolysis of ˙NO3 is inhibited. This counterintuitive behavior might be explained by the decrease of NO emissions and the simultaneous increase in O3 concentrations. As NO emissions are quickly reduced after the enforcement of the lockdown, the depletion of ˙NO3 to NO2 is also reduced (i.e. ˙NO3 + NO → 2NO2) therefore increasing its availability. Additionally, the reduced O3 titration at night (see Section 3.2) enhanced the availability of O3 levels which is rapidly converted to ˙NO3 (O3 + NO2 → ˙NO3 + O2), as also suggested by Huang et al.9 This non-linear behavior (i.e. reduction in NOx emissions and increase in ˙NO3 radical) might be important in counteracting the reduction in particle nitrate concentrations especially in areas where larger reduction on NOx occurred, like the “Greater Milan” area, compared to the surrounding areas which experienced lower emission reductions. During daytime hours, CPA indicates an overall decrease in the production rate of ˙NO3 (Fig. S8†) due to the changes in NO2 and O3 concentrations and probably, to a lesser extent, due to the reduced oxidation of HNO3 against the ˙OH radical.
CPA additionally indicated a very small increase in biogenic SOA (BSOA) concentrations during nighttime hours, which we attributed to the increased reactions of VOCs with the ˙NO3 radicals at night. Fig. 8 also illustrates substantial differences between the diurnal cycles of ASOA and BSOA concentrations. ASOA concentrations peak at around noon in both scenarios, whereas BSOA concentrations are enhanced during nighttime, and rapidly decrease during daytime hours. Such behavior might reflect the different origins of the ASOA and BSOA fractions over the “Greater Milan” area during this period. Being an area characterized by intense anthropogenic activities, the local sources might play an important role for building up concentrations, therefore explaining the daytime peaks. Additionally, ASOA is likely more limited by the availability of the oxidant whereas a large fraction of BSOA is more likely to react with the oxidants and to be characterized by long range transport. Therefore, their concentrations can be largely modulated by the planetary boundary layer dynamics, in absence of a strong local production.
4. Conclusions
We performed a sensitivity analysis with the CAMx model to investigate the effects of lockdown restrictions on gas-phases and particulate matter concentrations. Two different emission scenarios were prepared to perform the analysis: the first scenario, referred to as CAMx-BAU, based on standard TNO emission inventories and the lockdown scenario, referred to as CAMx-LOCK, where emissions from the transportation sector, i.e. on-road traffic, were scaled based on mobility data available from different sources. The analysis was performed for two different regions sharing similar orographic characteristic, i.e. the Po Valley (Italy) and Swiss Plateau (Switzerland) regions.Our results indicated a substantial decrease in the nitrogen dioxide (NO2) concentrations, up to around 46 and 25% for the Po Valley and Swiss Plateau regions, respectively. Such reductions were larger in urban areas compared to rural ones. Conversely, O3 concentrations showed an increase in areas where substantial NO2 emissions took place. Such non-linear behavior was attributed to the less efficient O3 titration. Despite substantial decreases in NO2 concentrations, the model indicated rather small changes in the PM2.5 concentrations. Particulate nitrate (NO3−), elemental carbon (EC) and particulate ammonium (NH4+) were the PM2.5 components that exhibited the highest reductions in both regions, whereas the model suggested almost no changes in the particulate sulfate concentrations (SO42−) and a mild increase in secondary organic aerosol (SOA) concentrations over the Po Valley region, and especially over the “Greater Milan” area (up to 6%).
The analysis of tagged chemical reactions, conducted with the Chemical Process Analysis (CPA) tool, indicated an increase in the reactions of volatile organic compounds (VOCs) with the hydroxyl (˙OH) as well with nitrate radicals (˙NO3), in areas where substantial emission reduction took place (i.e. the “Greater Milan” area), partially counteracting the reduction of primary emitted components.
Data availability
The air quality model is available from http://www.camx.com. Measurements used for model evaluation were obtained from the ARPAE database which is available from https://dati.arpae.it. The model data can be obtained upon request from the corresponding authors.Author contributions
G. C. led the work, performed the WRF simulations, the data analysis, and wrote the paper. J. J. prepared the anthropogenic emissions, boundary conditions and performed the CAMx simulations by collaborating with S. A., A. H. S. P. and I. E. H. F. B., A. B., A. M. J. S. and C. Y. provided measurements data and helped with the interpretation of the results and recommendation for the analysis. All co-authors commented on the paper and supported the interpretation of the results.Conflicts of interest
The authors declare no competing interests.Acknowledgements
This work was support by the European Research Council via the project CHAPAs (No. 850614) and by the Academy of Finland (No. 311932). We acknowledge the financial support of the Swiss Federal Office of Environment (FOEN) and NABEL/EMPA for the measurement data in Switzerland.References
- R. M. Anderson, H. Heesterbeek, D. Klinkenberg and T. D. Hollingsworth, How will country-based mitigation measures influence the course of the COVID-19 epidemic?, Lancet, 2020, 395, 931–934 CrossRef CAS.
- C. Bradbury-Jones and L. Isham, The pandemic paradox: the consequences of COVID-19 on domestic violence, J. Clin. Nurs., 2020, 29, 2047–2049 CrossRef PubMed.
- R. P. Rajkumar, COVID-19 and mental health: a review of the existing literature, Asian J. Psychiatr., 2020, 52, 102066 CrossRef PubMed.
- WHO, https://covid19.who.int/?gclid=Cj0KCQjw8fr7BRDSARIsAK0Qqr57IVne9zN4tz1BZXBcLWfLSNb07q5ZEvw-QGW5uZt5r-dspPmt9gQaAuLZEALw_wcB, 2020.
- WHO, https://apps.who.int/iris/bitstream/handle/10665/334167/WHO-EURO-2020-1073-408190-55167-eng.pdf, 2020.
- E. Oikonomakis, S. Aksoyoglu, G. Ciarelli, U. Baltensperger and A. S. H. Prévôt, Low modeled ozone production suggests underestimation of precursor emissions (especially NOx) in Europe, Atmos. Chem. Phys., 2018, 18, 2175–2198 CrossRef CAS.
- J. H. Seinfeld and S. N. Pandis, Atmospheric Chemistry and Physics: From Air Pollution to Climate Change, Wiley, 2012 Search PubMed.
- T. Le, Y. Wang, L. Liu, J. Yang, Y. L. Yung, G. Li and J. H. Seinfeld, Unexpected air pollution with marked emission reductions during the COVID-19 outbreak in China, Science, 2020, 369, 702–706 CrossRef CAS PubMed.
- X. Huang, A. Ding, J. Gao, B. Zheng, D. Zhou, X. Qi, R. Tang, J. Wang, C. Ren, W. Nie, X. Chi, Z. Xu, L. Chen, Y. Li, F. Che, N. Pang, H. Wang, D. Tong, W. Qin, W. Cheng, W. Liu, Q. Fu, B. Liu, F. Chai, S. J. Davis, Q. Zhang and K. He, Enhanced secondary pollution offset reduction of primary emissions during COVID-19 lockdown in China, Natl. Sci. Rev., 2021, 8, nwaa137 CrossRef CAS.
- Ramboll, User's Guide: The Comprehensive Air Quality Model With Extensions (CAMx) Version 6.5, California, 2018 Search PubMed.
- R. L. Hildebrandt and G. Yarwood, Interactions between Organic Aerosol and NOy: Influence on Oxidant Production, Prepared for the Texas AQRP (Project 12-012), University of Texas at Austin, and ENVIRON International Corporation, Novato, CA, 2013 Search PubMed.
- A. Nenes, S. N. Pandis and C. Pilinis, ISORROPIA: A New Thermodynamic Equilibrium Model for Multiphase Multicomponent Inorganic Aerosols, Aquat. Geochem., 1998, 4, 123–152 CrossRef CAS.
- A. Hodzic, P. S. Kasibhatla, D. S. Jo, C. D. Cappa, J. L. Jimenez, S. Madronich and R. J. Park, Rethinking the global secondary organic aerosol (SOA) budget: stronger production, faster removal, shorter lifetime, Atmos. Chem. Phys., 2016, 16, 7917–7941 CrossRef CAS.
- X. Zhang, C. D. Cappa, S. H. Jathar, R. C. McVay, J. J. Ensberg, M. J. Kleeman and J. H. Seinfeld, Influence of vapor wall loss in laboratory chambers on yields of secondary organic aerosol, Proc. Natl. Acad. Sci. U. S. A., 2014, 111, 5802–5807 CrossRef CAS.
- H. O. T. Pye, A. W. H. Chan, M. P. Barkley and J. H. Seinfeld, Global modeling of organic aerosol: the importance of reactive nitrogen (NOx and NO3), Atmos. Chem. Phys., 2010, 10, 11261–11276 CrossRef CAS.
- H. O. T. Pye, E. L. D'Ambro, B. H. Lee, S. Schobesberger, M. Takeuchi, Y. Zhao, F. Lopez-Hilfiker, J. Liu, J. E. Shilling, J. Xing, R. Mathur, A. M. Middlebrook, J. Liao, A. Welti, M. Graus, C. Warneke, J. A. de Gouw, J. S. Holloway, T. B. Ryerson, I. B. Pollack and J. A. Thornton, Anthropogenic enhancements to production of highly oxygenated molecules from autoxidation, Proc. Natl. Acad. Sci. U. S. A., 2019, 116, 6641–6646 CrossRef CAS PubMed.
- W. C. Skamarock, J. B. Klemp, J. Dudhia, D. O. Gill, Z. Liu, J. Berner, W. Wang, J. G. Powers, M. G. Duda, D. M. Barker and X.-Y. Huang, A Description of the Advanced Research WRF Model Version 4, UCAR/NCAR, 2019 Search PubMed.
- D. R. Marsh, M. J. Mills, D. E. Kinnison, J.-F. Lamarque, N. Calvo and L. M. Polvani, Climate Change from 1850 to 2005 Simulated in CESM1(WACCM), J. Clim., 2013, 26, 7372–7391 CrossRef.
- H. E. Jeffries and S. Tonnesen, A comparison of two photochemical reaction mechanisms using mass balance and process analysis, Atmos. Environ., 1994, 28, 2991–3003 CrossRef CAS.
- J. J. P. Kuenen, A. J. H. Visschedijk, M. Jozwicka and H. A. C. Denier van der Gon, TNO-MACC_II emission inventory; a multi-year (2003–2009) consistent high-resolution European emission inventory for air quality modelling, Atmos. Chem. Phys., 2014, 14, 10963–10976 CrossRef.
- S. Andreani-aksoyoglu and J. Keller, Estimates of monoterpene and isoprene emissions from the forests in Switzerland, J. Atmos. Chem., 1995, 20, 71–87 CrossRef CAS.
- D. C. Oderbolz, S. Aksoyoglu, J. Keller, I. Barmpadimos, R. Steinbrecher, C. A. Skjøth, C. Plaß-Dülmer and A. S. H. Prévôt, A comprehensive emission inventory of biogenic volatile organic compounds in Europe: improved seasonality and land-cover, Atmos. Chem. Phys., 2013, 13, 1689–1712 CrossRef.
- J. Jiang, S. Aksoyoglu, G. Ciarelli, E. Oikonomakis, I. El-Haddad, F. Canonaco, C. O'Dowd, J. Ovadnevaite, M. C. Minguillón, U. Baltensperger and A. S. H. Prévôt, Effects of two different biogenic emission models on modelled ozone and aerosol concentrations in Europe, Atmos. Chem. Phys., 2019, 19, 3747–3768 CrossRef CAS.
- M. Guevara, O. Jorba, A. Soret, H. Petetin, D. Bowdalo, K. Serradell, C. Tena, H. Denier van der Gon, J. Kuenen, V.-H. Peuch and C. Pérez García-Pando, Time-resolved emission reductions for atmospheric chemistry modelling in Europe during the COVID-19 lockdowns, Atmos. Chem. Phys., 2021, 21, 773–797 CrossRef CAS.
- J. W. Boylan and A. G. Russell, PM and light extinction model performance metrics, goals, and criteria for three-dimensional air quality models, Atmos. Environ., 2006, 40, 4946–4959 CrossRef CAS.
- EPA, Guidance on the use of models and other analyses for demonstrating attainment of air quality goals for ozone, PM2.5, and regional haze, US Environmental Protection Agency, Office of Air Quality Planning and Standards, 2007 Search PubMed.
- B. Bessagnet, G. Pirovano, M. Mircea, C. Cuvelier, A. Aulinger, G. Calori, G. Ciarelli, A. Manders, R. Stern, S. Tsyro, M. García Vivanco, P. Thunis, M.-T. Pay, A. Colette, F. Couvidat, F. Meleux, L. Rouïl, A. Ung, S. Aksoyoglu, J. M. Baldasano, J. Bieser, G. Briganti, A. Cappelletti, M. D'Isidoro, S. Finardi, R. Kranenburg, C. Silibello, C. Carnevale, W. Aas, J.-C. Dupont, H. Fagerli, L. Gonzalez, L. Menut, A. S. H. Prévôt, P. Roberts and L. White, Presentation of the EURODELTA III intercomparison exercise – evaluation of the chemistry transport models' performance on criteria pollutants and joint analysis with meteorology, Atmos. Chem. Phys., 2016, 16, 12667–12701 CrossRef CAS.
- G. Ciarelli, S. Aksoyoglu, M. Crippa, J.-L. Jimenez, E. Nemitz, K. Sellegri, M. Äijälä, S. Carbone, C. Mohr, C. O'Dowd, L. Poulain, U. Baltensperger and A. S. H. Prévôt, Evaluation of European air quality modelled by CAMx including the volatility basis set scheme, Atmos. Chem. Phys., 2016, 16, 10313–10332 CrossRef CAS.
- L. Menut, B. Bessagnet, G. Siour, S. Mailler, R. Pennel and A. Cholakian, Impact of lockdown measures to combat COVID-19 on air quality over western Europe, Sci. Total Environ., 2020, 741, 140426 CrossRef CAS PubMed.
- EEA, EEA: EMEP/EEA air pollutant emission inventory guidebook – 2016, European Environment Agency, Copenhagen, 2016 Search PubMed.
- J. Shen, A. Bigi, A. Marinoni, J. Lampilahti, J. Kontkanen, G. Ciarelli, J.-P. Putaud, T. Nieminen, M. Kulmala, K. Lehtipalo and F. Bianchi, The effect of COVID-19 lockdown on the aerosol size distribution in Northern Italy, Environ. Sci., 2021 Search PubMed.
- N. Evangeliou, S. M. Platt, S. Eckhardt, C. Lund Myhre, P. Laj, L. Alados-Arboledas, J. Backman, B. T. Brem, M. Fiebig, H. Flentje, A. Marinoni, M. Pandolfi, J. Yus-Dìez, N. Prats, J. P. Putaud, K. Sellegri, M. Sorribas, K. Eleftheriadis, S. Vratolis, A. Wiedensohler and A. Stohl, Changes in black carbon emissions over Europe due to COVID-19 lockdowns, Aerosols/Atmospheric Modelling/Troposphere/Physics (physical properties and processes), 2020 Search PubMed.
- S. Aksoyoglu, J. Jiang, G. Ciarelli, U. Baltensperger and A. S. H. Prévôt, Role of ammonia in European air quality with changing land and ship emissions between 1990 and 2030, Atmos. Chem. Phys., 2020, 20, 15665–15680 CrossRef CAS.
- Y. Zhang, X. Liu, Y. Fang, D. Liu, A. Tang and J. L. Collett, Atmospheric Ammonia in Beijing during the COVID-19 Outbreak: Concentrations, Sources, and Implications, Environ. Sci. Technol. Lett., 2021, 8, 32–38 CrossRef CAS.
- G. Ciarelli, M. R. Theobald, M. G. Vivanco, M. Beekmann, W. Aas, C. Andersson, R. Bergström, A. Manders-Groot, F. Couvidat, M. Mircea, S. Tsyro, H. Fagerli, K. Mar, V. Raffort, Y. Roustan, M.-T. Pay, M. Schaap, R. Kranenburg, M. Adani, G. Briganti, A. Cappelletti, M. D'Isidoro, C. Cuvelier, A. Cholakian, B. Bessagnet, P. Wind and A. Colette, Trends of inorganic and organic aerosols and precursor gases in Europe: insights from the EURODELTA multi-model experiment over the 1990–2010 period, Geosci. Model Dev., 2019, 12, 4923–4954 CrossRef CAS.
- X. Li, J. Wu, M. Elser, T. Feng, J. Cao, I. El-Haddad, R. Huang, X. Tie, A. S. H. Prévôt and G. Li, Contributions of residential coal combustion to the air quality in Beijing–Tianjin–Hebei (BTH), China: a case study, Atmos. Chem. Phys., 2018, 18, 10675–10691 CrossRef CAS.
Footnote |
| † Electronic supplementary information (ESI) available. See DOI: 10.1039/d1ea00036e |
| This journal is © The Royal Society of Chemistry 2021 |

