The exposed hematite surface and the generation of environmentally persistent free radicals during catechol degradation†
Ziyu
Zhao
 a,
Quan
Chen
 a,
Hao
Li
a,
Di
Lang
a,
Meixuan
Wu
a,
Dandan
Zhou
a,
Bo
Pan
a,
Hao
Li
a,
Di
Lang
a,
Meixuan
Wu
a,
Dandan
Zhou
a,
Bo
Pan
 *a and
Baoshan
Xing
 b
b
aYunnan Provincial Key Laboratory of Soil Carbon Sequestration and Pollution Control, Faculty of Environmental Science & Engineering, Kunming University of Science & Technology, Kunming, Yunnan 650500, China. E-mail: panbocai@gmail.com; Fax: +86-871-65170906; Tel: +86-871-65170906
bStockbridge School of Agriculture, University of Massachusetts, Amherst, MA 01003, USA
First published on 16th November 2020
Abstract
Environmentally persistent free radicals (EPFRs) have drawn increasing attention. It is reported that EPFR formation is dependent on the presence of transition metals; however the size of the metal particles is ignored. In this study, we hypothesized that transition metals in smaller particle sizes could more efficiently promote the generation of EPFRs and thus have higher risks. Nanosized hematite (nanoHMT) and microsized hematite (microHMT) were studied and compared. We monitored the degradation of catechol and the generation of EPFRs under both dark and ultraviolet light conditions. Catechol degradation was inhibited in the presence of hematite in the dark, with more significant inhibition by nanoHMT. However, under ultraviolet light, catechol degradation was promoted by hematite, with more significant promotion by nanoHMT. The yield of free radicals in the nanoHMT system was always higher than that in the microHMT system. More dimers were detected in the nanoHMT system, which may have played an important role in stabilizing free radicals. More trivalent Fe was converted to divalent Fe in the nanoHMT system than in the microHMT system. The relatively more active sites for the catechol interaction promoted EPFR generation. These results highlighted that size-dependent reactions should be well considered when predicting the environmental behavior and risks of organic contaminants.
Environmental significanceThe importance of the precursor structure was emphasized in previous studies on environmentally persistent free radical (EPFR) formation, but the exposed surface sites were not investigated. By comparing EPFR formation on silica coated with different sized hematite, we found that the intensity of the generated EPFRs is dependent on the exposed active sites. Thus, measuring the amount of exposed active sites will be very helpful to understand the interaction mechanisms between organic chemicals and metal oxides, especially the formation of EPFRs. |
1. Introduction
Environmentally persistent free radicals (EPFRs) have lifetimes of days to months.1 They are widely found in pyrolyzed carbonaceous materials,2 atmospheric particulate matter,3 organic polluted soil4 and metal nanoparticles loaded with organic matter.5 Generally, unpaired electrons in the degradation intermediates of organic chemicals and in transition metals interacted through the conjugation effect or space effect of their structure,6 and thus stabilized. EPFRs attracted a great deal of research attention because of two potential environmental impacts.7–9 The first one is the potential toxic impact posed by EPFRs. Previous investigators have suggested that the reactivity of EPFRs themselves, as well as their induced reactive oxygen species, may cause oxidative stress to various organisms.10–12 However, because EPFRs are associated with particles, traditional risk assessment frameworks did not include their potentially toxic consequences.13 In addition, current studies have not established a practical protocol to evaluate or quantify the toxic stress by EPFRs, largely because of incomplete understanding of EPFRs. For example, no correlation was reported between the characteristics of EPFRs and their toxicity.14The second potential environmental impact is the reactivity of EPFRs in controlling the environmental behavior of contaminants.15 EPFRs may hinder the generation of intermediate degradation products and thus inhibit the apparent degradation. On the other hand, they may react with water and oxygen in the air to form active substances, which may promote the degradation of precursor pollutants.15,16 Undoubtedly, revealing the generation mechanism of EPFRs is of essential importance to evaluate their environmental impacts. Previous studies have suggested that transition metals should be involved in the degradation of a precursor with at least one benzene ring.17 A three-step reaction was proposed for EPFR generation: physical adsorption, chemical adsorption, and electron transfer.17 Organic chemicals were initially adsorbed on a surface containing transition metals, and the electrons generally transferred from organic chemicals to the metal. Different types of metals were compared and the authors tried to describe EPFRs in relation to transition metal properties. For example, the tendency of EPFR formation followed the order of the oxidizing strengths18 or redox potentials of the metal ions.19 The stability of EPFRs, described by the half-life, was positively correlated with the standard reduction potential of transition metals.20 It should be noted that transition metal oxides were loaded on or mixed with silica (as a supporter) generally with the mass percent below 5%,21,22 most possibly with different particulate sizes. Although the apparent surface areas of the mixtures were comparable (because of the overwhelming mass of silica), the exposed surface areas of transition metals were not the same, because of their varied particle sizes. However, the particle sizes or the exposed surface of transition metal oxides was not discussed regarding their impacts on EPFR formation. In addition, we have observed in our previous work that the lattice structure of iron oxide has a significant effect on its reactivity and the degradation products of catechol may also be involved in EPFR formation.23 Thus, EPFR formation is related to various organic precursors as the reaction proceeds. Since EPFR formation is related to the exposed transition metals, we hypothesize that for the same mass ratio, metal oxides with smaller particle sizes may stabilize more EPFRs. However, the intensity of EPFRs may not relate to the extent of precursor degradation, because of the various organic precursors (including the degradation byproducts).
To address this hypothesis, catechol was selected as the model compound for a better comparison with the literature results.15,23,24 A micro-hematite and a nano-hematite with distinct particle sizes were used to investigate their roles in EPFR generation. Hematite has a good photocatalytic effect on organic pollutants,25 and small size hematite may have higher photocatalytic activity due to more active site exposure. Thus, the role of exposed surface sites was investigated in under both dark and UV-light conditions.
2. Materials and methods
2.1 Preparation and characterization of solid particles
Nano-sized or micro-sized hematite was physically mixed with silica particles to dilute and avoid their self-aggregation. Briefly, 1 g hematite particles were mixed with 99 g silica, and then put in 250 mL ultrapure water in a 1000 mL beaker. The mixtures were ultrasonicated for 10 min, and stirred every other 12 h for 3 d before drying at 100 °C in an oven. The obtained particles contained 1% hematite (w/w), and was noted as nanoHMT and microHMT, respectively. Pure silica particles were processed using the same procedure as a blank control. Nano (30 nm, 99.5%) and micro hematite (10 μm, 99.5%) was purchased from Aladdin, China. Silica (100–200 mesh) was bought from Haiyang Chemical Co., Qingdao, China.The surface area was determined using a volumetric gas adsorption instrument (Autosorb-1C, Quantachrome, USA) by N2 adsorption at 77 K. The surface elemental composition of C, O, N, Si and Fe of the investigated particles was determined by X-ray photoelectron spectroscopy (XPS) (PHI 5000 Versaprobe-II). The morphology of the prepared particles was observed using a scanning electron microscope (SEM) equipped with an energy dispersive X-ray spectrometer (EDX) (Thermo Fisher Scientific, Waltham, MA, USA). XRD patterns were recorded using an X-ray diffractometer (D/Max-2200, Rigaku, Japan), with a Cu Kα radiation source (λ = 0.15406 nm) operating at 40 kV and 40 mA.
2.2 Catechol adsorption and degradation on hematite
Catechol adsorption and degradation were investigated in both solid–liquid equilibrium and dry-state reaction systems. For the solid–liquid equilibrium experiment, catechol (AR, 99%, Aladdin-reagent Co. Ltd., China) was dissolved in ultrapure water to a series of concentrations (0–100 mg L−1). Twenty mg solid particles and 4 mL catechol solution with different concentrations were taken in 4 mL amber glass vials with Teflon-lined screw caps and shaken in an air-bath shaker (100 rpm min−1) at 25 °C for 3 days. Then the mixture was centrifuged at 2000 rpm min−1 for 10 min, and the supernatants were taken out for catechol quantification. At the end of this solid–liquid equilibrium experiment, the particles were extracted three times using methanol, and the recovery of catechol generally reached 100%. Thus, no detectable degradation of catechol was observed.In the dry-state reaction system, catechol was loaded on solid particles through liquid-phase dosing. Catechol was dissolved in ultrapure water to 300 mg L−1. Four mL catechol solution was added to 1.2 g particles in 40 mL amber glass vials with Teflon-lined screw caps. The liquid–solid mixture was equilibrated for 10 h in an air-bath shaker (120 rpm min−1) before freeze-drying. The particles loaded with catechol were placed in the dark or under UV light for degradation experiments. UV-light irradiation was achieved using a UV lamp (Labino PS135, Sweden) equipped with a 35 W UV-light bulb (DUV 35, Labino). An optical filter with a cutoff of 315 nm was placed in front of the UV light, and thus the samples were irradiated by UV light of 315–400 nm with the peak at 365 nm. When the samples reached a certain reaction period, the solid particles were extracted using methanol three times. Because of the high recovery of methanol extraction according to the solid–liquid equilibrium experiment, the difference between the initially applied catechol and the residual concentrations in both aqueous and solid phases was attributed to catechol degradation.
2.3 EPR measurements
The EPFR signals of the particles were continuously monitored using an electron paramagnetic resonance (EPR) spectrometer. An aliquot of 80 mg solid particles was loaded in quartz thin-wall EPR tubes (707-SQ-250M, Wilmad, USA), and the tubes were placed in the resonant cavity of the EPR spectrometer (X-band A300-6/1, Bruker) at room temperature. The spectral parameters for monitoring the free radical signal were a microwave frequency of 9.86 GHz, microwave power of 10 mW, sweep width of 400 G, center field of 3520 G, modulation amplitude of 3 G, resolution of 1024 points, receiver gain of 3.17 × 10³, time constant of 20.48 ms and sweep time of 102.4 s. The light source used in the EPFR monitoring experiment was the same as that used in the degradation experiment.2.4 Quantification of catechol
The catechol concentrations in water (the supernatant in the solid–liquid equilibrium experiment) and methanol (after extraction of the solid particles) were quantified using an HPLC (Agilent Technologies 1200) equipped with a reversed-phase C18 column (5 mm, 4.6 × 150 mm) and a UV photometric detector at 285 nm. The mobile phase was a mixture of methanol and ultrapure water (30![[thin space (1/6-em)]](https://www.rsc.org/images/entities/char_2009.gif) :
:![[thin space (1/6-em)]](https://www.rsc.org/images/entities/char_2009.gif) 70, v/v), and the flow rate was 1 mL min−1.
70, v/v), and the flow rate was 1 mL min−1.
2.5 Electrochemistry test
An electrochemical workstation with a conventional three-electrode cell (CHI620E, Chenhua Co. Ltd, Shanghai, China) was used to determine the electron accepting capacities (EAC) of the investigated particles at ambient temperature. The EAC values were calculated based on the integrated Coulomb ampere curves and sample mass. The working, counter, and reference electrodes were a graphite plate (3.5 cm × 5.0 cm), platinum mesh (4 cm × 4 cm), and saturated calomel electrode (SCE), respectively. The reactor was purged with N2 for 15 min before the electrochemical measurements to avoid the impact of the presence of O2. The investigated particles were prepared at 1 g L−1 in a phosphate buffer solution (0.1 M KCl, 0.1 M K2HPO4 and 0.1 M KH2PO4). An aliquot of 0.2 mL hematite suspension was added to the reactor on the electrochemical workstation, and each sample was measured twice.The electrochemical workstation of CHI660D (Chenhua Co. Ltd, Shanghai, China) was used to test the photocurrent density of the particles. Briefly, 20 mg particles were added in 1.5 mL anhydrous ethanol, and then the mixture was coated on a 1 cm × 1 cm conductive glass. A sample plate was obtained after placing the conductive glass in a 120 °C oven for 2 h. The electrolyte was Na2SO4 solution with a concentration of 0.1 M. The counter electrode, working electrode and reference electrode were platinum wire mesh, a sample plate and a silver chloride electrode, respectively. The light source was a high pressure mercury lamp (MUA-165, Japan) equipped with a 165 W ultraviolet light bulb (SHP-165, MEJIRO GENOSSEN, Japan).
2.6 Analysis of catechol degradation products
The degradation products of catechol were analyzed using a gas chromatograph-mass spectrometer (Agilent Technologies, model 7890A-5975C). The methanol extracts from the solid particles after catechol degradation were dried with N2, and then silylated with 100 μL of N,O-bis(trimethylsilyl)trifluoroacetamide and trimethylchlorosilane (BSTFA/TMCS 99![[thin space (1/6-em)]](https://www.rsc.org/images/entities/char_2009.gif) :
:![[thin space (1/6-em)]](https://www.rsc.org/images/entities/char_2009.gif) 1, Alfa Aesar) at 60 °C for 30 min. One μL of the derivatives were injected into the GC-MS equipped with a 30 m capillary column of 0.25 mm i.d. and 0.25 μm film thickness. The temperature program of the column oven was 80 °C for 1 min, from 80 to 180 °C at 4 °C min−1, from 180 to 320 °C at 10 °C min−1, and then maintained at 320 °C for 10 min. The mass-spectral library (NIST 14) was used to identify the products.
1, Alfa Aesar) at 60 °C for 30 min. One μL of the derivatives were injected into the GC-MS equipped with a 30 m capillary column of 0.25 mm i.d. and 0.25 μm film thickness. The temperature program of the column oven was 80 °C for 1 min, from 80 to 180 °C at 4 °C min−1, from 180 to 320 °C at 10 °C min−1, and then maintained at 320 °C for 10 min. The mass-spectral library (NIST 14) was used to identify the products.
3. Results and discussion
3.1 Characteristics of particles
The SEM images and EDX spectra of the particles are shown in Fig. 1. Compared to pure silica, many white specks were observed in nanoHMT and microHMT samples. Two kinds of hematite with different particle sizes were successfully distinguished in Fig. 1b (nanoHMT) and Fig. 1c (microHMT), as suggested by the corresponding sizes of the white specks. The observed hematite particle sizes were comparable to those of the original hematite particles. Some of the nanoHMT particles aggregated during the treatment and formed slightly larger ones. These white specks were iron-containing according to EDX measurements as presented in Fig. 1e and f. Similar white specks were not observed for pure silica particles (Fig. 1d).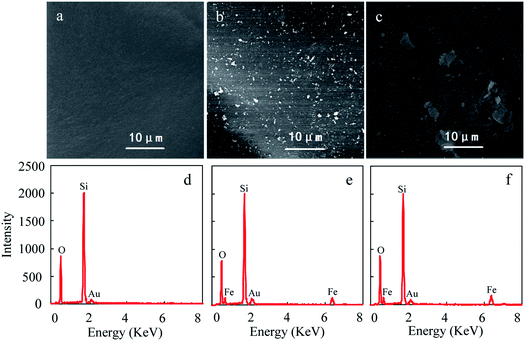 | ||
| Fig. 1 SEM images (a, b and c) and the EDX spectra (d, e and f) of pure silica (a and d), nanoHMT (b and e) and microHMT (c and f) particles. | ||
Specific surface areas are shown in Table S1.† One percent of hematite did not significantly alter the apparent surface area. However, different surface properties could be observed using XRD and XPS. The XRD patterns of the investigated particles are shown in Fig. S1a.† Both types of hematite showed obvious diffraction peaks. The main composition of the iron in the two samples were α-Fe2O3, according to a comparison with the standard cards. Although similar in structure, the XRD spectra of the two samples were quite different. The characteristic peak of pure nano hematite was relatively bumpy, and similar characteristic peaks could be seen on nanoHMT (diluted by silica). The characteristic peak of pure micro hematite was relatively sharp, which is also apparent in microHMT. The surface elemental compositions of these particles were analyzed using XPS (Fig. S1b†). The Fe 2p3/2 and 2p1/2 peaks were observed at 711.2 eV and 724.3 eV, respectively.26 The specific contents of the surface elements of the particles are shown in Table S2.† The main elements on the surface of the particles were oxygen and silicon and a small amount of iron, in which iron existed in the trivalent form.
3.2 Adsorption and degradation of catechol on different particles
At the end of the solid–aqueous equilibrium experiments, the solid particles were extracted using methanol three times. The adsorption isotherms of catechol on different particles are shown in Fig. S2.† The apparent adsorption on nanoHMT and microHMT was not significantly different from that of pure silica, as suggested by the overlapping sorption isotherms (Fig. S2†). Thus, the one percent of HMT in the mixed particles did not alter the adsorption.In the dry-state reaction system, catechol-loaded particles were stored both in the dark and exposed to UV light irradiation. The catechol-loaded particles were extracted using methanol right after the loading to quantify catechol concentrations in the solid phase, and different particles were compared at a similar catechol concentration. The concentration difference after a certain reaction duration was attributed to catechol degradation. It should be noted that different reaction durations were adopted for the dark and UV-light reactions, because of the much faster reaction under UV-light. As presented in Fig. 2a, the degradation percentages of catechol after 96 h in the dark were 68.4%, 51.9%, and 57.0% for pure silica, nanoHMT, and microHMT systems, respectively. Both nanoHMT and microHMT inhibited catechol degradation, and nanoHMT showed more obvious degradation inhibition. As discussed in previous studies,15 the degradation byproducts were stabilized as EPFRs and consequently the degradation was hindered, which will be discussed in detail in the next section.
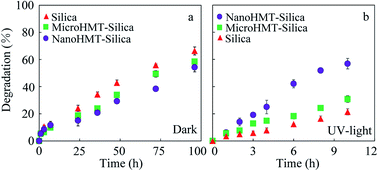 | ||
| Fig. 2 The degradation kinetics of catechol in pure silica, nanoHMT, and microHMT systems in the dark (a) and under UV light irradiation (b). | ||
As presented in Fig. 2b, the degradation percentages of catechol under continuous UV irradiation quickly reached 21.3%, 59.6%, and 29.0% in 10 h for pure silica, nanoHMT and microHMT systems, respectively. Obviously, UV light accelerated catechol degradation, and the acceleration was more significant by nanoHMT. HMT is a semiconductor, and could produce electron holes under UV light, which could promote the oxidation of organics.27 For example, the interactions between electrons and oxygen, or between holes and water (generated during catechol degradation) may both promote the generation of reactive oxygen species, which could react with catechol. The smaller and more distributed HMT particles (Fig. 1) in nanoHMT could provide more active sites and generate a greater number of electron holes under the excitation of UV light, resulting in faster catechol degradation than in the microHMT system. The photocurrent test (Fig. S3†) showed that nanoHMT has higher current density than microHMT under UV light which further confirmed our conclusion.
3.3 EPFRs in the catechol degradation system
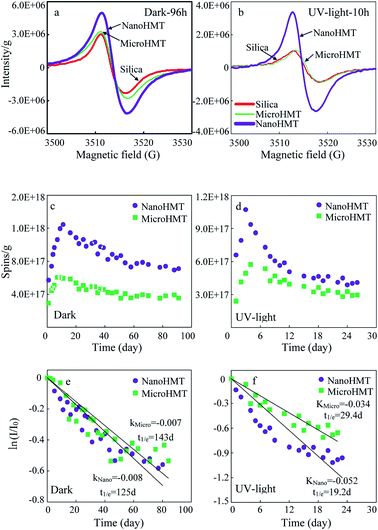
Significant EPR signals were detected in HMT-containing systems, both in the dark and under UV light. The representative EPR signals are presented in Fig. 3. Initially, the EPR signals were very weak before the reaction (Fig. S4a and b†). On the other hand, very strong free radical signals were detected after a certain reaction duration (Fig. 3a and b).EPR signals were continuously monitored and are presented in Fig. 3c and d. In all the investigated situations, EPR signals firstly increased to reach a maximum value, and then gradually decreased. The maximum values appeared at around 10 days in the dark, while much earlier at around 3 days under continuous UV light irradiation. Both in the dark and under UV light, nanoHMT always showed much higher EPR signals.
The variations of g-values with time are shown in Fig. S5a and b.† The g-values varied in the range of 2.0047 ± 0.0004, which indicated that these free radicals were dominated by oxygen-centered free radicals. No significant difference was observed in g-values between nanoHMT and microHMT systems. As the reaction progresses, the g-values increased slightly, indicating accumulation of more oxygen-centered EPFRs.
The peak width (ΔHP–P) decreased at the beginning of the reaction in the dark and then stabilized (Fig. S5c†), probably suggesting that the species of free radicals in the particles gradually decreased and then became stable. No obvious pattern was observed for ΔHP–P under UV light (Fig. S5d†), indicating a more complex chemical change.
In order to compare the stabilities of EPFRs on two hematite particles, we calculated the half-life of the EPFRs using the pseudo-first-order kinetic model (Fig. 3e and f). The highest EPFR intensity was defined as I0. Although the intensity of EPFR signals was much stronger on nanoHMT than on microHMT, their decay processes in the dark were similar with comparable half-lives (125 d vs. 143 d, Fig. 3e). However, under UV light, the decay of EPFRs on nanoHMT was much faster than that on microHMT, with half-lives of 19.2 d and 29.4 d, respectively (Fig. 3f). The more active reaction on nanoHMT under UV light irradiation was consistent with the earlier discussed more exposed active surface.
According to the generally discussed EPFR generation mechanisms, an electron transfer process is involved between organics and transition metals.28 We thus further tested the electron properties of nanoHMT and microHMT on an electrochemical workstation, and used XPS to study the changes of the iron valence state before and after the reaction.
According to the Coulomb ampere curve (Fig. 4a), nanoHMT can obtain a greater number of electrons than microHMT at the same mass. The calculated EAC value was over 7 times higher for nano HMT than for microHMT. Again, because of the more exposed active surface of nanoHMT, it can provide more active sites for electron transfer than microHMT. It is easy to speculate that more organic molecules will transfer electrons to hematite and form EPFRs on nanoHMT. This speculation is confirmed by our XPS measurements. As presented in Table S2,† about 40% of Fe(III) was reduced to Fe(II) in nanoHMT after the reaction, while only 30% in microHMT.
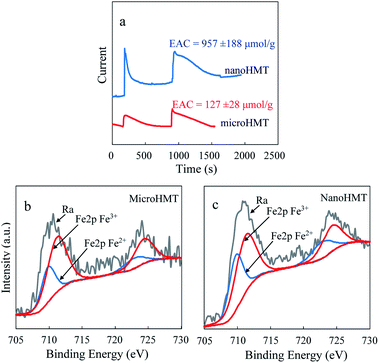 | ||
| Fig. 4 The particle characterization using an electrochemical workstation (a). The electron accepting capacities were calculated based on the Coulomb ampere curves. XPS spectra of Fe 2p binding energy peak regions for microHMT (b) and nanoHMT (c) after the reaction are representatively showed here and the overall XPS measurements are summarized in Table S2.† | ||
It then seems a quantitative analysis of the exposed surface active sites is essential to evaluate the potential for EPFR generation. Currently, no matched technique is available for this purpose. XPS analysis may serve as a semiquantitative alteration for the exposed surface of hematite. As presented in Table S2,† the surface Fe of nanoHMT was 8.8%, while that of microHMT was 2.2%. The 4-time difference of surface Fe could be clear evidence of more active surface sites for nanoHMT.
3.4 Possible generation mechanism of EPFRs
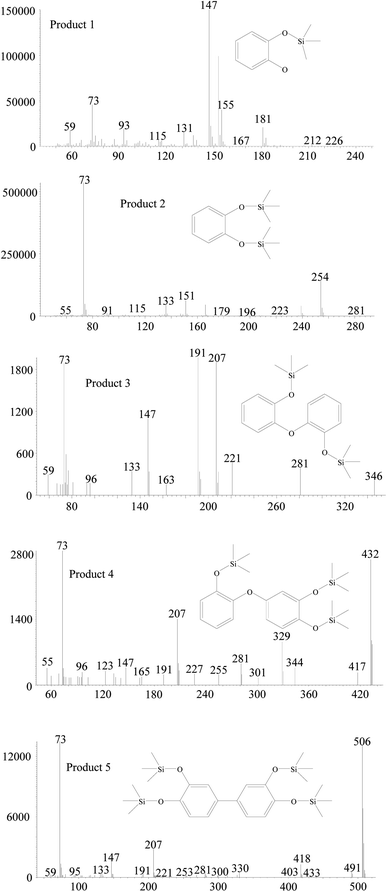
The degradation products in nanoHMT and microHMT were detected by GC-MS to further explore the generation mechanisms of EPFRs. Previous studies have shown that EPFRs were mainly involved with chemicals containing a benzene ring.28 We detected 5 intermediates with a benzene ring (Fig. 5) in this study. The main chemicals detected in HMT-containing systems were the silylation products of catechol (product 1 at 3.4 min and product 2 at 12.7 min), and three dimers detected at 20.0 min (product 3), 34.3 min (product 4) and 35.2 min (product 5). These benzene-containing degradation products were not detected in the silica systems, and other degradation products were similar as discussed in our previous studies.15,23,24All the GC-MS analyses were based on the same weight of particles, so that we could compare the abundance of the degradation products in different systems (Fig. S6†). In the dark, the abundances of the two dimers (product 4 and product 5) in the nanoHMT system were higher than that in the microHMT system. Under UV light conditions, the catechol (product 1) and one dimer product (product 5) were significantly higher on nanoHMT than on microHMT.
According to the structure of the monomer and dimer of degradation products, we speculated that oxygen-centered free radicals were formed during catechol degradation. The more abundance benzene-ring chemicals in nanoHMT systems may contribute to the stronger intensities of EPFRs. The possible generation mechanism of EPFRs is shown in Fig. 6. EPFR A is formed after chemical adsorption of catechol followed by electron transfer from catechol to HMT. This process is generally discussed in the literature.15 As recently discussed,23 dimer structures may be involved in EPFR formation, as also suggested by the structure of EPFRs B and C in Fig. 6. Phenoxyl free radicals may not be as stable as dimer free radicals.23 The more abundant EPFR A in nanoHMT under UV-light may explain why the half-life of EPFRs on nanoHMT was shorter than that on microHMT.
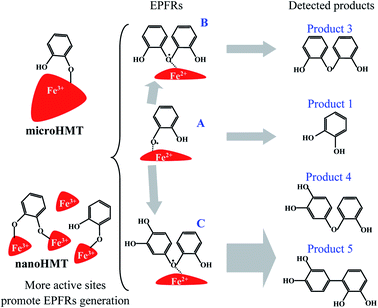 | ||
| Fig. 6 Possible degradation pathways and the formation mechanism of EPFRs on hematite. Catechol and its degradation byproducts are all involved in EPFR formation. | ||
It has been widely reported15 that the presence of transition metals alters the apparent degradation of organic chemicals on solid particles. The formation of EPFRs is generally involved in this degradation process. Previous studies tried to explain the extent of the degradation change of the precursors through the formation of EPFRs.19 However, as emphasized in our previous study23 as well as this current work, EPFR generation may not be solely dependent on one specific chemical. The degradation products, especially the molecular structures with phenol structures (including dimers or even more complicated structures), may all contribute to EPFR formation. Therefore, it is not possible to establish a relationship between EPFR intensities and the apparent degradation (or protection) of the precursors. For example, nanoHMT inhibited catechol degradation in the dark, and promoted catechol degradation under UV light, more extensively than microHMT. But EPFR signals were always stronger in nanoHMT systems than in microHMT systems. The apparent degradation may be balanced between the formation of EPFRs and the catalytic properties of transition metals.
4. Conclusions
According to this study, the amount of generated EPFRs is dependent on both the abundance of the preferred structures and the exposed active sites. The particle size of the transition metal oxide is of primary importance in controlling EPFR formation. However, the particle size distribution was not characterized in previous studies. Alternatively, measurements of the amount of exposed active sites will be very helpful to understand the interaction mechanisms between organic chemicals and metal oxides, especially the formation of EPFRs. We suggested that XPS analysis may provide a semiquantitative characterization of the surface active sites. However, it should be noted that the intensity of EPFR signals varied greatly with time. Accurate measurements of the EPFR-related active sites are still missing, largely because of the unknown EPFR generation and dissipation kinetics.Conflicts of interest
There are no conflicts of interest to declare.Acknowledgements
This research was supported by the National Natural Scientific Foundation of China (41725016, 41703121, and 41673098), a joint fund between NSFC-NCN (41961134002), the Yunnan Provincial Scientific Innovation Team of Soil Environment and Ecological Safety, the Kunming University of Science and Technology (2019HC008), and the UMass Amherst Conti Fellowship.References
- B. Dellinger, S. Loninicki, L. Khachatryan, Z. Maskos, R. W. Hall, J. Adounkpe, C. McFerrin and H. Truong, Formation and stabilization of persistent free radicals, Proc. Combust. Inst., 2007, 31, 521–528 CrossRef.
- J. Yang, B. Pan, H. Li, S. H. Liao, D. Zhang, M. Wu and B. S. Xing, Degradation of p-nitrophenol on biochars: role of persistent free radicals, Environ. Sci. Technol., 2016, 50, 694–700 CrossRef CAS.
- W. Gehling, L. Khachatryan and B. Dellinger, Hydroxyl radical generation from environmentally persistent free radicals (EPFRs) in PM2.5, Environ. Sci. Technol., 2014, 48, 4266–4272 CrossRef CAS.
- A. L. N. dela Cruz, R. L. Cook, B. Dellinger, S. M. Lomnicki, K. C. Donnelly, M. A. Kelley and D. Cosgriff, Assessment of environmentally persistent free radicals in soils and sediments from three superfund sites, Environ. Sci.: Processes Impacts, 2014, 16, 44–52 RSC.
- P. Herring, L. Khachatryan, S. Lomnicki and B. Dellinger, Paramagnetic centers in particulate formed from the oxidative pyrolysis of 1-methylnaphthalene in the presence of Fe(III)(2)O-3 nanoparticles, Combust. Flame, 2013, 160, 2996–3003 CrossRef CAS.
- J. M. Tedder, Which factors determine the reactivity and regioselectivity of free radical substitution and addition reactions?, Angew. Chem., Int. Ed. Engl., 1982, 21, 401–410 CrossRef.
- S. Mahne, G. C. Chuang, E. Pankey, L. Kiruri, P. J. Kadowitz, B. Dellinger and K. J. Varner, Environmentally persistent free radicals decrease cardiac function and increase pulmonary artery pressure, Am. J. Physiol.: Heart Circ. Physiol., 2012, 303, H1135–H1142 CrossRef CAS.
- J. R. Reed, G. F. Cawley, T. G. Ardoin, B. Dellinger, S. M. Lomnicki, F. Hasan, L. W. Kiruri and W. L. Backes, Environmentally persistent free radicals inhibit cytochrome P450 activity in rat liver microsomes, Toxicol. Appl. Pharmacol., 2014, 277, 200–209 CrossRef CAS.
- Y. Zhang, X. Guo, X. H. Si, R. X. Yang and X. Quan, Environmentally persistent free radical generation on contaminated soil and their potential biotoxicity to luminous bacteria, Sci. Total Environ., 2019, 687, 348–354 CrossRef CAS.
- L. Khachatryan and B. Dellinger, Environmentally persistent free radicals (EPFRs)-2. Are free hydroxyl radicals generated in aqueous solutions?, Environ. Sci. Technol., 2011, 45, 9232–9239 CrossRef CAS.
- S. H. Liao, B. Pan and H. Li, Detecting free radicals in biochars and determining their ability to inhibit the germination and growth of corn, wheat and rice seedlings, Environ. Sci. Technol., 2014, 48, 8581–8587 CrossRef CAS.
- T. Lieke, X. C. Zhang, C. E. W. Steinberg and B. Pan, Overlooked risks of biochars: persistent free radicals trigger neurotoxicity in caenorhabditis elegans, Environ. Sci. Technol., 2018, 52, 7981–7987 CrossRef CAS.
- B. Pan, H. Li, D. Lang and B. S. Xing, Environmentally persistent free radicals: occurrence, formation mechanisms and implications, Environ. Pollut., 2019, 248, 320–331 CrossRef CAS.
- Y. Liu, Q. Y. Dai, X. Q. Jin, X. D. Dong, J. Peng, M. Wu, N. Liang, B. Pan and B. S. Xing, Negative impacts of biochars on urease activity: high pH, heavy metals, polycyclic aromatic hydrocarbons, or free radicals?, Environ. Sci. Technol., 2018, 52, 12740–12747 CrossRef CAS.
- H. Li, B. Pan, S. H. Liao, D. Zhang and B. S. Xing, Formation of environmentally persistent free radicals as the mechanism for reduced catechol degradation on hematite-silica surface under UV irradiation, Environ. Pollut., 2014, 188, 153–158 CrossRef CAS.
- J. Liu, C. I. Pearce, S. Liang, Z. Wang and K. M. Rosso, Particle Size Effect and the Mechanism of Hematite Reduction by the Outer Membrane Cytochrome OmcA of Shewanella Oneidensis MR-1, Geochim. Cosmochim. Acta, 2016, 193, 160–175 CrossRef CAS.
- E. Vejerano, S. Lomnicki and B. Dellinger, Formation and stabilization of combustion-generated environmentally persistent free radicals on an Fe(III)(2)O-3/silica surface, Environ. Sci. Technol., 2011, 45, 589–594 CrossRef CAS.
- L. L. Yang, G. R. Liu, M. H. Zheng, R. Jin, Y. Y. Zhao, X. L. Wu and Y. Xu, Pivotal roles of metal oxides in the formation of environmentally persistent free radicals, Environ. Sci. Technol., 2017, 51, 12329–12336 CrossRef CAS.
- H. Z. Jia, S. Zhao, Y. F. Shi, L. Y. Zhu, C. Y. Wang and V. K. Sharma, Transformation of polycyclic aromatic hydrocarbons and formation of environmentally persistent free radicals on modified montmorillonite: the role of surface metal ions and polycyclic aromatic hydrocarbon molecular properties, Environ. Sci. Technol., 2018, 52, 5725–5733 CrossRef CAS.
- E. Vejerano, S. Lomnicki and B. Dellinger, Lifetime of combustion-generated environmentally persistent free radicals on Zn(II)O and other transition metal oxides, J. Environ. Monit., 2012, 14, 2803–2806 RSC.
- S. Lomnicki, H. Truong, E. Vejerano and B. Dellinger, Copper oxide-based model of persistent free radical formation on combustion-derived particulate matter, Environ. Sci. Technol., 2008, 42, 4982–4988 CrossRef CAS.
- E. Vejerano, S. M. Lomnicki and B. Dellinger, Formation and stabilization of combustion-generated, environmentally persistent radicals on Ni(II)O supported on a silica surface, Environ. Sci. Technol., 2012, 46, 9406–9411 CrossRef CAS.
- P. Yi, Q. Chen, H. Li, D. Lang, Q. Zhao, B. Pan and B. S. Xing, A comparative study on the formation of environmentally persistent free radicals (EPFRs) on hematite and goethite: contribution of various catechol degradation byproducts, Environ. Sci. Technol., 2019, 53, 13713–13719 CrossRef CAS.
- H. Li, H. Y. Guo, B. Pan, S. H. Liao, D. Zhang, X. K. Yang, C. G. Min and B. S. Xing, Catechol degradation on hematite/silica-gas interface as affected by gas composition and the formation of environmentally persistent free radicals, Sci. Rep., 2016, 6, 24494 CrossRef CAS.
- C. Baumanis, J. Z. Bloh, R. Dillert and D. W. Bahnemann, Hematite photocatalysis: dechlorination of 2,6-dichloroindophenol and oxidation of water, J. Phys. Chem. C, 2011, 115, 25442–25450 CrossRef CAS.
- T. Yamashita and P. Hayes, Analysis of XPS spectra of Fe2+ and Fe3+ ions in oxide materials, Appl. Surf. Sci., 2008, 254, 2441–2449 CrossRef CAS.
- C. Laberty and A. Navrotsky, Energetics of stable and metastable low-temperature iron oxides and oxyhydroxides, Geochim. Cosmochim. Acta, 1998, 62, 2905–2913 CrossRef CAS.
- E. P. Vejerano, G. Y. Rao, L. Khachatryan, S. A. Cormier and S. Lomnicki, Environmentally persistent free radicals: insights on a new class of pollutants, Environ. Sci. Technol., 2018, 52, 2468–2481 CrossRef CAS.
Footnote |
| † Electronic supplementary information (ESI) available. See DOI: 10.1039/d0em00416b |
| This journal is © The Royal Society of Chemistry 2021 |

