 Open Access Article
Creative Commons Attribution 3.0 Unported Licence
Efficient electrochemical synthesis of a manganese-based metal–organic framework for H2 and CO2 uptake†
Aisha
Asghar
 a,
Naseem
Iqbal
 *a,
Tayyaba
Noor
b,
Benson M.
Kariuki
 c,
Luke
Kidwell
c and
Timothy L.
Easun
 *c
*c
aU.S.-Pakistan Centre for Advanced Studies in Energy (USPCAS-E), National University of Sciences & Technology (NUST), H-12, Islamabad, 44000, Pakistan. E-mail: naseem@uspcase.nust.edu.pk
bSchool of Chemical & Materials Engineering (SCME), National University of Sciences & Technology (NUST), H-12, Islamabad, 44000, Pakistan
cSchool of Chemistry, Cardiff University, Main Building, Park Place, Cardiff, CF10 3AT, UK. E-mail: EasunTL@cardiff.ac.uk
First published on 18th January 2021
Abstract
In this study Mn–DABDC (DABDC = diaminobenzenedicarboxylate, or 2,5-diaminoterephthalate) MOF was synthesised both via an electrochemical method, to make Mn–DABDC(ES), and via a conventional solvothermal approach, to make Mn–DABDC(ST). A Mn–BDC (BDC = benzenedicarboxylate) MOF was also prepared by a conventional solvothermal method for gas uptake capacity comparison. Investigation of the electrochemical synthesis parameters demonstrated that current density, electrolyte amount and reaction time were the most significant factors affecting crystal synthesis and product yield. The best conditions found for obtaining a crystalline MOF with high yield (93%) were 70 mA current, electrolyte 2.7 mmol/30 ml DMF and 2 h of reaction time. These optimized electrochemical conditions allow for a relatively fast MOF synthesis, important for reducing synthesis cost compared with conventional hydrothermal and solvothermal methods. The Mn–DABDC(ES) MOF sample was fully characterized to analyse its structure, thermal stability and surface area. The electrochemically synthesized MOF has high carbon dioxide uptake (92.4 wt% at 15 bar and 273 K) and hydrogen uptake (12.3 wt% at 80 bar and 77 K). This is the first amine-based manganese MOF synthesized electrochemically, and the method has excellent potential for reducing large-scale MOF production costs.
Introduction
Coordination chemistry has evolved as a most promising route to porous materials with precisely decorated interiors to obtain specific properties for versatile applications.1 One of the most highly studied applications of metal–organic frameworks (MOFs) is the capture of CO2 to address global energy and environmental issues.2,3 Metal–organic frameworks have metal coordination sites bridged by organic ligands in highly ordered networks that often afford well defined structures, high crystallinity and large surface areas that can be used in catalysis, or gas separation applications.4,5 Over the last two decades developments in MOF synthesis have enabled MOFs to become promising candidates for carbon dioxide capture, however there is often poor carbon dioxide gas selectivity from flue gas streams.2,6 A notable development is in the functionalization of MOF structures, including selective functional group insertion within any given framework to serve specific end functions and impart desirable properties to the MOF materials.2,7,8 Amine sites in particular show great affinity towards carbon dioxide and are known to be highly effective for CO2 adsorption while also being amenable to use under dry or humid conditions.7 We have recently reported the modification of a copper-based MOF during synthesis by doping with hexamethylenetetramine, resulting in the enhancement of carbon dioxide sorption over the unmodified framework.9 In another study we reported that amine post synthetic modification on a Mn–DOBDC framework (DOBDC = 2,5-dihydroxyterepthalate) enhances water stability and carbon dioxide uptake of the MOF.10A major challenge in preparing MOFs for CO2 capture applications is still the energy intensive, tedious and laborious conventional solvothermal process for MOF synthesis. Electrochemical synthesis of MOFs was first reported by BASF in 2005, using anodic dissolution to synthesise the copper-based framework HKUST-1.11,12 Most subsequent examples using this method have focussed on Cu and Zn frameworks, although examples exploiting Al and Fe have been reported.13–17 Recent reports include Pirzadeh and co-workers, who electrochemically synthesized a Cu3(BTC)2 metal–organic framework for CO2 and CH4 separation,18 and, in a hybrid approach, Mitra et al. grew Cu-based MOFs onto modified thin-film electrodes to study their electrochemical properties.19 The electrochemical MOF synthesis process has advantages over conventional MOF syntheses including the potential for shorter reaction times and lower energy consumption with a relatively simple equipment setup.18 Perhaps the most attractive feature of electrochemical synthesis is the mild reaction conditions, since these reactions can be performed at ambient pressure and temperature. Despite these advantages, it is still an under-exploited approach, especially in the synthesis of functionalised framework materials.20 This study demonstrates the synthesis of a new amine-functionalised Mn–DABDC MOF using electrochemical synthesis to cut synthesis costs, important for future scale-up. The prepared material was fully characterized to analyse its structure, thermal stability and surface area. For comparison, a Mn–BDC MOF that lacks amine functionalisation was also synthesized using a traditional solvothermal method to compare CO2 and H2 adsorption of these MOFs.
Experimental
Materials
All the chemicals were purchased from Merck Sigma Aldrich and used as received.Synthesis of {Mn2(BDC)2(DMF)2}∞ (Mn–BDC)
Mn–BDC MOF was prepared using a conventional solvothermal method reported by Huiping et al. in 2016, with slight modifications.21 Equimolar quantities (1![[thin space (1/6-em)]](https://www.rsc.org/images/entities/char_2009.gif) :
:![[thin space (1/6-em)]](https://www.rsc.org/images/entities/char_2009.gif) 1) of Mn(NO3)2·6H2O (287 mg, 1 mmol) and terephthalic acid (160 mg, 1 mmol) were dissolved in 10 ml DMF in a 50 ml beaker. The contents were ultra-sonicated at 45 °C for 2 hours then the solution was transferred to 23 ml Teflon vials. These were each sealed in a Parr autoclave and heated in an oven at 110 °C for 24 hours to yield white crystalline material. Crystals obtained were washed thrice with DMF then thrice with THF (5 ml for each wash). The resulting crystals were dried overnight at room temperature to get 83% yield (371 mg). The sample was activated in vacuum oven at 130 °C for 12 hours before further analysis.
1) of Mn(NO3)2·6H2O (287 mg, 1 mmol) and terephthalic acid (160 mg, 1 mmol) were dissolved in 10 ml DMF in a 50 ml beaker. The contents were ultra-sonicated at 45 °C for 2 hours then the solution was transferred to 23 ml Teflon vials. These were each sealed in a Parr autoclave and heated in an oven at 110 °C for 24 hours to yield white crystalline material. Crystals obtained were washed thrice with DMF then thrice with THF (5 ml for each wash). The resulting crystals were dried overnight at room temperature to get 83% yield (371 mg). The sample was activated in vacuum oven at 130 °C for 12 hours before further analysis.
Electrochemical synthesis of {Mn3(DABDC)3(DMF)4}∞ (Mn–DABDC(ES))
For electrochemical synthesis of Mn–DABDC, 2,5-diaminoterephthalic acid (588 mg, 3 mmol) was dissolved in 30 ml DMF. In another beaker, NaNO3 (225 mg, 2.7 mmol) was mixed with 10 ml distilled water to serve as a conductive electrolyte for the reaction. These mixtures were combined and ultrasonicated for 1 hour at room temperature to ensure complete mixing of contents. Mn strips were prepared for reaction (10 cm long × 2 cm wide × 0.4 cm thick). Polishing was done with sandpaper (400 grit) to remove any oxide layer and washing with distilled water followed by ethanol.The electrochemical synthesis reaction was performed by dipping these Mn strips (3 cm depth) in the reaction mixture keeping them 2 cm apart. A direct current (DC) supply was then attached to the electrodes and the current adjusted to 70 mA. As the reaction proceeded, light brown crystals were observed in the solution. The reaction was performed at ambient temperature and pressure (i.e. 20–22 °C and 1 atm). After 2 h, the product was collected, filtered and washed with DMF three times and then three times with THF (5 ml for each wash). The product obtained was dried at 60 °C in the oven for 4 hours to obtain 93% yield (1.29 g). The sample was activated in a vacuum oven at 130 °C for 12 hours before further analysis. This electrochemically synthesised material is named Mn–DABDC(ES) throughout the manuscript. Note: a series of reactions were performed to optimize time of reaction, current density and electrolyte concentration to obtain the best Mn–DABDC(ES) MOF yield; details of this series are in the ESI and Fig. S1.†
Solvothermal synthesis of {Mn3(DABDC)3(DMF)4}∞ (Mn–DABDC(ST))
Samples of the Mn–DABDC framework were also prepared using the conventional solvothermal method to compare synthetic outcomes with the product obtained by electrochemical synthesis. Equimolar quantities (1![[thin space (1/6-em)]](https://www.rsc.org/images/entities/char_2009.gif) :
:![[thin space (1/6-em)]](https://www.rsc.org/images/entities/char_2009.gif) 1) of Mn (NO3)2·6H2O (287 mg, 1 mmol) and 2,5-diaminoterephthalic acid (196 mg, 1 mmol) were dissolved in 10 ml DMF. After ultra-sonication at 45 °C for 2 hours the solution was transferred to 23 ml Teflon vials and sealed in a Parr autoclave and heated in an oven at 120 °C for 22 hours to yield light brown crystals. Crystals obtained were washed thrice with DMF then thrice with THF (5 ml for each wash). The resulting crystals were dried overnight at room temperature to obtain 78% yield (377 mg). The sample was activated in vacuum oven at 130 °C for 12 hours before further analysis. This solvothermally synthesised material is named Mn–DABDC(ST) throughout the manuscript.
1) of Mn (NO3)2·6H2O (287 mg, 1 mmol) and 2,5-diaminoterephthalic acid (196 mg, 1 mmol) were dissolved in 10 ml DMF. After ultra-sonication at 45 °C for 2 hours the solution was transferred to 23 ml Teflon vials and sealed in a Parr autoclave and heated in an oven at 120 °C for 22 hours to yield light brown crystals. Crystals obtained were washed thrice with DMF then thrice with THF (5 ml for each wash). The resulting crystals were dried overnight at room temperature to obtain 78% yield (377 mg). The sample was activated in vacuum oven at 130 °C for 12 hours before further analysis. This solvothermally synthesised material is named Mn–DABDC(ST) throughout the manuscript.
Equipment and characterization
Electrochemical syntheses were performed under constant current or voltage using a RIGOL DC Power supply and RIGOL millimeter DM3058E. Single crystal X-ray diffraction data for Mn–DABDC and Mn–BDC MOFs were collected on an Agilent SuperNova Dual Atlas diffractometer with Mo and Cu sources and a CCD detector. Data reduction and integration was performed using CrysAlisPro. Powder X-ray diffraction (PXRD) patterns were collected on an X'PertPro Panalytical Chiller 59 diffractometer using copper Kα (1.5406 Å) radiation. A 2θ range from 5 to 40 degrees was used to record the diffraction pattern. A SHIMADZU IR Affinitt-1S spectrometer was used to obtain IR spectra. Thermogravimetic analyses (TGA) were performed using a PerkinElmer Pyris 1 TGA equipment. The temperature was increased from 25 °C to 700 °C at a heating rate of 5 °C min−1 under a flow of air (20 ml min−1). Elemental analyses were performed using a FlashSmart NC ORG elemental analyser.CO2 adsorption experiments were performed on a Quantachrome Isorb-HP100 volumetric type sorption analyser. Samples were degassed at 130 °C under vacuum for 12 hours and then backfilled with helium gas prior to gas sorption studies. CO2 sorption studies were performed at two selected temperatures, 273 K and 298 K, over a pressure range of 0.5–15 bar. H2 adsorption studies were performed at 273 K and 77 K, over a pressure range of 0.5–80 bar. N2 adsorption studies of prepared samples were conducted to analyse surface area and pore volume using a Quantachrome Nova 2200e at 77 K at a relative pressure of P/P0 = 0.05–1.0.
Results and discussion
There are several known structures containing Mn(II) nodes and the BDC linker, the earliest being MOF-73,21–23 but these were made using, and consist of, different metal![[thin space (1/6-em)]](https://www.rsc.org/images/entities/char_2009.gif) :
:![[thin space (1/6-em)]](https://www.rsc.org/images/entities/char_2009.gif) linker ratios and solvents to our material; herein we have formed a new Mn–BDC framework. Briefly, our Mn–BDC framework crystallises in a monoclinic geometry with a = 13.4484(4) Å, b = 10.1799(3) Å and c = 17.6560(5) Å, and α = 90°, β = 90.271(3)°, γ = 90°. Mn–BDC is composed of a ratio of 2
linker ratios and solvents to our material; herein we have formed a new Mn–BDC framework. Briefly, our Mn–BDC framework crystallises in a monoclinic geometry with a = 13.4484(4) Å, b = 10.1799(3) Å and c = 17.6560(5) Å, and α = 90°, β = 90.271(3)°, γ = 90°. Mn–BDC is composed of a ratio of 2![[thin space (1/6-em)]](https://www.rsc.org/images/entities/char_2009.gif) :
:![[thin space (1/6-em)]](https://www.rsc.org/images/entities/char_2009.gif) 2
2![[thin space (1/6-em)]](https://www.rsc.org/images/entities/char_2009.gif) :
:![[thin space (1/6-em)]](https://www.rsc.org/images/entities/char_2009.gif) 2 Mn
2 Mn![[thin space (1/6-em)]](https://www.rsc.org/images/entities/char_2009.gif) :
:![[thin space (1/6-em)]](https://www.rsc.org/images/entities/char_2009.gif) BDC
BDC![[thin space (1/6-em)]](https://www.rsc.org/images/entities/char_2009.gif) :
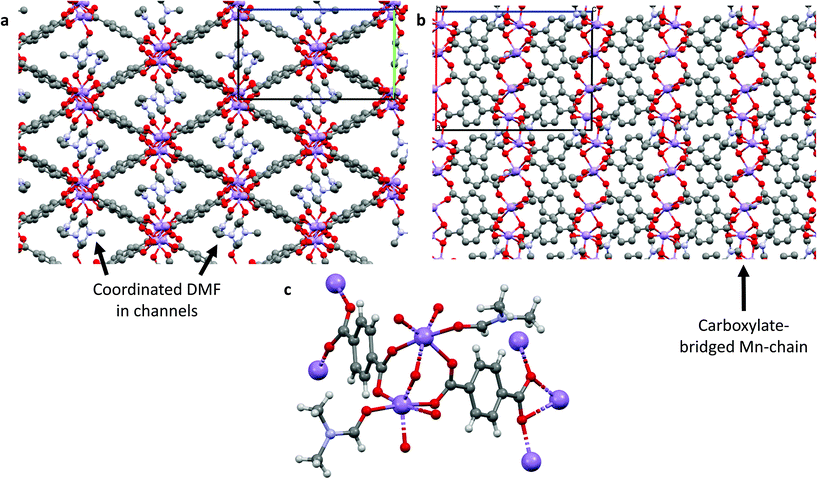
:![[thin space (1/6-em)]](https://www.rsc.org/images/entities/char_2009.gif) DMF and has broadly octahedral coordination at each Mn to one oxygen from a DMF molecule and five oxygens from the carboxylates of the surrounding BDC linkers, which bridge Mn atoms to form chains down the a-axis. By comparison, Mn–DABDC(ES) has a ratio of 3
DMF and has broadly octahedral coordination at each Mn to one oxygen from a DMF molecule and five oxygens from the carboxylates of the surrounding BDC linkers, which bridge Mn atoms to form chains down the a-axis. By comparison, Mn–DABDC(ES) has a ratio of 3![[thin space (1/6-em)]](https://www.rsc.org/images/entities/char_2009.gif) :
:![[thin space (1/6-em)]](https://www.rsc.org/images/entities/char_2009.gif) 3
3![[thin space (1/6-em)]](https://www.rsc.org/images/entities/char_2009.gif) :
:![[thin space (1/6-em)]](https://www.rsc.org/images/entities/char_2009.gif) 4 Mn
4 Mn![[thin space (1/6-em)]](https://www.rsc.org/images/entities/char_2009.gif) :
:![[thin space (1/6-em)]](https://www.rsc.org/images/entities/char_2009.gif) DABDC
DABDC![[thin space (1/6-em)]](https://www.rsc.org/images/entities/char_2009.gif) :
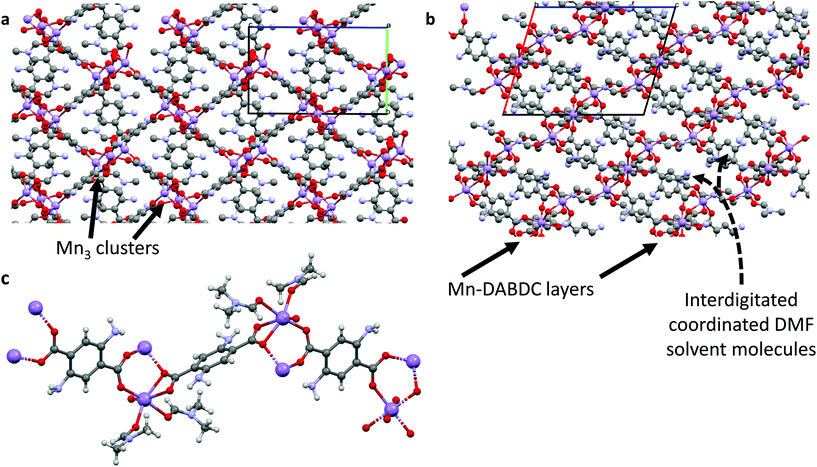
:![[thin space (1/6-em)]](https://www.rsc.org/images/entities/char_2009.gif) DMF, and crystallizes in monoclinic geometry with a = 13.2985(7) Å, b = 10.0194(7) Å and c = 16.6456(7) Å, and α = 90°, β = 106.404(5)°, γ = 90°. The Mn atoms form linear Mn3 clusters in which each Mn atom is coordinated by six oxygen atoms in a distorted octahedral arrangement; the two outer Mn atoms are each capped by two DMF molecules and coordinated by three carboxylate groups, with the carboxylates bridging the outer Mn atoms to the central Mn atom. These clusters are bridged by DABDC linkers in layers, with the layers separated by interdigitated cluster-capping DMF molecules. Further details are given in Table S2† and the structures for Mn–BDC and Mn–DABDC(ES) are shown in Fig. 1 & 2 respectively.
DMF, and crystallizes in monoclinic geometry with a = 13.2985(7) Å, b = 10.0194(7) Å and c = 16.6456(7) Å, and α = 90°, β = 106.404(5)°, γ = 90°. The Mn atoms form linear Mn3 clusters in which each Mn atom is coordinated by six oxygen atoms in a distorted octahedral arrangement; the two outer Mn atoms are each capped by two DMF molecules and coordinated by three carboxylate groups, with the carboxylates bridging the outer Mn atoms to the central Mn atom. These clusters are bridged by DABDC linkers in layers, with the layers separated by interdigitated cluster-capping DMF molecules. Further details are given in Table S2† and the structures for Mn–BDC and Mn–DABDC(ES) are shown in Fig. 1 & 2 respectively.
FTIR spectra of the prepared materials confirmed the presence of representative functional groups indicative of Mn–BDC and Mn–DABDC MOF formation (Fig. S2†). Sharp peaks representative of symmetric and asymmetric stretching of carboxylates bonded to Mn are observed at 1535 cm−1 and 1367 cm−1 in the Mn–DABDC sample.3 Both samples contain a broad band at around 3250 cm−1, which can be attributed to O–H stretching vibrations of adsorbed atmospheric water.24,25 In addition to the C–H stretches in both samples around 3000 cm−1, Mn–DABDC also shows an N–H stretch at ∼3650 cm−1.
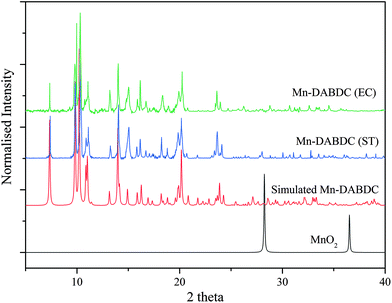
The PXRD patterns of the as-synthesized Mn–BDC, Mn–DABDC(ES), Mn–DABDC(ST), and those simulated from single crystal XRD are shown in Fig. 3 and 4. PXRD patterns indicate in all cases the formation of highly crystalline material. PXRD patterns for Mn–DABDC produced from solvothermal synthesis and electrochemical synthesis indicate the same framework is synthesized with both methods, and in almost all solid products produced during the electrochemical parameter optimisation the Mn–DABDC MOF phase was formed with no apparent secondary phases (see ESI and Fig. S2†). Exceptions to this were the presence of a peak at 25° 2θ indicating unreacted crystalline DABDC linker remaining when current density was too low for efficient conversion to product (Fig. S2 pattern S1†), and the presence of small additional peaks, most notably around 11–12° and 25–27° 2θ, in the sample with the lowest quantity of electrolyte (Fig. S2 pattern S4†). There is also good agreement between the simulated and as-synthesized (optimised synthesis) PXRD patterns, indicating that the single crystals studied are representative of the bulk samples, which in the optimised syntheses exhibit good phase purity and absence of manganese dioxide.26 The optimised product yield of Mn–DABDC obtained by electrochemical synthesis for 2 hours at room temperature was 93%, compared with only 78% obtained from the 22 hours, 120 °C solvothermal method. This improvement is possibly as a result of electrochemical delivery of metal ions from the manganese electrode at a rate determined by the electrolysis, combined with ready provision of nitrate counterions from the excess present as part of the electrolyte. Indeed, the nitrate ions can be recycled during the synthesis rather than having to be supplied stoichiometrically as part of the Mn(NO3)2 salt used in the solvothermal synthesis. These differences evidently have a marked impact on the reaction kinetics and hence may affect the resulting crystal size and defect content. The SEM images of Mn–BDC and Mn–DABDC are therefore presented in Fig. S5.† SEM results show a range of particle morphologies including flat hexagonal rods stacked on each other for Mn–DABDC(ES), a mixture of hexagonal rods and flake structures for Mn–DABDC(ST), and loose laminar rod-like structures for Mn–BDC. The surface roughness of Mn–DABDC(ST) visually appears greater than that of Mn–DABDC(ES). The electrochemically-synthesised crystallites are quite clearly larger than those formed in both solvothermal syntheses, with the largest Mn–DABDC(ES) rod diameters reaching ∼8 μm in contrast to 2–3 μm for Mn–DABDC(ST) and only 1–2 μm for Mn–BDC. Both changes in morphology and size of the electrochemically synthesised framework are consistent with a different crystal growth mechanism, a feature of interest for future study beyond the scope of this present work.
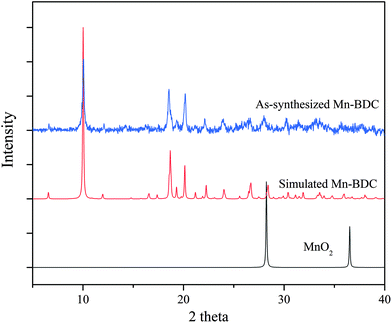 | ||
| Fig. 4 Experimental (blue) and simulated (red) PXRD patterns for Mn–BDC, and PXRD pattern for MnO2 (black). | ||
Thermogravimetric analysis (TGA) was performed on Mn–BDC and Mn–DABDC (Fig. S4†). Some weight loss was observed below 100 °C for both MOFs indicating there was little surface adsorbed moisture.27–29 There is a weight loss step between approx. 125–245 °C for both MOFs which we ascribe to the loss of coordinated DMF from the MOF structures.6,30 There is prominent two-step DABDC linker degradation in the Mn–DABDC sample as the temperature increases above approximately 325 °C. No further weight losses were observed for Mn–DABDC above 560 °C, indicating residual metal oxide, while Mn–BDC MOF decomposed completely to the oxide at 425 °C, a notably lower temperature than Mn–DABDC.
CO2 and H2 adsorption capacities of Mn–BDC, Mn–DABDC(ES) and Mn–DABDC(ST)
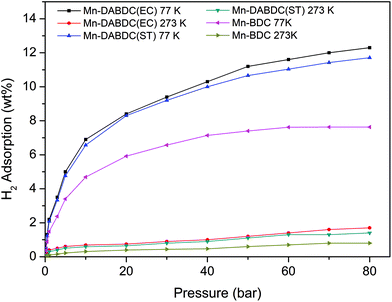
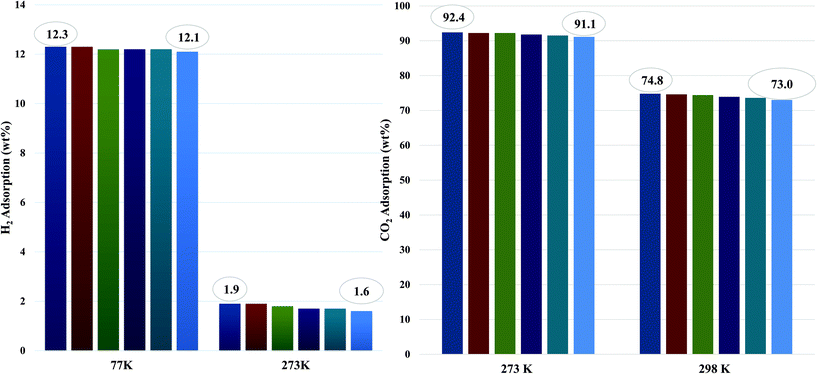
The CO2 adsorption capacity for both MOF materials was evaluated by monitoring pseudo equilibrium adsorption uptakes. Samples were first degassed at 130 °C for 12 hours. 200 mg of each sample was used for three consecutive adsorption–desorption cycles at 273 K and 298 K with adsorbate pressure ranging between 0.1 to 15 bar. The CO2 capacities calculated at 273 K and 15 bar pressure were 11.5 mmol g−1 and 21 mmol g−1 for Mn–BDC and Mn–DABDC(ES), respectively. This trend also occurs for adsorption capacities recorded at 298 K (Fig. 5). Hydrogen uptake of Mn–DABDC(ES) MOF was 12.3 wt% at 80 bar pressure and 77 K (Fig. 6), and a pore size of 3.53 Å was calculated from gas sorption data. Moderate Qst values were calculated for both gases in Mn–DABDC(ES) (Fig. S6†) which demonstrated excellent regenerability under moderate desorption conditions (degassing under vacuum for one hour), with only a small decline in CO2 and H2 adsorption capacity over six successive test cycles (Fig. 7).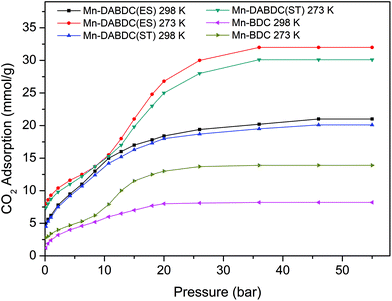 | ||
| Fig. 5 CO2 adsorption isotherms (mmol g−1) for Mn–DABDC(ES), Mn–DABDC(ST) and Mn–BDC at 273 K and 298 K. | ||
A comparison can also be made against the solvothermally-synthesised Mn–DABDC(ST) material. The CO2 uptake at 55 bar of Mn–DABDC(ES) is slightly higher at both temperatures than that of Mn–DABDC(ST) (an increase of 6.3% at 273 K and 4.5% at 298 K) and markedly higher than that of Mn–BDC (an increase of 130% at 273 K and 136% at 298 K). The H2 uptake of Mn–DABDC(ES) is similarly slightly higher than that of Mn–DABDC(ST) (an increase of 5% at 77 K and 21% at 273 K) and again markedly higher than that of Mn–BDC (an increase of 61% at 77 K and 113% at 273 K).
To put this work in a broader context, Table 1 provides a comparison of amine-based metal–organic frameworks for uptake of carbon dioxide and hydrogen. In previous studies, we reported amine-modification of Cu–BDC, a copper-based MOF, by doping the synthesis with hexamethylenetetramine (HMTA).9 Despite a reduction in BET surface area from 708 to 590 m2 g−1, this modification afforded a 3- and 4-fold increase in 273 K CO2 uptake over the unmodified Cu–BDC framework, at 1 and 14 bar respectively. We have also reported a post-synthetic modification approach, attaching ethylenediamine (EDA) to Mn–DODC, a manganese-based framework.10 In that study, modification only reduced the BET surface area a small amount, from 1256 to 1203 m2 g−1, but again increased the 273 K CO2 uptake, albeit by a smaller multiplier (see Table 1). However, it is notable in the present study that the incorporation of two primary amine groups per linker in Mn–DABDC(ES) results not only in the largest BET surface area of all three studies, 1453 m2 g−1, but in the highest overall CO2 uptake of our amine-containing frameworks. At 273 K the CO2 uptake of Mn–DABDC(ES) at 1 bar is 40.9 wt% and at 15 bar it is 92.4 wt%. These values surpass those of many related small-pore frameworks reported in the literature; some examples are given in Table 1. Given that the Qst values at zero loading for EDA-MnDOBDC and Mn–DABDC(ES) are, perhaps unsurprisingly, essentially the same (32 kJ mol−1) and most likely result from CO2 binding to the primary amines in both cases, the improved performance of Mn–DABDC(ES) at higher pressure may be attributable in part to the greater surface area, and in part to the greater density of amine sites in the framework.
| Material | BET surface area (m2 g−1) | Temperature (K) | Pressure (bar) | CO2 adsorption (wt%) | Q st (kJ mol−1) | Ref. |
|---|---|---|---|---|---|---|
| Cu–BDC | 708 | 273 | 1 | 5.28 | — | 9 |
| 14 | 17.4 | |||||
| Cu–BDC⊃HMTA | 590 | 273 | 1 | 21.2 | 29.8 | 9 |
| 14 | 52.8 | |||||
| Mn–DOBDC | 1256 | 273 | 1 | 33.0 | 29.0 | 10 |
| 15 | 57.3 | |||||
| 298 | 1 | 26.4 | ||||
| 15 | 44.5 | |||||
| EDA–Mn–DOBDC | 1203 | 273 | 1 | 40.9 | 32.0 | 10 |
| 15 | 70.3 | |||||
| 298 | 1 | 33.5 | ||||
| 15 | 57.2 | |||||
| Amino-Zr-MOF | 1220 | 273 | 1 | 19.62 | 29.3 | 31 |
| 1395 | 296 | 12.54 | ||||
| Zn2(NH2BDC)2 (dpNDI) | 897 | 273 | 1 | 29.04 | 46.5 | 32 |
| fcu-MOF | 605.8 | 273 | 1 | 5.59 | 25.4 | 33 |
| 298 | 4.10 | |||||
| Mg–ABDC | 63 | 273 | 1.3 | 6.18 | — | 34 |
| Co–ABDC | 71 | 273 | 1.3 | 4.97 | — | 34 |
| Sr–ABDC | 2.5 | 273 | 1.3 | 0.8 | — | 34 |
| Amino MIL-101 (Al) | 2100 | 298 | 29.6 | 62.0 | — | 15 |
| UiO-66-NH2-GO | 868 | 273 | 1 | 3.9 | — | 35 |
| Zn4O(NH2-BDC)2 | 2446 | 77 | 1 | — | — | 36 |
| UMCM-1-NH2 | 3917 | 77 | 1 | — | 4.6 | 37 |
| MIL-101-PEI (polyethylenimine) | 608 | 298 | 0.15 | 4.2 | — | 38 |
| IRMOF-74-III-NH2 | 2720 | 298 | 1 | 10.4 | 39 | |
| MFM-188 | 2568 | 298 | 1 | 23.7 | 20.8 | 40 |
| NOTT-125 | 2471 | 298 | 1 | 18.2 | 25.4 | 41 |
| Mn–DABDC | 1453 | 273 | 1 | 40.9 | 32 | Present study |
| 273 | 15 | 92.4 | ||||
| 298 | 1 | 27.3 | ||||
| 298 | 15 | 74.8 | ||||
| Mn–BDC | 667 | 273 | 1 | 14.9 | 33.5 | Present study |
| 273 | 15 | 50.6 | ||||
| 298 | 1 | 10.5 | ||||
| 298 | 15 | 30.8 |
Conclusions
Mn–DABDC(ES) was successfully produced in good yield using electrochemical synthesis. Synthesis conditions were optimized to get a maximum product yield of 93%. Here, manganese metal cations were produced in situ using Mn electrodes, eliminating the need for the MOF-precursor metal salt as required in conventional solvothermal and hydrothermal MOF production approaches, since the counter-ions are transiently provided by the electrolyte solution and hence can be continuously recycled in the synthesis. SEM results revealed well-formed flat hexagonal rod-like crystals for Mn–DABDC(EC), larger than the rods produced for Mn–DABDC(ST) and Mn–BDC. The three MOF materials were tested for carbon dioxide and hydrogen gas uptake. Mn–DABDC(ES) demonstrated high carbon dioxide (92.4 wt% at 15 bar pressure and 273 K) and hydrogen uptake (12.3 wt% at 80 bar pressure and 77 K), a little higher than the respective CO2 and H2 uptake of the solvothermally synthesised Mn–DABDC(ST) material, with both outperforming the related Mn–BDC framework. These results are ascribed to the incorporation of basic amine groups into the organic ligand within the framework significantly enhancing electrostatic interactions between the framework and the guests, increasing gas sorption. The electrochemical synthesis has the following specific advantages over the traditional solvothermal synthesis: (i) the use of ambient temperature instead of 120 °C, (ii) the use of ambient pressure instead of high-pressure autoclaves, (iii) the use of mild reaction conditions that recycle the nitrate counterions, and (iv) a vastly reduced reaction time compared to the conventional solvothermal synthesis method. These advantages demonstrate a method of design and synthesis of new materials with high carbon dioxide and hydrogen uptake with the potential for cost-effective large-scale production in the future.CCDC 1948926† contains the supplementary crystallographic data for the Mn–DABDC MOF structure and CCDC 2027762† contains the supplementary crystallographic data for the Mn–BDC MOF structure.
Conflicts of interest
There are no conflicts to declare.Acknowledgements
The authors are grateful to the United States Centre for Advanced Studies in Energy, Pakistan and Higher Education Commission, Pakistan for providing financial support. TLE gratefully acknowledges the Royal Society for the award of a University Research Fellowship (6866), and Cardiff University for funding.References
- T. L. Easun and A. C. Nevin, SPR Organomet. Chem., 2018, 42, 54–79 RSC.
- G. Férey, Chem. Soc. Rev., 2008, 37, 191–214 RSC.
- O. K. Farha and J. T. Hupp, Acc. Chem. Res., 2010, 43, 1166–1175 CrossRef CAS.
- J. Lee, O. K. Farha, J. Roberts, K. A. Scheidt, S. T. Nguyen and J. T. Hupp, Chem. Soc. Rev., 2009, 38, 1450–1459 RSC.
- Functional Metal-Organic Frameworks: Gas Storage, Separation and Catalysis, ed. M. Schröder, Springer Berlin Heidelberg, Berlin, Heidelberg, 2010, vol. 293 Search PubMed.
- J. R. Li, R. J. Kuppler and H. C. Zhou, Chem. Soc. Rev., 2009, 38, 1477–1504 RSC.
- G. T. Rochelle, Science, 2009, 325, 1652–1654 CrossRef CAS.
- M. D. Allendorf and V. Stavila, CrystEngComm, 2015, 17, 229–246 RSC.
- A. Asghar, N. Iqbal, T. Noor, M. Ali and T. L. Easun, Nanomaterials, 2019, 9, 1063 CrossRef CAS.
- A. Asghar, N. Iqbal, L. Aftab, T. Noor, B. M. Kariuki, L. Kidwell and T. L. Easun, R. Soc. Open Sci., 2020, 7, 191934 CrossRef CAS.
- U. Mueller, H. Puetter, M. Hesse and H. Wessel, 2005, WO 2005/049892.
- U. Mueller, M. Schubert, F. Teich, H. Puetter, K. Schierle-Arndt and J. Pastré, J. Mater. Chem., 2006, 16, 626–636 RSC.
- A. Martinez Joaristi, J. Juan-Alcañiz, P. Serra-Crespo, F. Kapteijn and J. Gascon, Cryst. Growth Des., 2012, 12, 3489–3498 CrossRef CAS.
- H. Al-Kutubi, J. Gascon, E. J. R. Sudhölter and L. Rassaei, ChemElectroChem, 2015, 2, 462–474 CrossRef CAS.
- P. Serra-Crespo, E. V. Ramos-Fernandez, J. Gascon and F. Kapteijn, Chem. Mater., 2011, 23, 2565–2572 CrossRef CAS.
- X. Zhang, K. Wan, P. Subramanian, M. Xu, J. Luo and J. Fransaer, J. Mater. Chem. A, 2020, 8, 7569–7587 RSC.
- O. J. De Lima Neto, A. C. de O. Frós, B. S. Barros, A. F. De Farias Monteiro and J. Kulesza, New J. Chem., 2019, 43, 5518–5524 RSC.
- K. Pirzadeh, A. A. Ghoreyshi, M. Rahimnejad and M. Mohammadi, Korean J. Chem. Eng., 2018, 35, 974–983 CrossRef CAS.
- T. Mitra, F. Moreau, A. Nevin, C. U. Perotto, A. Summerfield, E. S. Davies, E. A. Gibson, T. L. Easun and M. Schröder, Chem. Sci., 2018, 9, 6572–6579 RSC.
- E. R. Engel, E. R. Engel and J. L. Scott, Green Chem., 2020, 22, 3693–3715 RSC.
- H. Hu, X. Lou, C. Li, X. Hu, T. Li, Q. Chen, M. Shen and B. Hu, New J. Chem., 2016, 40, 9746–9752 RSC.
- F. Luo, Y.-X. Che and J.-M. Zheng, Inorg. Chem. Commun., 2008, 11, 358–362 CrossRef CAS.
- N. L. Rosi, J. Kim, M. Eddaoudi, B. Chen, M. O'Keeffe and O. M. Yaghi, J. Am. Chem. Soc., 2005, 127, 1504–1518 CrossRef CAS.
- A. Bétard, D. Zacher and R. A. Fischer, CrystEngComm, 2010, 12, 3768–3772 RSC.
- A. C. C. Chang, S. S. C. Chuang, M. Gray and Y. Soong, Energy Fuels, 2003, 17, 468–473 CrossRef CAS.
- F. Su, C. Lu, S. C. Kuo and W. Zeng, Energy Fuels, 2010, 24, 1441–1448 CrossRef CAS.
- J. A. Mason, T. M. McDonald, T. H. Bae, J. E. Bachman, K. Sumida, J. J. Dutton, S. S. Kaye and J. R. Long, J. Am. Chem. Soc., 2015, 137, 4787–4803 CrossRef CAS.
- K. Sumida, D. L. Rogow, J. A. Mason, T. M. McDonald, E. D. Bloch, Z. R. Herm, T. H. Bae and J. R. Long, Chem. Rev., 2012, 112, 724–781 CrossRef CAS.
- J. Borycz, L. C. Lin, E. D. Bloch, J. Kim, A. L. Dzubak, R. Maurice, D. Semrouni, K. Lee, B. Smit and L. Gagliardi, J. Phys. Chem. C, 2014, 118, 12230–12240 CrossRef CAS.
- Y. S. Bae and R. Q. Snurr, Angew. Chem., Int. Ed., 2011, 50, 11586–11596 CrossRef CAS.
- H. R. Abid, J. Shang, H.-M. Ang and S. Wang, Int. J. Smart Nano Mater., 2013, 4, 72–82 CrossRef CAS.
- S. S. Dhankhar, N. Sharma, S. Kumar, T. J. D. Kumar and C. M. Nagaraja, Chem. – Eur. J., 2017, 23, 16204–16212 CrossRef.
- K. Jiang, L. Zhang, T. Xia, Y. Yang, B. Li, Y. Cui and G. Qian, Sci. China Mater., 2019, 62, 1315–1322 CrossRef CAS.
- Y. Yang, R. Lin, L. Ge, L. Hou, P. Bernhardt, T. E. Rufford, S. Wang, V. Rudolph, Y. Wang and Z. Zhu, Dalton Trans., 2015, 44, 8190–8197 RSC.
- Y. Cao, H. Zhang, F. Song, T. Huang, J. Ji, Q. Zhong, W. Chu and Q. Xu, Materials, 2018, 11, 589 CrossRef.
- J. L. C. Rowsell and O. M. Yaghi, J. Am. Chem. Soc., 2006, 128, 1304–1315 CrossRef CAS.
- Z. Wang, K. K. Tanabe and S. M. Cohen, Chem. – Eur. J., 2010, 16, 212–217 CrossRef CAS.
- J. Zhu, L. Wu, Z. Bu, S. Jie and B. G. Li, ACS Omega, 2019, 4, 3188–3197 CrossRef CAS.
- A. M. Fracaroli, H. Furukawa, M. Suzuki, M. Dodd, S. Okajima, F. Gándara, J. A. Reimer and O. M. Yaghi, J. Am. Chem. Soc., 2014, 136, 8863–8866 CrossRef CAS.
- F. Moreau, I. da Silva, N. H. Al Smail, T. L. Easun, M. Savage, H. G. W. Godfrey, S. F. Parker, P. Manuel, S. Yang and M. Schröder, Nat. Commun., 2017, 8, 14085 CrossRef CAS.
- N. H. Alsmail, M. Suyetin, Y. Yan, R. Cabot, C. P. Krap, J. Lü, T. L. Easun, E. Bichoutskaia, W. Lewis, A. J. Blake and M. Schröder, Chem. – Eur. J., 2014, 20(24), 7317–7324 CrossRef CAS.
Footnote |
| † Electronic supplementary information (ESI) available. CCDC 1948926 and 2027762. For ESI and crystallographic data in CIF or other electronic format see DOI: 10.1039/d0gc03292a |
| This journal is © The Royal Society of Chemistry 2021 |

