 Open Access Article
Creative Commons Attribution 3.0 Unported Licence
Ultra-rapid synthesis of the MgCu2 and Mg2Cu Laves phases and their facile conversion to nanostructured copper with controllable porosity; an energy-efficient, reversible process†
Zhen
Fan
a,
Gytis
Baranovas
ab,
Holly A.
Yu
 a,
Robert
Szczęsny
c,
Wei-Ren
Liu
 d and
Duncan H.
Gregory
 *a
*a
aWestCHEM, School of Chemistry, Joseph Black Building, University of Glasgow, Glasgow, G12 8QQ, UK. E-mail: Duncan.Gregory@glasgow.ac.uk; Tel: +44-141-330-8128
bInstitute of Chemistry, Faculty of Chemistry and Geosciences, Vilnius University, Naugarduko str. 24, LT-03225, Vilnius, Lithuania
cFaculty of Chemistry, Nicolaus Copernicus University in Toruń, ul. Gagarina 7, 87-100 Toruń, Poland
dDepartment of Chemical Engineering, Chung Yuan Christian University, R&D Center for Membrane Technology, Research Center for Circular Economy, 32023, No. 200, Chun Pei Rd., Chung Li District, Taoyuan City 32023, Taiwan
First published on 26th August 2021
Abstract
Phase-pure MgCu2 and high-purity Mg2Cu have been synthesised within 1 min from elemental powders via the microwave-induced metal plasma (MIMP) approach for the first time. Subsequent room temperature, acidic de-alloying led to 3-dimensional nanoporous (NP) Cu within minutes. Each distinctive metallic matrix exhibited a large surface area with a porosity of either 37.47% (from MgCu2) or 56.25% (from Mg2Cu). Both NP Cu powders are composed of crystalline grains (“ligaments”) measuring tens of nanometers across, which exhibit rich point- and extended defects. The selection of Laves precursor dictates the form of ligament obtained, which directs the ensuing NP structure. Working electrodes of both types of NP Cu presented reliable linear non-enzymatic sensing properties over glucose concentrations of 0.5–4.5 and 4.5–10.0 mM with high confidence levels (>99%). This study provides a facile, rapid and energy-efficient route to functional NP Cu with eclectic structures, which should be equally applicable to other metals.
Introduction
Nanoporous (NP) metals, typically containing nanosized pores or ligaments less than 100 nm across, combine the physical and chemical properties of bulk metals (e.g. electrical conductivity, mechanical strength etc.) with unique nanoscale features like large surface-to-volume ratios, low density and abundant defects etc.1–5 Copper, as an Earth-abundant transition metal with highly-occupied d orbitals, has attracted growing interest in electro-catalysis research, principally due to an attractive combination of low toxicity, relatively low cost, high electrical conductivity and impressive catalytic activity.1,4,6,7 Cu nanomaterials adopting distinctive structures that can accommodate various surface oxidation states, have been largely studied for the electrochemical reduction of CO2 towards value-added multi-carbon products.8–13 Such nanomaterials can also exhibit antibacterial properties and provide efficient electro-reduction of nitrate for water treatment.6,14,15 Moreover, studies in 2020 have shown that the electrocatalytic reduction of NO and nitrate (pollutants of gas and wastewater, respectively) using Cu foams or nanosheets, offer lower energy-cost alternatives to traditional methods of ammonia synthesis, with significant industrial potential.16,17 Among other promising applications, the rapid and reliable detection of glucose concentration in human blood would be an important medical advance. Compared with the high costs, complexities and instabilities of enzyme electrodes, Cu-based nanomaterials have shown good non-enzymatic sensitivity and stability.18–22Nanoporous Cu (NP-Cu) materials have universally demonstrated a particularly impressive performance in the context of the above applications.7,18,23–26 A variety of synthesis methods have been proposed for NP metals, including thermal decomposition and reduction of metal salts/oxides (e.g. by H2 gas),27,28 electrochemical reduction of metal oxides (which are typically pre-synthesised in solution),23 organo-lithium reduction of metal/lithium halide nano-composites in nonpolar solvents,2 and chemical de-alloying of alloys by corrosive liquids (typically acidic or basic solutions).24,29–32 Of these methods, chemical de-alloying is proposed to be a readily scalable approach, in which relatively active elements are sacrificed and noble elements are reorganised into NP structures by surface diffusion.4,5,24,33 Mn–Cu, Al–Cu, Ca–Cu and Mg–Cu binary alloys (or related ternary systems), either glassy or crystalline, have been successfully utilised for the fabrication of NP-Cu.1,4,6,24,34,35 The synthesis of these alloys usually requires heating for long durations under inert conditions and/or eutectic melting at high temperature with dedicated high power equipment such as high frequency induction furnaces.6,24 For larger scale processing (kg to tonnes) such equipment requires typical input powers of 10 kW–42 MW and production can require several cycles to avoid oxide contamination. Subsequent alloys are typically melt-spun under protective fluxes (which, themselves can incur considerable expense).4,6,24,34,35 These multi-step processes can thus be highly energy-intensive and non-trivial (ESI; Table S1†). Glassy metallic ribbons are commonly employed as alloy precursors in the majority of cases.1,4,6,24,34,35 Perhaps surprisingly, de-alloying processes from crystalline precursors are uncommon and remain far less studied.
Herein, we describe an energy-efficient microwave-induced-metal-plasma (MIMP) method36 to synthesise crystalline alloys in the binary Mg–Cu system; yielding the Laves phase, MgCu2 and the corresponding anti-Laves phase, Mg2Cu. Each high purity alloy is obtained from mixtures of the elemental powders within 1 min by applying a microwave (MW) power of merely 200 W in vacuo (and hence without the requirement or expense of protective fluxes). De-alloying of the intermetallic powders can be achieved over minute timescales in 0.5 M HCl. De-alloying leads to 3D open NP-Cu materials with two different microstructures that we can relate directly to those of the respective precursors. Whereas both materials clearly show nano-pores/nano-grains of a few tens of nanometres or less coupled with rich stacking faults and lattice defects, NP-Cu from MgCu2 exhibits branch-like nano-ligaments as a principal feature while NP-Cu from Mg2Cu takes the form of quasi-spherical nano-ligaments. The high porosities of the Cu materials (37.47% and 56.25% from MgCu2 and Mg2Cu, respectively) are precursor-dependent, allowing the surface area and pore volume to be controlled. Working electrodes of both NP-Cu reliably exhibited linear non-enzymatic glucose sensing properties over concentration ranges of 0.5–4.5 mM and 4.5–10.0 mM with confidence levels close to 100% and with exceptional sensitivity.
Results and discussion
The known binary phase diagram of the Mg–Cu system (Fig. S1, ESI†) indicates that two solid intermetallic compounds exist, i.e. the Cu-rich Laves phase MgCu2 and the Mg-rich anti-Laves phase Mg2Cu.37–39 We focused on preparing these phases by employing our previously developed MIMP route for intermetallics.36 Both binary Mg–Cu intermetallics were successfully synthesised from mixtures of fine metal powders (used to ensure MW penetration)36 at an incident power of 200 W under a static vacuum of P < 10−6 mbar for 1 min (Scheme 1; full details in ESI;†). A 15 mol% excess of Mg powder was found to be necessary in each synthesis in order to compensate for the volatility of Mg.36 The generation of metal plasma could be observed within a few seconds of the onset of MW irradiation, indicating the efficient ohmic coupling between the fine metal powders and the MW field (Videos 1–3, Fig. S6, ESI†). The observed plasma gradually transformed from an initial pink colour to a steady green colour (Videos 2 & 3, ESI†). The initial pink plasma that prevails for the first ca. 25–30 s might be attributed chiefly to Cu (Video 1, ESI†), whereas the steady green plasma observed later in the reaction is likely to originate from the vaporised and ionised Mg source.36 Considering that long durations are required for the conventional high-temperature synthesis of Mg–Cu alloys,24,34,35 we propose that the ultra-rapid MW alloy reactions occur largely via MIMP phase(s) to enable completion within 1 min (routes i, ii, iv, Scheme 1).36 Nevertheless, a solid-state reaction route between Mg and Cu particles (Scheme 1, route iii) cannot be completely excluded given the elevated temperature of the synthesis.36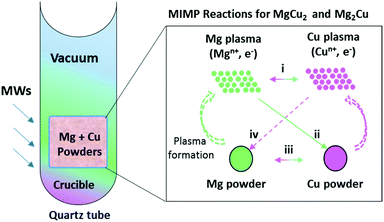 | ||
| Scheme 1 Proposed reaction pathways (i–iv) that can occur in the ultra-fast MIMP syntheses of Mg–Cu intermetallics. | ||
This repeatable MIMP approach afforded phase-pure, sub-micron to micron-sized MgCu2 powders in 1 min as determined by powder X-ray diffraction (PXD) and scanning electron microscopy (SEM), respectively (Fig. 1a; Fig. S2a, ESI†). Phase matching of PXD patterns and subsequent Rietveld refinement against the lab diffraction data confirmed the formation of cubic MgCu2 (space group Fd![[3 with combining macron]](https://www.rsc.org/images/entities/char_0033_0304.gif) m (No. 227), a = 7.0439(1) Å; Fig. 1a and d; Tables S2–4, ESI†). Although the MIMP method involves ultrafast reaction kinetics and changes of state – notably through the formation of metal plasma in the 2.45 GHz electromagnetic field – there was no evidence of impurities in the products. The C15 Laves phase of MgCu2 forms with a structure consisting of an interconnected 3D framework formed from Cu4 tetrahedral clusters with Mg in the tetrahedral sites of a diamond-like sublattice. The Cu atoms can also be considered to form a Kagomé net of regular triangles and hexagons.40 One interesting and important result from the structure refinement of MgCu2 concerns the Cu 16d site, which was found to have a refined occupancy of 0.962(4), implying a stoichiometry of MgCu1.92 (Fig. 1d; Table S3, ESI†). This result suggests that MgCu2 is not, in fact, a line phase (and the binary phase diagram also indicates a region of variable stoichiometry) or at least that a non-stoichiometric metastable phase is favoured by the kinetically-driven conditions of the MIMP synthesis. Interestingly, both the chemical and mechanical properties of Laves phases can be tuned via small stoichiometric modifications.41 The implications of copper deficiency in MIMP-synthesised MgCu2 would be an interesting avenue to explore in further studies. The Mg-rich environment of the synthesis (15 mol% excess of Mg metal) would certainly not disadvantage the formation of Cu vacancies and the formation of an intense Cu plasma in the microwave field is likely to promote Cu loss in the MgCu2 product. Given that the necessary advanced temporally- and spatially-resolved techniques to probe such a reaction in situ are extremely challenging to set up, it remains problematic to establish a reaction mechanism and to unequivocally identify a driving force for the non-stoichiometry.36,42
m (No. 227), a = 7.0439(1) Å; Fig. 1a and d; Tables S2–4, ESI†). Although the MIMP method involves ultrafast reaction kinetics and changes of state – notably through the formation of metal plasma in the 2.45 GHz electromagnetic field – there was no evidence of impurities in the products. The C15 Laves phase of MgCu2 forms with a structure consisting of an interconnected 3D framework formed from Cu4 tetrahedral clusters with Mg in the tetrahedral sites of a diamond-like sublattice. The Cu atoms can also be considered to form a Kagomé net of regular triangles and hexagons.40 One interesting and important result from the structure refinement of MgCu2 concerns the Cu 16d site, which was found to have a refined occupancy of 0.962(4), implying a stoichiometry of MgCu1.92 (Fig. 1d; Table S3, ESI†). This result suggests that MgCu2 is not, in fact, a line phase (and the binary phase diagram also indicates a region of variable stoichiometry) or at least that a non-stoichiometric metastable phase is favoured by the kinetically-driven conditions of the MIMP synthesis. Interestingly, both the chemical and mechanical properties of Laves phases can be tuned via small stoichiometric modifications.41 The implications of copper deficiency in MIMP-synthesised MgCu2 would be an interesting avenue to explore in further studies. The Mg-rich environment of the synthesis (15 mol% excess of Mg metal) would certainly not disadvantage the formation of Cu vacancies and the formation of an intense Cu plasma in the microwave field is likely to promote Cu loss in the MgCu2 product. Given that the necessary advanced temporally- and spatially-resolved techniques to probe such a reaction in situ are extremely challenging to set up, it remains problematic to establish a reaction mechanism and to unequivocally identify a driving force for the non-stoichiometry.36,42
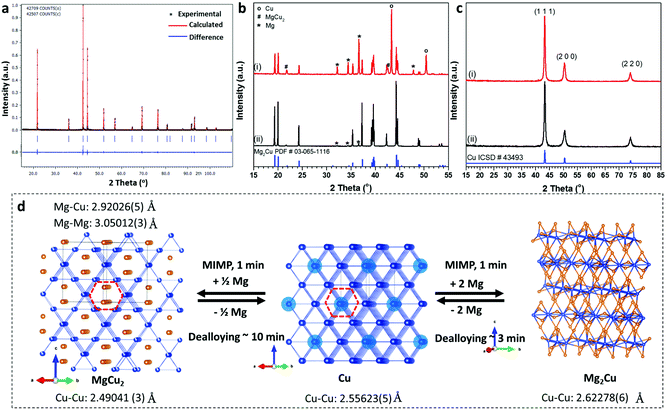 | ||
| Fig. 1 (a) Rietveld profile plot for as-synthesised MgCu2; (b) PXD patterns of Mg2Cu powders synthesized after (i) 30 s and (ii) 60 s, respectively; (c) PXD patterns of NP-Cu de-alloyed from (i) MgCu2 and (ii) Mg2Cu, respectively and (d) reaction scheme from/to (NP-)Cu and the MgCu2 and Mg2Cu Laves phases. The crystal structure of each reactant/product is shown. (The MgCu2 and Mg2Cu structures are taken from this work, while the Cu structure is from ref. 38.) Cu atoms are shown as royal blue spheres and Mg atoms as orange spheres. The Cu atoms in copper metal that are replaced by Mg in MgCu2 are highlighted in lighter blue and the Kagomé hexagons in Cu and MgCu2 are indicated with red dashes. | ||
Considering again the crystal structure, MgCu2 crystallises in a cubic structure that is ostensibly very similar to that of face-centred-cubic Cu, which can also be considered as a 3D framework composed of Cu4 tetrahedral clusters (Fig. 1d). From the (110) projections of the respective structures, the copper network in Cu metal is largely preserved in MgCu2 and Mg atoms can be regarded as substituting for a proportion of the Cu atoms (within the dashed hexagonal channels indicated in Fig. 1d). Like Cu, MgCu2 is metallic with excellent electrical and thermal conductivity.37,43 This is perhaps not unexpected given the similarity of the Cu framework to that in Cu metal and, in fact, the Cu–Cu distance of 2.49041(3) Å in MgCu2 is smaller than the equivalent distance of 2.55623(5) Å in Cu metal itself.38 Indeed, DFT calculations suggest that the electronic DOS at the Fermi level of MgCu2 largely originates from Cu 3d contributions.37,43
It should be noted for the MIMP reaction of MgCu2 that although pink plasma is observable continuously for an initial period >30 s (Video 2, ESI†), a reaction performed for only 30 s led to negligible formation of Mg–Cu alloys, leaving only unreacted Mg and Cu starting materials (Fig. S2h†). From these findings, although clearly Cu interacts strongly with MWs, readily forming a plasma under vacuum, we can intimate that Mg in the plasma phase plays a likely pivotal role in the ultra-fast synthesis of Mg–Cu alloys.
Fig. 1b shows the ex situ PXD patterns of the Mg2Cu products synthesised using a MW irradiation time of 30 s and 60 s, respectively. A reaction under irradiation for 30 s formed a considerable amount of Mg2Cu, with evidence of unreacted Mg and Cu starting materials present and a suggestion of the presence of MgCu2 (at 42.5°, 2θ). The incidence of MgCu2 is perhaps not surprising given its higher thermal stability over Mg2Cu (Fig. S1†) and it is also possible that the phase acts as a kinetically-favoured intermediate which reacts further with Mg to produce Mg2Cu. Based on PXD patterns and the results of subsequent Rietveld refinement (Fig. 1b; Fig. S2g, ESI†), irradiation for 60 s yielded high purity Mg2Cu containing only minor amounts of Mg (up to ca. 3.6(2) wt%; Fig S2g, Tables S5–7, ESI†). Irradiation times exceeding 60 s did not improve the purity significantly and extended reaction times (>90 s) led to increased Mg and/or MgCu2 impurities. The anti-Laves phase, Mg2Cu forms a complex layered orthorhombic structure in space group Fddd (No. 70) in which Cu atoms are coordinated by eight Mg atoms in a square antiprismatic geometry. Two of the rectangular faces of the square antiprism are further capped by Cu atoms. The layered structure is then constituted by the stacking of different types of five-atom layer thick “slabs” along the crystallographic c-axis (Fig. 1d).39 Unlike in MgCu2 and Cu itself, the copper atoms in Mg2Cu form quasi-linear chains rather than Kagomé nets. SEM images indicate the synthesised powders contain particles ranging from sub-micron sizes to those measuring a few tens of microns across, which exhibit crystalline facets. Sub-micron scale textures appear to be common in the Mg2Cu sample (Fig. S2b and c, ESI†). Energy dispersive X-ray (EDX) spectra and spatially resolved elemental mapping further confirm the uniform elemental distributions of Mg and Cu within the synthesised micron-sized powders (Fig. S2d–f, ESI†).
Following their characterisation, MW-synthesised MgCu2 and Mg2Cu powders were converted into NP-Cu materials by immersion into 0.5 M aqueous HCl solutions at room temperature, until no further gas bubbles evolved. This chemical de-alloying process was typically complete within ∼10 min for MgCu2 and within ∼3 min for Mg2Cu. The two different NP-Cu samples in this study are thus referred to as “NP-Cu_MgCu2” and “NP-Cu_Mg2Cu” from this point forward. PXD patterns of the de-alloyed Cu samples could be indexed to the expected fcc structure of Cu without the presence of any peaks from copper oxides or other impurities (Fig. 1c). Both Cu samples were composed of micron-sized particles with three-dimensional porous structures (Fig. 2–4; Fig. S3, ESI†). EDX spectra (Fig. S3, ESI†) confirmed the exclusion of residual Mg and copper oxides, while the trace amount of oxygen observed could very likely be attributed to the short period of air exposure during sample mounting for SEM-EDX characterisation.
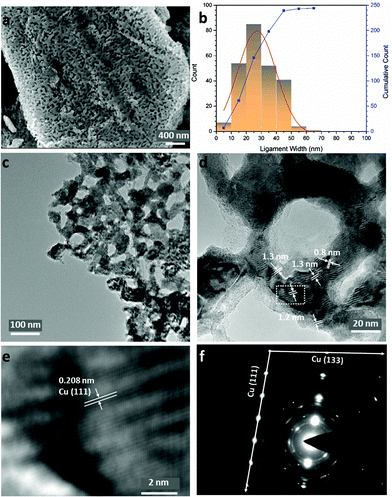
Fig. 2a shows that the sponge-like NP-Cu_MgCu2 material is composed of uniform interconnected ligaments (from a few to ∼50 nm) as the principal structural feature (Fig. 2b), which is further confirmed in low-resolution transmission electron microscopy (TEM) images (Fig. 2c; Fig. S3e and f, ESI†). Parallel lines characteristic of Moiré fringes with periodicity from 0.8 nm to 1.3 nm could be observed within these ligaments (Fig. 2d). The Moiré fringes (caused by the interference between diffracted and transmitted electron beams), can be attributed to overlapping crystalline sections of the sample which might arise from Cu2O at the surface caused by the oxidation of the Cu sample during the TEM specimen preparation. Alternatively, local structure variations and uneven twisting and strains of the nano-grains in NP-Cu_MgCu2 might be responsible.44–46 The thorough distribution of phase contrast in Fig. 2c would also suggest that Moiré fringes would not be uncommon across regions of NP-Cu_MgCu2 samples. The high magnification inverse-fast-Fourier-Transform (iFFT) image (Fig. 2e) of the Moiré fringes reveals a lattice distance of 0.208 nm that matches well to the d-spacing from the Cu (111) plane. The corresponding selected area electron diffraction (SAED) pattern in Fig. 2f shows sharp single crystalline spots matching the Cu (111) and Cu (133) planes, that are superimposed over polycrystalline rings (also from Cu). Additionally, broad spots are observed that originate from Cu2O located at certain positions throughout the samples (Fig. 2f; Table S8, ESI†). Considering the thermodynamic surface energy of nano-grains of Cu,4,12,44 the oxidation can be attributed to the probable surface oxidation of the material during the preparation and transfer of the TEM specimen into the microscope.
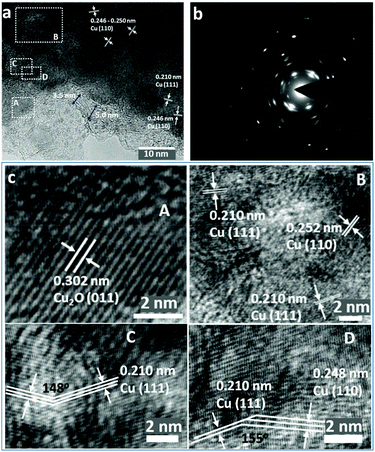
Indeed, high-resolution TEM images show the presence of Cu2O at the outer edges of the ligaments (area A in Fig. 3a and c). An amorphous surface layer appears to form in places, beneath which exists a poorly-crystalline layer with a thickness of ∼3–5 nm. The bulk of the Cu particle shown in Fig. 3a contains nano-grains in which the (110) and (111) planes are more clearly visible, but which also exhibits an apparent abundance of lattice dislocations, grain boundaries and vacancies (Fig. 3a and c), suggesting the presence of highly defective and micro-strained nano-ligaments in the NP-Cu_MgCu2 material, which readily form during the room temperature de-alloying process. The diffuse electron diffraction spots and powder rings that originate from the (110) reflection from the Cu particle (Fig. 3b) are consistent with its component defective grains, as seen in Fig. 3a.
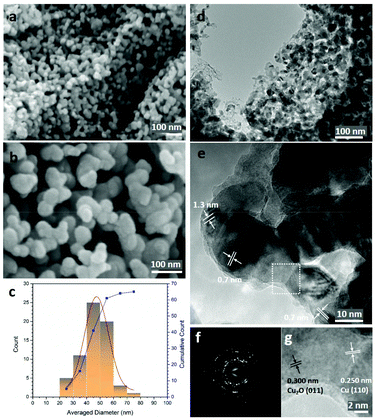
In contrast to NP-Cu_MgCu2, the structure of NP-Cu_Mg2Cu (Fig. 4a and b; Fig. S3h, ESI†) is not so sponge-like and appears still less dense. The material is seemingly composed of clusters of nanoparticles, which at higher magnification are revealed to be interconnected quasi-spherical nano-ligaments, apparently ranging from 20–80 nm across (Fig. 4c). Ostensibly, the nano-grains resemble fragments of the ligaments that comprise the NP-Cu_MgCu2 microstructure. These morphological differences between the NP-Cu materials and the fact that the sponge-like matrix observed for NP-Cu_MgCu2 appears to be disrupted, can almost certainly be attributed to differences in the Laves phase precursors at the atomic level. Given the much higher Mg content in the lattice, the anti-Laves Mg2Cu crystal structure resembles that of copper far less than MgCu2 (Fig. 1d). Not only is proportionally far more Mg required to be removed from Mg2Cu than MgCu2, but also the former does not retain the Kagomé net of copper atoms that dominates the structure of Cu and adopts an entirely different stacking sequence to the Cu-rich phase. The de-alloying process in Mg2Cu requires significantly more atomic diffusion, structural transformation and mass transfer than does that for MgCu2. Low magnification TEM images confirm the structure and distribution of the quasi-spherical nano-ligaments, revealing that the smallest of these angular particles are only few nm across, with most 30–45 nm in size (Fig. 4d). Moiré fringes are observed at higher magnification, just as in NP-Cu_MgCu2 and are arguably even more prevalent in the particles derived from the Mg-rich precursor (Fig. 4e). This prevalence suggests abundant stacking faults and lattice defects in NP-Cu_Mg2Cu, which is not surprising, given the large crystal structure change during the rapid room temperature de-alloying process. Diffraction spots superimposed over powder rings were observed in SAED patterns taken from a small cluster of the quasi-spherical nano-ligaments (Fig. 4f; Table S8, ESI†). These patterns represented a mixture of single crystals (principally Cu) and polycrystals (mainly Cu2O but also Cu). High-resolution TEM images (Fig. 4g) also demonstrate that the bulk of the nano-grains are comprised of Cu, with the (110) spacing clearly defined. As seen in the NP-Cu_MgCu2 samples, Cu2O grows as a surface layer on the Cu grains, with the (011) spacing discernible and likely forms as the samples are prepared and transferred to the microscope.
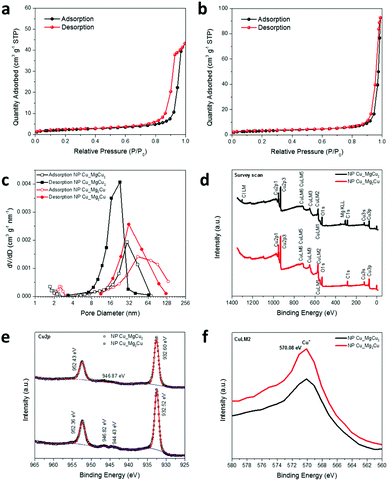
Brunauer–Emmett–Teller (BET) analysis of nitrogen adsorption data was performed at 77 K to estimate the surface area, pore size distribution and porosity of the respective NP-Cu samples (Table 1, Fig. 5a–c). Both samples present type IV N2 physisorption isotherms. NP-Cu_MgCu2 has an H1 hysteresis, suggesting capillary condensation at well-defined cylindrical mesopores (2–50 nm).47 By contrast, NP-Cu_Mg2Cu has an H3 hysteresis, indicating the presence of exceptionally small pores, i.e., micropores (<2 nm).47 The corresponding measured BET surface areas are 7.923 and 10.728 m2 g−1 for NP-Cu_MgCu2 and NP-Cu_Mg2Cu, respectively. The microporous surface area of NP-Cu_Mg2Cu is approximately three times larger than that of NP-Cu_MgCu2, as might be inferred from the shape of the isotherms. The Barrett–Joyner–Halenda (BJH) analysis of the desorption curve in Fig. 5c demonstrates that the pore size distribution in NP-Cu_MgCu2 is relatively narrow, sharp and uniform and lies predominantly in a region between 8–32 nm, with a maximum of approximately 20 nm, which corresponds to an internal structure dominated by mesopores.47 Although the BJH analysis of the adsorption curve for NP-Cu_MgCu2 shows relatively larger pore sizes, the results also confirm the dominant mesopores in this sample. By stark contrast, NP-Cu_Mg2Cu exhibits a relatively wide pore size distribution, covering sizes over an order of magnitude embracing both mesopores and macropores (Fig. 5c; Fig. S3h, ESI†).47 Consistent with all the above findings, the total porosity was more than half as much again in NP-Cu_Mg2Cu than in NP-Cu_MgCu2 (Table 1).
| Sample | BET surface area/m2 g−1 | Micro-pore area/m2 g−1 | External surface area/m2 g−1 | Micro-pore area/BET surface area/% | Porosity/% |
|---|---|---|---|---|---|
| NP-Cu_MgCu2 | 7.923 | 0.820 | 7.103 | 10.35 | 37.47 |
| NP-Cu_Mg2Cu | 10.728 | 2.495 | 8.233 | 23.26 | 56.25 |
The mechanisms for the formation of porous metal structures by de-alloying have been the topic of extensive investigations, which have examined many facets of the process including the dissolution of the active component elements into solution, the surface diffusion processes and the self-organisation of the more inert (often noble) metal elements.24,34,48 Due to the high surface energy of the de-alloyed products, the coarsening of the NP metal particles in liquids is unavoidable.48 It should be noted that in a previous study NP-Cu prepared by de-alloying Mg65Cu25Y10 glass ribbons in 0.04 M H2SO4 (vs. 0.5 M HCl in our work) for 10 min only exhibited a porosity of ∼30%, which is even lower than the porosity of the NP-Cu produced from a Cu-rich precursor (MgCu2) herein. This contrast can be potentially attributed to the profound differences in structure between glass metallic ribbons and crystalline alloy powders combined with the degree of nano-grain coarsening observed in different acid solutions (H2SO4vs. HCl).49 Indeed, NP Cu samples with finer ligaments, smaller pores, larger surface areas and higher porosity can potentially be prepared via de-alloying using organic acids, which could decelerate atomic diffusion rates.24 Interestingly, a previous study reported that melt spun alloys of nominal composition Mg33Cu67 (essentially shown to be MgCu2 with evidence of a minor impurity of Cu metal present) could not be fully de-alloyed when using 5 wt% HCl solution.34 In fact, Mg could only be successfully removed from the surface of the copper-rich Mg–Cu alloy in this earlier study and it was proposed that entirely different mechanisms were responsible for de-alloying Mg2Cu and MgCu2 in aqueous HCl solution. It was hypothesised that Mg atoms from Mg2Cu could continuously dissolve into solution, whereas Mg dissolution in MgCu2 might be accompanied by the formation of aqueous CuCl2− during dealloying. As Cu is formed, CuCl2− is contended to accumulate in the porous channels in a passivating capacity preventing further de-alloying. It is inherently extremely challenging experimentally to study the de-alloying of metals in solution and to probe the removal of magnesium from MgCu2 in aqueous HCl is no exception. Nevertheless, it is apparent from a comparison of the respective products that HCl-treated melt-spun Mg33Cu67 samples present a very different morphology to NP-Cu_MgCu2 (e.g.Fig. 2a and c in our study). To some extent these differences could arise from the divergent particle shapes and sizes of the alloy precursors. Alternatively, the Cu sub-stoichiometry (vacancies) in our MW-synthesised MgCu2 is an important distinction to be made between the NP-Cu_MgCu2 precursor and other copper-rich Mg–Cu materials. Potentially less thermodynamically stable than the stoichiometric C-15 phase, the de-alloying reaction in aqueous HCl is likely more favourable. Moreover, the vacancies in the Cu sublattice should facilitate diffusion and promote the relatively minor reorganisation of the 3D Cu net in MgCu2 to the equivalent array in similarly structured Cu (Fig. 1d).
Fig. 5d–f shows the wide survey scan, Cu2p, and CuLM2 X-ray photoelectron spectroscopy (XPS) spectra, respectively, of our NP-Cu samples. The spectra indicate the same electronic state of Cu in the two NP-Cu samples. Both Cu2p spectra are characteristic of copper metal with peaks at binding energies of ca. 952.4 eV (2p1/2) and ca. 933.6 eV (2p3/2). This is also consistent with those taken from other samples of NP-Cu, such as the spectrum originating from electrochemically reduced NP-Cu.23 The spectrum of Cu2O is very similar to that of Cu, however, with the presence of weak satellites and a slight broadening of the 2p3/2 peak usually the only distinguishing features.23,24 The presence of weak satellites at ca. 945 eV might suggest that Cu2O is also present. CuLM2 Auger spectra (Fig. 5f) show peaks at 570.08 eV, corresponding to Cu+ in Cu2O.18 This is unsurprising given the tendency for the NP-Cu nano-grain surfaces to oxidise readily in air (Fig. 2–4); the presence of Cu2O could arise from surface oxidation during preparation and transfer of the XPS specimens. Indeed, it is not unusual for Cu nanostructures to oxidise easily on air exposure (or when heated in the presence of oxygen).4,9,12,14Ex situ PXD experiments confirm that our NP-Cu samples can be very easily oxidised under a range of conditions, with full oxidation to CuO occurring at elevated temperature (Fig. S4, ESI†). Interestingly, SEM images of CuO powders formed by heating NP-Cu_Mg2Cu in air suggest that the morphology and porosity of the material is retained after oxidation (Fig. S5, ESI†). However, the oxidation of NP-Cu_MgCu2 to CuO is not similarly pseudomorphic (Fig. S5, ESI†). It appears that the lower density, higher porosity NP-Cu_Mg2Cu is able to more easily accommodate the volume change associated with oxidation, but this and associated phenomena will be the topic of a subsequent study.
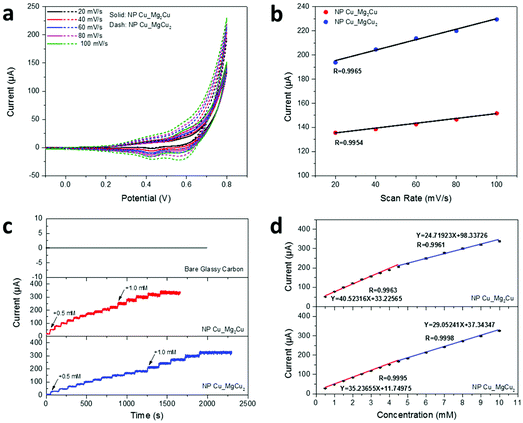
In light of the well-defined open pores and defect-rich nano-grains found in our NP-Cu materials, we wished to explore the possibility that the nanogranular metals could serve as electrochemical catalysts with large surface areas, abundant active sites and high electrical conductivity as the prerequisites. A working electrode was prepared with NP-Cu_MgCu2 and NP-Cu_Mg2Cu on glassy carbon, respectively, for the non-enzymatic electrochemical sensing of glucose with 0.1 M NaOH aqueous solution as the electrolyte. Fig. 6a shows CV curves (−0.1–0.8 V vs. Ag/AgCl) of the working electrodes in the presence of 0.5 mM glucose at scanning rates of 20–100 mV s−1. Oxidation currents could be seen in the voltage range of 0.35–0.5 V vs. Ag/AgCl. Since the oxidation potential of Cu(0) to Cu(I) and Cu(I) to Cu(II) are both lower than 0.2 V,18 the oxidation peak could be attributed to the oxidation of glucose.18,20 The possible sensing mechanism of NP Cu and its oxides has been proposed to involve a Cu(III) intermediate, which catalyses the oxidation of glucose to gluconolactone.18,20,50 Thus, the mechanism of the process we observe is likely to proceed according to the following steps: (1) progressive surface Cu(0) oxidation to Cu(I) and then to Cu(II) in alkaline NaOH solution under positive potentials; (2) CuO + OH− = CuOOH + e−; (3) CuOOH + e− + glucose = CuO + OH− + gluconolactone.18,20 Because the oxidation reaction of glucose is irreversible, the reduction current observed at 0.55–0.6 V likely corresponds to Cu(III)–Cu(II) reduction, while the current at 0.4–0.45 V likely corresponds to the mild reduction of Cu(II).18,20,21 The calibration plot of max current vs. scanning rate presented in Fig. 6b exhibited linear relationships, i.e. R = 0.9965 and 0.9954 for NP-Cu_MgCu2 and NP-Cu_Mg2Cu, respectively, indicating a typical surface-controlled electrochemical process with fast electron-transfer behavior, which is ideal for quantitative sensing applications.18–20,45
The amperometric measurements were performed with step-wise addition of glucose into the electrolyte and both working electrodes demonstrated rapid responses to glucose concentration variations from 0.5 to 10.0 mM. By comparison, no responses were observed from the bare glassy-carbon electrode (Fig. 6c). The calibration plots of current response vs. glucose concentration confirmed two linear regions over 0.5–4.5 mM and 4.5–10.0 mM, respectively, for both working electrodes (Fig. 6d) with confidence levels close to 100%. The calculated sensing sensitivities were 573.3 and 349.7 μA mM−1 cm−2 over 0.5–4.5 and 4.5–10.0 mM, respectively, for NP-Cu_MgCu2; while 498.5 and 411.0 μA mM−1 cm−2 over 0.5–4.5 and 4.5–10.0 mM, respectively, for NP-Cu_Mg2Cu. The results confirmed that non-enzymatic glucose-sensing could be performed by both NP Cu samples with both high precision and high sensitivity (Table S9, ESI†). Considering these very promising initial results, it will be interesting to explore the performance of NP-Cu samples more widely to serum samples and to investigate NP-Cu prepared under different de-alloying conditions. Similarly, the use of NP-Cu made via the MIMP-de-alloying method in other electrochemical applications that rely on nanoscale porosity and an abundance of point and extended defects certainly warrants further study.8,9,11–13,51 Moreover, given the likely high surface energy of NP-Cu produced by the MIMP method, it will be very interesting to monitor the morphological evolution of these materials during the course of electrochemical processes such as, but not exclusively, chemical sensing. Quite apart from the surface properties, which relate more specifically to catalytic processes for example, since the NP-Cu samples contain nano-grains with a high density of grain boundaries and defects, their mechanical stability could be especially interesting to unravel at the nanoscale.48,52 Significantly, Fig. S7† suggests that our NP-Cu products can be reacted with Mg powder using the MIMP method to form the intermetallic phase once again. This indicates that the reactants and products of Cu could potentially be (re)cycled multiple times, while Mg could be regenerated from MgCl2 leach solutions electrochemically.
Conclusions
The ultra-fast and energy efficient MIMP syntheses of MgCu2 and Mg2Cu provide a unique basis for the sustainable fabrication of functional NP-Cu over a matter of minutes. The choice of alloy precursor – either MgCu2 or Mg2Cu; each with distinct crystal structures – directs the morphologies and porosity of the de-alloyed copper metal. Both de-alloyed materials exhibit matrices of nano-grains rich in stacking faults and lattice defects, yet each offers a bespoke distribution of micro-, meso- and macropores, which are ideal for surface-controlled catalysis. Both NP-Cu samples demonstrate extremely promising linear electrochemical non-enzymatic glucose sensing over concentration ranges of 0.5–4.5 and 4.5–10.0 mM with high sensitivity. The facile, rapid, and energy-efficient route to functional NP-Cu disclosed here should be readily extendable to other metals, metal oxides and oxide-metal composites. Potentially a multitude of applications that benefit from high concentrations of nano-pores and/or defects are accessible to such easily produced materials.Conflicts of interest
There are no conflicts to declare.Acknowledgements
DHG and ZF thank the University of Glasgow and the China Scholarship Council for the co-funding of a studentship for ZF. DHG and W-RL thank the Royal Society and MOST for joint funding under grants IEC\R3\183040 and MOST 109-2911-I-033-502. The authors acknowledge Mr Hsi-Nien Ho, Mr Cheng-Yi Lin and Ms Mei-Chun Lin (Chung Yuan Christian University) for assistance with XPS, SEM and BET measurements, respectively. Mr Hao Yang & Professor Peter Skabara and Mr Peter Chung & Mr James Gallagher (University of Glasgow) are acknowledged for providing electrochemical support and assistance with SEM measurements, respectively. DHG and ZF acknowledge Mr Patrick McHugh (University of Glasgow) for assistance with the electrochemical experiments.References
- Y. Zhang, X. Sun and N. Nomura, et al. , Small, 2019, 15, 1805432 CrossRef PubMed.
- C. Coaty, H. Zhou and H. Liu, et al. , ACS Nano, 2018, 12, 432–440 CrossRef CAS PubMed.
- B. C. Tappan, S. A. Steiner III and E. P. Luther, Angew. Chem., Int. Ed., 2010, 49, 4544–4565 CrossRef CAS PubMed.
- K. Nishimoto, M. Krajčí and T. Sakurai, et al. , Inorg. Chem., 2018, 57, 2908–2916 CrossRef CAS PubMed.
- J. Erlebacher, M. J. Aziz and A. Karma, et al. , Nature, 2001, 410, 450–453 CrossRef CAS PubMed.
- X. Zhang, K. Turcheniuk and B. Zusmann, et al. , Chem. Commun., 2018, 54, 5446–5449 RSC.
- S. Nitopi, E. Bertheussen and S. B. Scott, et al. , Chem. Rev., 2019, 119, 7610–7672 CrossRef CAS PubMed.
- C. T. Dinh, T. Burdyny and M. G. Kibria, et al. , Science, 2018, 360, 783–787 CrossRef CAS PubMed.
- Y. Li, D. Kim and S. Louisia, et al. , Proc. Natl. Acad. Sci. U. S. A., 2020, 117, 9194–9201 CrossRef CAS PubMed.
- M. Ebaid, K. Jiang and Z. Zhang, et al. , Chem. Mater., 2020, 32, 3304–3311 CrossRef CAS.
- G. M. Tomboc, S. Choi and T. Kwon, et al. , Adv. Mater., 2020, 1908398 CrossRef CAS PubMed.
- Q. Lei, H. Zhu and K. Song, et al. , J. Am. Chem. Soc., 2020, 142, 4213–4222 CrossRef CAS PubMed.
- W. Luc, B. H. Ko and S. Kattel, et al. , J. Am. Chem. Soc., 2019, 141, 9902–9909 CrossRef CAS PubMed.
- M. Raffi, S. Mehrwan and T. M. Bhatti, et al. , Ann. Microbiol., 2010, 60, 75–80 CrossRef CAS.
- X. Wang, M. Zhu and G. Zeng, et al. , Nanoscale, 2020, 12, 9385–9391 RSC.
- J. Long, S. Chen and Y. Zhang, et al. , Angew. Chem., 2020, 59, 2–10 CrossRef.
- X. Fu, X. Zhao and X. Hu, et al. , Appl. Mater. Today, 2020, 19, 100620 CrossRef.
- Y. Gao, F. Yang and Q. Yu, et al. , Microchim. Acta, 2019, 186, 192 CrossRef PubMed.
- S. Y. Tee, E. Ye and P. H. Pan, et al. , Nanoscale, 2015, 7, 11190–11198 RSC.
- Y. Zhong, T. Shi and Z. Liu, et al. , Sens. Actuators, B, 2016, 236, 326–333 CrossRef CAS.
- W. Zhu, J. Wang and W. Zhang, et al. , J. Mater. Chem. B, 2018, 6, 718–724 RSC.
- Z. Wang, X. Cao and D. Liu, et al. , Chem. – Eur. J., 2017, 23, 4986–4989 CrossRef CAS PubMed.
- J. J. Lv, M. Jouny and W. Luc, et al. , Adv. Mater., 2018, 30, 1803111 CrossRef PubMed.
- H. Xu, S. Pang and Y. Jin, et al. , Nano Res., 2016, 9, 2467–2477 CrossRef CAS.
- T. N. Huan, P. Simon and G. Rousse, et al. , Chem. Sci., 2017, 8, 742–747 RSC.
- T. T. H. Hoang, S. Ma and J. I. Gold, et al. , ACS Catal., 2017, 7, 3313–3321 CrossRef CAS.
- L. Lu, P. Andela and J. T. M. De Hosson, et al. , ACS Appl. Nano Mater., 2018, 1, 2206–2218 CrossRef CAS PubMed.
- L. Lu, F. Pei and T. Abeln, et al. , Carbon, 2020, 157, 437–447 CrossRef CAS.
- X. Guo, J. Han and P. Liu, et al. , ChemNanoMat, 2016, 2, 176–181 CrossRef CAS.
- T. Wang, D. Ren and Z. Huo, et al. , Green Chem., 2017, 19, 716–721 RSC.
- H. Xu, S. Pang and T. Zhang, J. Power Sources, 2018, 399, 192–198 CrossRef CAS.
- S. Liu, F. Pang and Q. Zhang, et al. , Appl. Mater. Today, 2018, 13, 135–143 CrossRef.
- S. Liu, J. Feng and X. Bian, et al. , Energy Environ. Sci., 2016, 9, 1229–1236 RSC.
- C. Zhao, Z. Qi and X. Wang, et al. , Corros. Sci., 2009, 51, 2120–2125 CrossRef CAS.
- D. Liu, Z. Yang and P. Wang, et al. , Nanoscale, 2013, 5, 1917–1921 RSC.
- Z. Fan, M. D. Cappelluti and D. H. Gregory, ACS Sustainable Chem. Eng., 2019, 7, 19686–19698 CrossRef CAS.
- A. Takeuchi, K. Yubuta and A. Inoue, Intermetallics, 2008, 16, 1273–1278 CrossRef CAS.
- H. M. Otte, J. Appl. Phys., 1961, 32, 1536–1546 CrossRef CAS.
- F. Gingl, P. Selvam and K. Yvon, Acta Crystallogr., Sect. B: Struct. Sci., 1993, 49, 201–203 CrossRef.
- T. Ohba, Y. Kitano and Y. Komura, Acta Crystallogr., Sect. C: Cryst. Struct. Commun., 1984, 40, 1–5 CrossRef.
- F. Stein and A. Leineweber, J. Mater. Sci., 2020, 1–107 Search PubMed.
- H. J. Kitchen, S. R. Vallance and J. L. Kennedy, et al. , Chem. Rev., 2014, 114, 1170–1206 CrossRef CAS PubMed.
- P. Mao, Y. U. Bo and L. I. U. Zheng, et al. , Trans. Nonferrous Met. Soc. China, 2014, 24, 2920–2929 CrossRef CAS.
- Y. Zhao, Y. Zhang and H. Zhao, et al. , Nano Res., 2015, 8, 2763–2776 CrossRef CAS.
- Y. Liao, W. Cao and J. W. Connell, et al. , Sci. Rep., 2016, 6, 1–10 CrossRef PubMed.
- J. F. Tu, Carbon, 2018, 4, 19 Search PubMed.
- K. S. W. Sing, Pure Appl. Chem., 1985, 57, 603–619 CAS.
- I. McCue, E. Benn and B. Gaskey, et al. , Annu. Rev. Mater. Res., 2016, 46, 263–286 CrossRef CAS.
- X. Luo, R. Li and T. Zhang, Corros. Sci., 2013, 67, 100–108 CrossRef CAS.
- R. Ahmad, N. Tripathy and M. S. Ahn, et al. , Sci. Rep., 2017, 7, 1–10 CrossRef PubMed.
- C. An, Z. Wang and W. Xi, et al. , J. Mater. Chem. A, 2019, 7, 15691–15697 RSC.
- X. Y. Li, X. Zhou and K. Lu, Sci. Adv., 2020, 6, eaaz8003 CrossRef CAS PubMed.
Footnote |
| † Electronic supplementary information (ESI) available. See DOI: 10.1039/d1gc01710a |
| This journal is © The Royal Society of Chemistry 2021 |

