 Open Access Article
Investigating the formation of diverse ZnO nanostructures based on solvent, temperature, and pH as adjustable parameters†
Smriti
Thakur
and
Sanjay K.
Mandal
 *
*
Department of Chemical Sciences, Indian Institute of Science Education and Research Mohali, Sector 81, Manauli PO, S.A.S. Nagar, Mohali, Punjab 140306, India. E-mail: sanjaymandal@iisermohali.ac.in
First published on 8th December 2020
Abstract
Employing a coordination polymer, namely, [Zn2(bpma)2(adc)2]n, as a single-source precursor, the fabrication of diverse ZnO nanostructures with a variation in the morphologies and dimensionalities has been achieved through different processing parameters – solvent, pH and temperature. For example, 0D nanospheres and 1D nanorods have been obtained from the use of different solvents (methanol, ethanol, THF, toluene and hexane). Similarly, 3D nanoflowers composed of 1D nanorods with different aspect ratios have been obtained at two different temperatures (120 °C and 150 °C) as a result of their growth time. Furthermore, a systematic evolution of 3D nanoflowers assembled by nanosheets has been studied in different pH (9–12) conditions. The structural composition and surface morphology of the as-synthesized ZnO nanostructures was investigated by X-ray diffractometry (XRD), field emission spectroscopy (FESEM), transmission electron microscopy (TEM). The solid-state UV-vis diffuse reflectance spectra of the as-synthesized ZnO nanostructures showed absorption in the range of 363–383 nm with band gap values of 3.01–3.21 eV. Further, the photoluminescence spectra of the diverse ZnO nanostructures exhibited blue emission bands in the range of 410–460 nm, which originates from the intrinsic defect states of zinc interstitials, zinc vacancies and oxygen vacancies.
Introduction
Nanostructured ZnO materials form an important class of semiconductor materials. ZnO is a well-known n-type semiconductor with a bandgap of 3.4 eV and a large free excitation binding energy (60 meV).1,2 Furthermore, ZnO is relatively environment friendly because it is non-toxic and does not give out toxic products during the growth process.3 It is also biocompatible.4,5 Numerous strategies to control and monitor the size, dimensionality, and morphology of ZnO nanomaterials have been introduced due to their role in determining the magnetic, electrical, optical, and other properties.6–11ZnO nanostructures having diverse morphologies have received enormous attention for their potential use in high performance devices.12 There are numerous reports where ZnO has been produced with different morphologies by various synthetic methods: vapor–liquid–solid (VLS) processes, chemical vapor deposition (CVD), and thermal evaporation are three methods that have been used for fabricating one-dimensional ZnO nanowires or wire arrays onto different substrates. There are many other approaches that have been used to achieve other ZnO nanostructures, such as hydrothermal methods,13 solvothermal methods,14 sol–gel processes,15 laser-induced decomposition,16 ultrasonic irradiation methods,17 microwave irradiation techniques18 and vapor phase transport.19 Among all these techniques, solution-based chemical routes, such as hydro-/solvothermal methods are the most prominent and effective processes. These provide an excellent control over stoichiometry, compositional modification, morphology, size and shape of nanostructures with inexpensive equipments – a key in this area. Therefore, a low-cost and simplified hydrothermal route has been adopted for the synthesis of ZnO nanostructures which offers several advantages in terms of operational simplicity, reliability, repeatability, low temperature, scalability, low cost, ease of composition control and complex procedures restrict further development in actual applications. Since hydrothermal synthesis is very much sensitive to the growth parameter variations,20–24 the change and control of parameters – solvent, temperature and pH – can be successfully used for controlling the morphology of the nanostructures (Fig. 1). Other factors like growth process25 and reactant concentration26 also significantly control the morphology of the as-synthesized nanostructures. Thus, the synthesis of various morphologies of ZnO can be achieved by understanding the influence of each parameter during the growth process. In this regard, the choice of a solvent can help in influencing the crystallization process as well as the shape (affecting the aspect ratio) of ZnO nanoparticles.27 The surface morphology and porosity of ZnO nanostructures are important for the optoelectronic and electrical properties.28–30
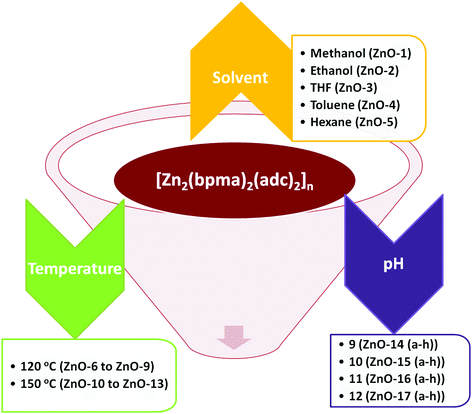 | ||
| Fig. 1 Schematic representation of a systematic variation of solvent, temperature and pH for fabricating diverse ZnO nanostructures. | ||
In the present work, we report the synthesis of hierarchical ZnO nanostructures via the solvent, temperature and pH assisted hydrothermal method utilizing a water soluble coordination polymer (CP) [Zn2(bpma)2(adc)2]n as the single-source precursor. A diversity in the daughter ZnO nanostructures has been obtained from the utilization of one parent CP. The novelty of this work is not only to achieve diverse ZnO nanostructures – 0D nanospheres, 1D nanorods, 2D nanosheets and 3D nanoflowers, from a solution-based hydrothermal method but also to investigate the effect of parameters – solvent, temperature and pH on their formation. These ZnO nanostructures can be utilized in optoelectronics and high performance devices. For example, ZnO nanoflowers with a star like structure composed of nanorods can be used in optoelectronic devices and solar cells,31 and ZnO nanoparticles can be active materials for gas sensor applications.32 Whereas, ZnO microflowers can act as a scattering layer for ZnO-based dye-sensitized solar cells with enhanced conversion efficiency,33 and as antimicrobial agents against Escherichia coli.34 Furthermore, the single-source precursor use in the formation of diverse nanostructures is rare and remarkable compared to the literature reports with modified procedures and precursors to achieve desired morphologies.
Experimental section
The analytical grade chemicals used in this work were obtained from commercial sources. These were used as received without further purification. [Zn2(bpma)2(adc)2]n was prepared in gram quantities following the reported method.35Synthesis of ZnO-1 to ZnO-5 in different solvents
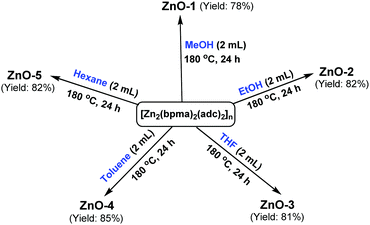
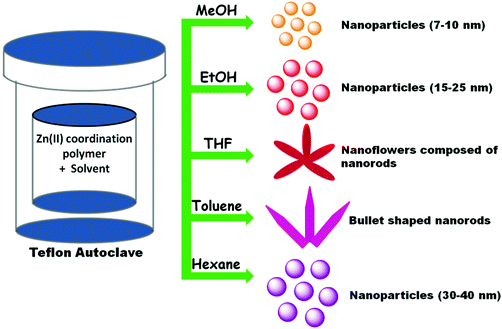
For a general reaction, 0.05 mmol of [Zn2(bpma)2(adc)2]n (39 mg) was added in five 3 mL Teflon reactors containing 2 mL of different solvents (methanol, ethanol, tetrahydrofuran (THF), toluene, hexane). The hydrothermal reactions were carried out at 180 °C for 24 hours. The reaction mixtures were centrifuged at 4000 rpm for 15–20 minutes for separating the solid followed by washing it several times with solvents employed for synthesis. The solids collected at the bottom of centrifuge tubes were dried at 60 °C for 6 hours to obtain the powdered ZnO particles of fine size.Synthesis of ZnO-6 to ZnO-13 at different temperatures
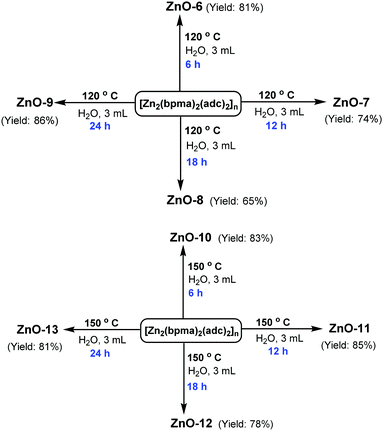
Using 0.05 mmol (39 mg) of [Zn2(bpma)2(adc)2]n and 3 mL of basic aqueous solution containing 120 mg (2.13 mmol) of KOH at a pH = 13 in 5 mL Teflon reactors, the hydrothermal reactions were carried out at two different temperatures (120 °C and 150 °C) for different time intervals (6, 12, 18 and 24 hours). The reaction mixtures were centrifuged at 4000 rpm for 15 minutes for separating the solid followed by washing it several times with ethanol. The solids collected were then dried at 60 °C for 8–10 hours to get the fine powdered ZnO particles.Synthesis of ZnO-14 (a–h) to ZnO-17 (a–h) at different pH
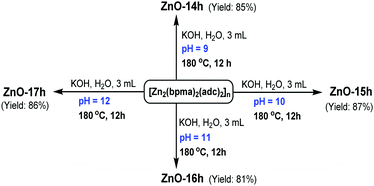
Using 5 mL Teflon reactors, 0.05 mmol (39 mg) of [Zn2(bpma)2(adc)2]n and 3 mL of water containing an appropriate amount of KOH were mixed to attain pH 9, 10, 11 or 12. The hydrothermal reactions were carried out at 180 °C for different time intervals (30 minutes to 12 hours). The as-synthesized mixtures were then centrifuged at 4000 rpm for 15 minutes to separate the solids followed by washing them several times with ethanol. These solids, which were collected at the bottom of centrifuge tubes, were then dried at 60 °C for 6–8 hours to obtain the powdered ZnO particles.Instrumentation
The morphology and chemical composition of the as-synthesized ZnO samples were examined using field-emission scanning electron microscopy (FE-SEM, JEOL, 15 kV). Powder X-ray diffraction (PXRD) patterns were recorded with a Rigaku Ultima IV diffractometer as described earlier.36 The transmission electron microscopy (TEM) was performed on JEOL JEM F200 equipped with a field emission gun operate at 200 kV with 1 mg sample well dispersed in MeOH (10 mL) using a sonicator for 2 minutes and then put on the copper grid, which was allowed to dry using a lamp for 30 minutes. Solid state fluorescence spectra were obtained using a HORIBA Fluorolog 3 spectrofluorometer equipped with a Xenon lamp. Each data set was analyzed with FluorEssence™ software.Results and discussion
Synthesis and structural characterization
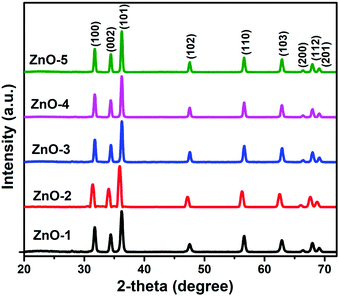
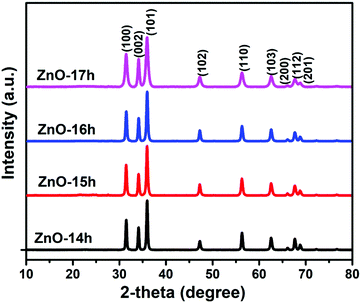
Different morphologies were obtained with the variation in the solvent based on the different polarity, saturated vapor pressure and boiling point of the solvents.37 The ZnO nanostructures obtained with the variation in the solvents were characterized by powder diffraction technique. All the samples exhibited hexagonal wurtzite phase of ZnO (JCPDS 06-2151). The sharpness of the intense peaks obtained confirms the purity of the structures (Fig. 2). The as-obtained ZnO nanostructures exhibited high crystallinity and purity. Using eqn (1), the calculated lattice parameters are given in Table S1 (ESI†).38
 | (1) |
![[thin space (1/6-em)]](https://www.rsc.org/images/entities/char_2009.gif) sin
sin![[thin space (1/6-em)]](https://www.rsc.org/images/entities/char_2009.gif) θ = nλ. Based on V = 0.866a2c, the volume of the hexagonal unit cell was determined while the atomic packing fraction of the nanostructures was calculated using eqn (2). These values are also listed in Table S1 (ESI†).
θ = nλ. Based on V = 0.866a2c, the volume of the hexagonal unit cell was determined while the atomic packing fraction of the nanostructures was calculated using eqn (2). These values are also listed in Table S1 (ESI†). | (2) |
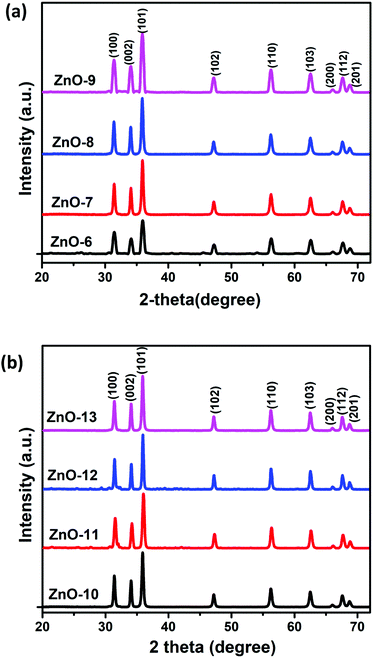
The diffraction patterns of ZnO nanorods grown with different aging times (6 h, 12 h, 18 h and 24 h) at different temperatures 120 °C and 150 °C (ZnO-6 to ZnO-13) were obtained (Fig. 3) to determine the crystalline phase of the nanorods. The 2θ values of diffraction peaks obtained are in good agreement with the standard JCPDS data for ZnO (JCPDS 06-2151).
The ZnO nanorods contain only hexagonal wurtzite structure as the crystalline phase. The formation of nanorods with wurtzite structure could be attributed to the anisotropic growth along (001) plane owing to a faster growth velocity in this direction under hydrothermal conditions. The higher intensity of the (101) diffraction peak in all the patterns further provides the evidence of the preferential growth direction along the c-axis.13 No other traces of impurity were observed in the reflection peaks indicating high purity of the obtained nanorods. The strong and narrow peaks further revealed good crystallinity of the rods. For this set of ZnO nanostructures, the lattice parameters, volume and atomic packing fractions are listed in Table S2 (ESI†).
Microscopic analysis and mechanism of formation
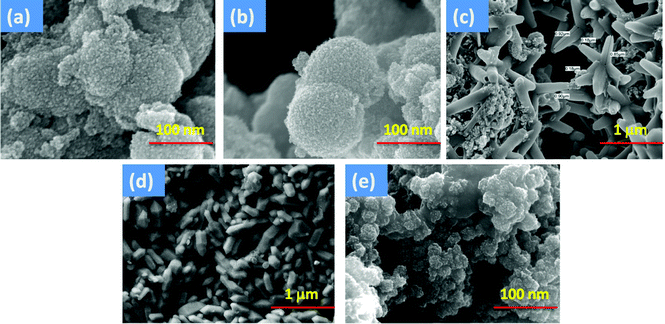 | ||
| Fig. 5 ZnO nanostructures (ZnO-1 to ZnO-5) obtained in different solvents: (a) methanol, (b) ethanol, (c) THF, (d) toluene and (e) hexane. | ||
The boiling points of toluene, THF, ethanol, hexane and methanol are 111, 66, 78, 68, and 65, respectively. Thus, the saturated vapor pressures of these solvents follow the reverse order. A high saturated vapor pressure of the solvents like methanol, ethanol and hexane resulted in a limited growth of ZnO nuclei which gives rise to substantial nucleation of particles. The nanoparticles aggregated by clustering together to reduce the overall surface energy. On the other hand, when the solvents such as toluene and THF were used, which have relatively low saturated vapor pressures, anisotropic growth was favored to yield ZnO nanorods. The nanoparticles aggregated by clustering together to reduce the overall surface energy. On the other hand, when the solvents such as toluene and THF were used, which have relatively low saturated vapor pressures, anisotropic growth was favored to yield ZnO nanorods. A similar study where water was used as the solvent gave varied ZnO nanostructures on changing the amount of water, particularly 3D microflowers in 2 mL water.36 Therefore, the above results clearly indicated the role of saturated vapor pressure of the solvent in producing the ZnO nanostructures with different morphologies as shown in Table 1.
| Sample | Solvent | Boiling point | Morphology |
|---|---|---|---|
| ZnO-1 | Methanol | 65 | Nanoparticles (7–10 nm) |
| ZnO-2 | Ethanol | 78 | Nanoparticles (15–25 nm) |
| ZnO-3 | THF | 66 | Nanorods |
| ZnO-4 | Toluene | 111 | Nanorods |
| ZnO-5 | Hexane | 68 | Nanoparticles (30–40 nm) |
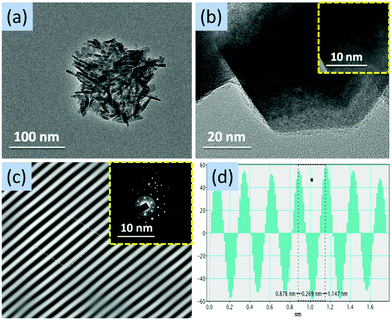
The structural features of ZnO nanostructures were further investigated by TEM measurements for ZnO-2 (Fig. 6) and ZnO-4 (Fig. 7). The nanoparticles of size in the range 15–25 nm are clearly visible in ZnO-2. Whereas, in case of ZnO-4, the nanorods were formed. The lattice spacing in nanospheres (ZnO-2) was found to be 0.258 nm while that in nanorods (ZnO-4) was found to be 0.269 nm. The selected area electron diffraction patterns confirm the presence of diffraction planes obtained from their XRD patterns (Fig. 6c and 7c).
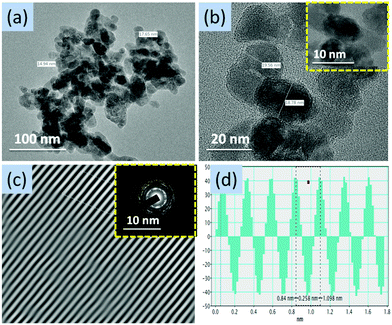 | ||
| Fig. 6 (a) TEM image at 100 nm, (b) TEM image at 20 nm (inset: HRTEM image at 10 nm), (c) lattice fringe (inset: SAED pattern) and (d) d-spacing average of ZnO-2. | ||
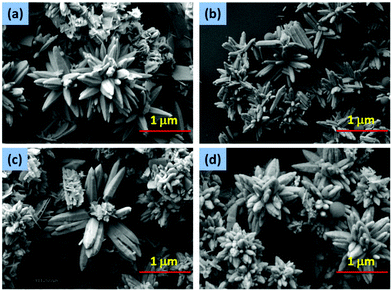 | ||
| Fig. 8 Star-like ZnO nanostructures composed of nanorods with different aspect ratios (a) ZnO-6, (b) ZnO-7, (c) ZnO-8 and (d) ZnO-9. | ||
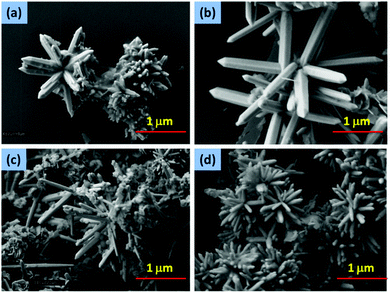 | ||
| Fig. 9 Star-like ZnO nanostructures composed of nanorods with different aspect ratios (a) ZnO-10, (b) ZnO-11, (c) ZnO-12 and (d) ZnO-13. | ||
| Sample | Length (μm) | Diameter (μm) | Aspect ratio |
|---|---|---|---|
| ZnO-6 | 1.04 | 0.30 | 3.46 |
| ZnO-7 | 1.38 | 0.39 | 3.53 |
| ZnO-8 | 1.81 | 0.44 | 4.11 |
| ZnO-9 | 1.03 | 0.41 | 2.56 |
| ZnO-10 | 2.18 | 0.45 | 4.84 |
| ZnO-11 | 2.41 | 0.49 | 4.91 |
| ZnO-12 | 3.19 | 0.55 | 5.80 |
| ZnO-13 | 1.02 | 0.22 | 4.63 |
At 150 °C, a high aspect ratio of the nanorods has been achieved. The solubility of the crystallites increased as the temperature increased leading to a higher growth rate at 150 °C compared to 120 °C. Furthermore, the length and the diameter of the rods increased on extending the growth time from 6 hours to 12 hours (Fig. 8). The length and diameter of the rods continued to increase up to 18 hours (Table 2).
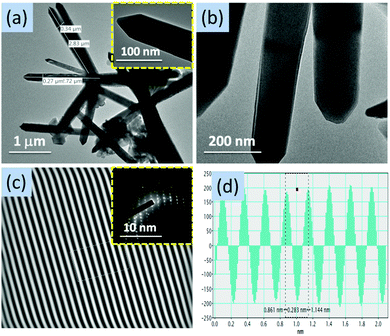
Fig. 10 shows the TEM images of ZnO-8 at the end of 18 hours where nanorods are clearly visible in Fig. 10a and b. The SAED pattern in Fig. 10c confirms the presence of diffraction planes obtained from XRD pattern. The lattice spacing was found to be 0.267 nm as shown in Fig. 10d. The nanorods with less aspect ratio in ZnO-9 were also observed in TEM results (Fig. S1, ESI†) which clearly proves the results obtained in SEM.
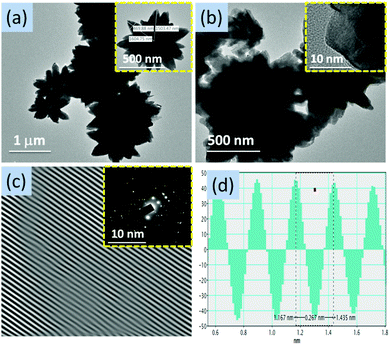 | ||
| Fig. 10 (a) TEM image at 1 μm (inset: TEM image at 500 nm), (b) TEM image at 500 nm (inset: HRTEM image at 10 nm), (c) lattice fringe (inset: SAED pattern) and (d) d-spacing average of ZnO-8. | ||
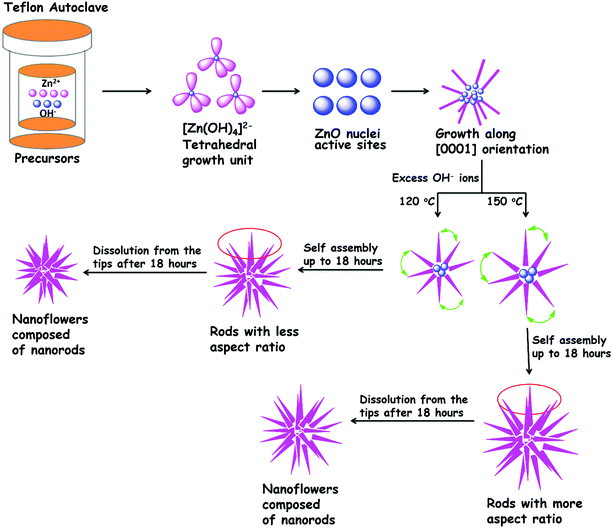
The average length and diameter of the rods produced at 150 °C is more than that at 120 °C (Fig. 9). The self-assembly of the nanorods arrays produced get self-assembled by interweaving of the rods to produce 3D nanoflowers thus reducing the overall surface energy to achieve thermodynamic stability.42
The trend for the increase in the aspect ratios with the extension of growth time is also similar in this case. The growth time controls the length of the nanorods.43 A longer rod is produced with longer growth duration up to a certain time. On further increase of growth time, a decrease in the aspect ratio of the rods due to dissolution of the tips of the rods at the ends can be observed. The experimental results suggest that temperature and growth time control the aspect ratio of nanorods. In this work, the effect of temperature (with different growth times) on the aspect ratio of the nanorods has been investigated in detail. In order to control and design the rods with tailored aspect ratios it is imperative to understand the growth mechanism of these rods. The internal structure as well as the external conditions such as temperature, growth time, etc. are the important parameters in influencing the growth of a crystal.
The chemical reactions involved in the hydrothermal conditions are shown in eqn (3)–(5):
| Zn2+ + 2OH− → Zn(OH)2 | (3) |
| Zn(OH)2 + 2OH− → [Zn(OH)4]2− | (4) |
| [Zn(OH)4]2− → ZnO + H2O + 2OH− | (5) |
![[1 with combining macron]](https://www.rsc.org/images/entities/char_0031_0304.gif) 0
0![[1 with combining macron]](https://www.rsc.org/images/entities/char_0031_0304.gif)
![[1 with combining macron]](https://www.rsc.org/images/entities/char_0031_0304.gif) > V
> V![[1 with combining macron]](https://www.rsc.org/images/entities/char_0031_0304.gif) 010 > V
010 > V![[1 with combining macron]](https://www.rsc.org/images/entities/char_0031_0304.gif) 011 > V000
011 > V000![[1 with combining macron]](https://www.rsc.org/images/entities/char_0031_0304.gif) . The higher growth rate along (0001) direction results in rapid disappearance of this plane leading to a pointed shape at the end of the c-axis, which explains the formation of rods with pointed tips at the ends giving star like ZnO nanostructures. After a certain time, these rods unite with other neighboring rods to evolve into flower-like structures by reducing their surface energy. It has been observed that temperature plays a significant role in tuning the dimensions and aspect ratios of these rods. A higher temperature (150 °C) and an optimized growth time of 18 hours resulted in giving the rods with high aspect ratios, whereas a comparatively less aspect ratios of rods was observed at lower temperature of 120 °C (Scheme 5). Also, a lowering of aspect ratios after 18 hours was observed in both the cases. Thus, the temperature as well as the growth time helped in manipulating and tailoring the length and diameter of these rods.
. The higher growth rate along (0001) direction results in rapid disappearance of this plane leading to a pointed shape at the end of the c-axis, which explains the formation of rods with pointed tips at the ends giving star like ZnO nanostructures. After a certain time, these rods unite with other neighboring rods to evolve into flower-like structures by reducing their surface energy. It has been observed that temperature plays a significant role in tuning the dimensions and aspect ratios of these rods. A higher temperature (150 °C) and an optimized growth time of 18 hours resulted in giving the rods with high aspect ratios, whereas a comparatively less aspect ratios of rods was observed at lower temperature of 120 °C (Scheme 5). Also, a lowering of aspect ratios after 18 hours was observed in both the cases. Thus, the temperature as well as the growth time helped in manipulating and tailoring the length and diameter of these rods.
The TEM images (Fig. 11) of ZnO-12 clearly shows the nanorods with more aspect ratio compared to ZnO-9 nanorods. The SAED pattern in Fig. 11c also confirms the presence of diffraction planes obtained from XRD pattern. The lattice spacing was found to be 0.283 nm as shown in Fig. 13d. The similar results were obtained for ZnO-13 with low aspect ratio as compared to ZnO-12 (Fig. S2, ESI†). The above result for ZnO-6 to ZnO-13 adds additional data points to those observed at 180 °C.34
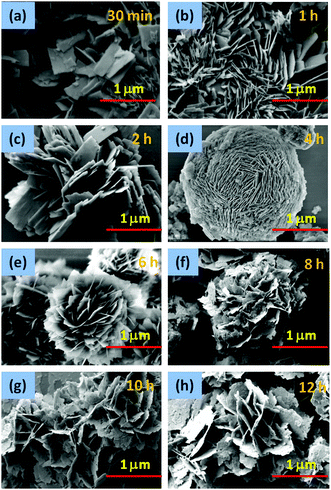 | ||
| Fig. 12 (a–h) Formation of 3D ZnO nanoflowers (at pH = 9) assembled by nanosheets as a result of growth time from 30 minutes to 12 hours. | ||
| Sample | pH | Time | Morphology |
|---|---|---|---|
| ZnO-14 (a–h) | 9 | 30 minutes to 12 hours | Nanosheets to microflowers |
| ZnO-15 (a–h) | 10 | 30 minutes to 12 hours | Nanosheets to microflowers |
| ZnO-16 (a–h) | 11 | 30 minutes to 12 hours | Nanosheets to nanorods to microflowers |
| ZnO-17 (a–h) | 12 | 30 minutes to 12 hours | Nanosheets to nanorods to microflowers |
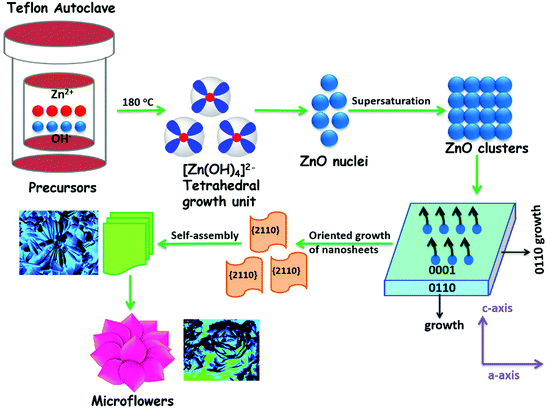
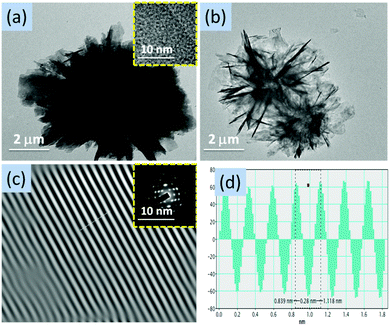
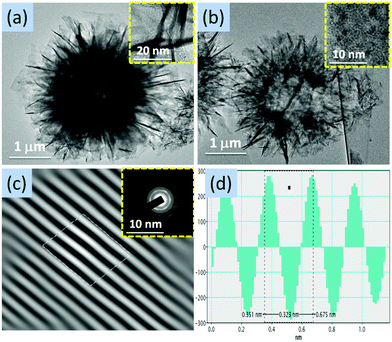
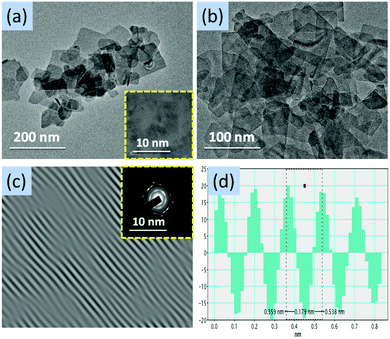
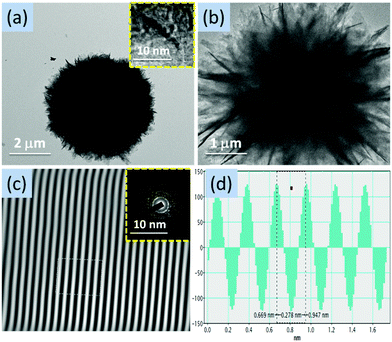
The structural features of ZnO nanostructures obtained at different pH conditions were further confirmed by TEM measurements. Fig. 13, 14 and 16 show the flower-like ZnO nanostructures obtained at the end of 12 hours at pH = 9, 10 and 12, whereas ZnO nanorods (Fig. 15) have been shown which were obtained at the end of 4 hours at pH = 11. The SAED patterns in the TEM images (Fig. 13–16) confirm the results obtained from the XRD patterns. The lattice spacing were found to be 0.28 nm, 0.323 nm, 0.179 nm and 0.278 nm in ZnO-14h, ZnO-15h, ZnO-16d and ZnO-17h, respectively.
Optical properties
| α(hν)1/n = B(hν − Egap) | (6) |
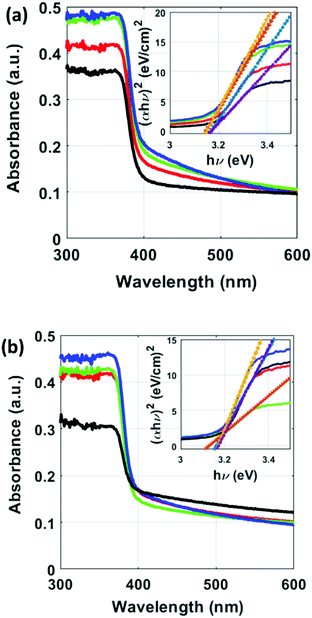
Since the rods with minimum aspect ratios has been obtained at the end of 24 hours; a minimum intensity has been observed in this case and the highest peak of excitonic absorption were observed for the nanorods with a growth time of 18 hours. The higher defect density of the nanorods on their surfaces resulted in different binding energies which explain the reason of the spectral shift in the nanorods. The band gap energies of the ZnO nanorods was calculated using Tauc relation (eqn (6)). The band gap values for ZnO-6 to ZnO-13 are listed in Table S5 (ESI†).
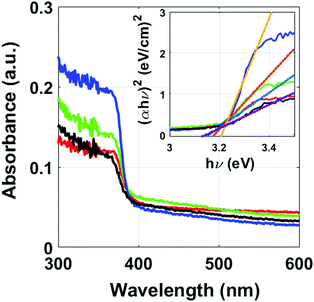 | ||
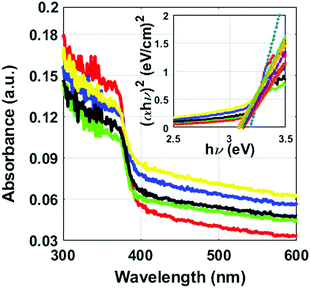
| Fig. 19 Solid state diffuse reflectance spectra of ZnO-14h to ZnO-17h (color code: red, ZnO-14h; green, ZnO-15h; blue, ZnO-16h and black, ZnO-17h); (inset) a plot of (αhν)2versus (hν). | ||
The characterization of the energy band gap (Eg) values for the ZnO-14h to ZnO-17h was done using Tauc relation (eqn (6)). Though the energy band gap values were found to be very close to each other but an increasing trend in the values has been observed with the increase of pH values. The values were found to be 3.13 eV for ZnO-14h, 3.14 eV for ZnO-15h, 3.17 eV for ZnO-16h and 3.21 eV for ZnO-17h.
Photoluminescence properties
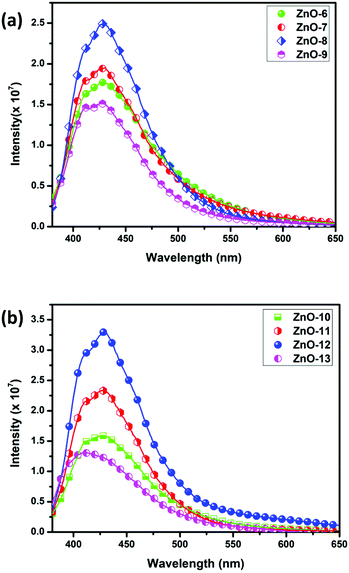
The electronic transition from either the Zni to valence band or from the bottom of conduction band to Oi level resulted in blue emission of these nanorods. With the increase of aspect ratios from 6 hours to 18 hours, a significant increase in the intensity of emission has also been observed in all the cases (ZnO-6 to ZnO-8) at 120 °C. However, a decrease in the emission intensity has been observed for ZnO-9 obtained with a growth time of 24 hours. A similar trend has been observed at 150 °C for different growth times (ZnO-9 to ZnO-13) as shown in Fig. 21b. Thus, the nanorods with higher aspect ratios can show intense emission in the visible range ensuring the exploitation of these rods in the light emitting devices.55
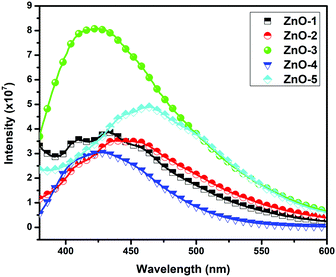
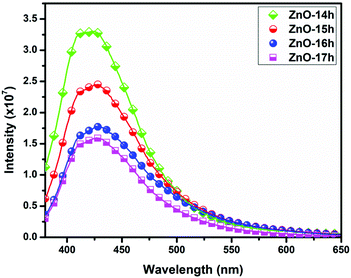
This blue emission is attributed to the intrinsic defects present in ZnO (zinc vacancies and oxygen vacancies) nanostructures.50–52 A decrease in the intensities has been observed for the structures synthesized in more basic conditions with a greater value of pH as illustrated in Fig. 22. The ZnO nanostructures obtained at pH = 9 showed the maximum intensity of absorption whereas a decreasing trend has been observed with increase in pH conditions from 10 to 12.
Conclusions
In summary, this work presented the formation of ZnO nanostructures using a single source precursor in different solvent (methanol, ethanol, THF, toluene and hexane), temperature (120 °C and 150 °C) and pH conditions (9–12). Different morphologies and dimensionalities of ZnO nanostructures have been obtained. For example, 0D nanospheres and 1D nanorods have been obtained with the variation in the solvents based on their boiling points. Whereas, 3D nanoflowers composed of 1D nanorods have been obtained based on the variation in their hydrothermal temperatures. A difference in the aspect ratios of these nanorods was observed as a result of their growth time at two different temperatures. Further, 3D nanoflowers assembled by 2D nanosheets have been obtained in different pH conditions (9–12). A systematic growth of the formation of these flowers up to 12 hours has been demonstrated. UV-vis spectra of these ZnO nanostructures showed an absorption in the range of 360–370 nm. Furthermore, broad blue emission bands in the range of 410–460 nm have been obtained for the ZnO nanostructures as a result of recombination of charge carriers originating from the zinc vacancies and oxygen vacancies.Conflicts of interest
There are no conflicts to declare.Acknowledgements
Funding for this work was provided by IISER, Mohali. S. T. is grateful to MHRD of India for a research fellowship. The X-ray, FESEM, HRTEM and other departmental facilities at IISER Mohali, are gratefully acknowledged.Notes and references
- W. Il Park, G. C. Yi, M. Kim and S. J. Pennycook, Adv. Mater., 2003, 15, 526–529 CrossRef
.
- J.-K. Song, M.-B. Zheng, Z.-J. Yang, H.-Q. Chen, H. Y. Wang, J. S. Liu, G. B. Ji, H.-Q. Zhang and J.-M. Cao, Nanoscale Res. Lett., 2009, 4, 1512–1516 CrossRef CAS
.
- S. Singh, K. C. Barick and D. Bahadur, Nanomater. Nanotechnol., 2013, 3, 57237 Search PubMed
.
- J. W. Rasmussen, E. Martinez, P. Louka and D. G. Wingett, Expert Opin. Drug Delivery, 2010, 7, 1063–1077 CrossRef CAS
.
- Y. Zhang, T. Nayak, H. Hong and W. Cai, Curr. Mol. Med., 2013, 13, 1633–1645 CrossRef CAS
.
- M. A. Garcia, J. M. Merino, E. F. Pinel, A. Quesada, J. De La Venta, M. L. R. González, G. R. Castro, P. Crespo, J. Llopis, J. M. González-Calbet and A. Hernando, Nano Lett., 2007, 7, 1489–1494 CrossRef CAS
.
- J. H. Lee, K. H. Ko and B. O. Park, J. Cryst. Growth, 2003, 247, 119–125 CrossRef CAS
.
- A. B. Djuriić, A. M. C. Ng and X. Y. Chen, Prog. Quantum Electron., 2010, 34, 191–259 CrossRef
.
- P. Nuengmatcha, S. Chanthai, R. Mahachai and W. C. Oh, J. Environ. Chem. Eng., 2016, 4, 2170–2177 CrossRef CAS
.
- S. J. Jeong, H. S. Moon, J. Shin, B. H. Kim, D. O. Shin, J. Y. Kim, Y. H. Lee, J. U. Kim and S. O. Kim, Nano Lett., 2010, 10, 3500–3505 CrossRef CAS
.
- G. D. Yuan, W. J. Zhang, J. S. Jie, X. Fan, J. X. Tang, I. Shafiq, Z. Z. Ye, C. S. Lee and S. T. Lee, Adv. Mater., 2008, 20, 168–173 CrossRef CAS
.
- L. M. Al-Harbi, E. H. El-Mossalamy, H. M. Arafa, A. Al-Owais and M. A. Shah, Mod. Appl. Sci., 2011, 5, 87–91 CAS
.
- S. Xu, Y. Wei, M. Kirkham, J. Liu, W. Mai, D. Davidovic, R. L. Snyder and L. W. Zhong, J. Am. Chem. Soc., 2008, 130, 14958–14959 CrossRef CAS
.
- R. Razali, A. K. Zak, W. H. A. Majid and M. Darroudi, Ceram. Int., 2011, 37, 3657–3663 CrossRef CAS
.
- S. A. Kamaruddin, K. Y. Chan, H. K. Yow, M. Zainizan Sahdan, H. Saim and D. Knipp, Appl. Phys. A: Mater. Sci. Process., 2011, 104, 263–268 CrossRef CAS
.
- C. Fauteux, R. Longtin, J. Pegna and D. Therriault, Inorg. Chem., 2007, 46, 11036–11047 CrossRef CAS
.
- A. Hajnorouzi, R. Afzalzadeh and F. Ghanati, Ultrason. Sonochem., 2014, 21, 1435–1440 CrossRef CAS
.
- S. Cho, S. H. Jung and K. H. Lee, J. Phys. Chem. C, 2008, 112, 12769–12776 CrossRef CAS
.
- A. Bakin, A. Che Mofor, A. El-Shaer and A. Waag, Superlattices Microstruct., 2007, 42, 33–39 CrossRef CAS
.
- G. Amin, M. H. Asif, A. Zainelabdin, S. Zaman, O. Nur and M. Willander, J. Nanomater., 2011, 2011, 1–9 CrossRef
.
- R. Wahab, S. G. Ansari, Y. S. Kim, M. Song and H. S. Shin, Appl. Surf. Sci., 2009, 255, 4891–4896 CrossRef CAS
.
- S. Xu, C. Lao, B. Weintraub and Z. L. Wang, J. Mater. Res., 2008, 23, 2072–2077 CrossRef CAS
.
- S. Das, K. Dutta and A. Pramanik, CrystEngComm, 2013, 15, 6349–6358 RSC
.
- S. Zhu, X. Chen, F. Zuo, M. Jiang, Z. Zhou and D. Hui, J. Solid State Chem., 2013, 197, 69–74 CrossRef CAS
.
- Y. Wang, T. Jiang, D. Meng, J. Yang, Y. Li, Q. Ma and J. Han, Appl. Surf. Sci., 2014, 317, 414–421 CrossRef CAS
.
- T. Jiang, Y. Wang, D. Meng, X. Wu, J. Wang and J. Chen, Appl. Surf. Sci., 2014, 311, 602–608 CrossRef CAS
.
- P. Tonto, O. Mekasuwandumrong, S. Phatanasri, V. Pavarajarn and P. Praserthdam, Ceram. Int., 2008, 34, 57–62 CrossRef CAS
.
- J. Zhang, L. Sun, J. Yin, H. Su, C. Liao and C. Yan, Chem. Mater., 2002, 14, 4172–4177 CrossRef CAS
.
- Y. J. Kwon, K. H. Kim, C. S. Lim and K. B. Shim, J. Ceram. Process. Res., 2002, 3, 146–149 Search PubMed
.
- D. Chandra, S. Mridha, D. Basak and A. Bhaumik, Chem. Commun., 2009, 2384–2386 RSC
.
- B. Kharisov, Recent Pat. Nanotechnol., 2008, 2, 190–200 CrossRef CAS
.
- U. Manzoor, F. Tuz Zahra, S. Rafique, M. T. Moin and M. Mujahid, J. Nanomater., 2015, 189058 CAS
.
- J. Xu, K. Fan, W. Shi, K. Li and T. Peng, Sol. Energy, 2014, 101, 150–159 CrossRef CAS
.
- S. Thakur and S. K. Mandal, New J. Chem., 2020, 44, 11796–11807 RSC
.
- S. Khullar and S. K. Mandal, RSC Adv., 2014, 4, 39204–39213 RSC
.
- S. Thakur and S. K. Mandal, CrystEngComm, 2020, 22, 3059–3069 RSC
.
- B. Sikora, K. Fronc, I. Kaminska, A. Baranowska-Korczyc, K. Sobczak, P. Dłuzewski and D. Elbaum, J. Sol-Gel Sci. Technol., 2012, 61, 197–205 CrossRef CAS
.
- T. Prakash, G. Neri, A. Bonavita, E. Ranjith Kumar and K. Gnanamoorthi, J. Mater. Sci.: Mater. Electron., 2015, 26, 4913–4921 CrossRef CAS
.
- J. Xie, P. Li, Y. Li, Y. Wang and Y. Wei, Mater. Lett., 2008, 62, 2814–2816 CrossRef CAS
.
- S. Kuriakose, B. Satpati and S. Mohapatra, Adv. Mater. Lett., 2015, 6, 1104–1110 CrossRef CAS
.
- P. B. Khoza, M. J. Moloto and L. M. Sikhwivhilu, J. Nanotechnol., 2012, 2012, 1–6 CrossRef
.
- R. Shabannia, Prog. Nat. Sci.: Mater. Int., 2015, 25, 95–100 CrossRef CAS
.
- A. Leelavathi, G. Madras and N. Ravishankar, Phys. Chem. Chem. Phys., 2013, 15, 10795–10802 RSC
.
- S. Xu and Z. L. Wang, Nano Res., 2011, 4, 1013–1098 CrossRef CAS
.
- C. Wang, Y. Gao, L. Wang and P. Li, Phys. Status Solidi A, 2017, 214, 201600876 Search PubMed
.
- Y. Aditya Sumanth, R. Annie Sujatha, S. Mahalakshmi, P. C. Karthika, S. Nithiyanantham, S. Saravanan and M. Azagiri, J. Mater. Sci.: Mater. Electron., 2016, 27, 1616–1621 CrossRef CAS
.
- Z. Wang, X. Qian, J. Yin and Z. Zhu, Langmuir, 2007, 20, 3441–3448 CrossRef
.
- A. N. Redkin, L. Chow, I. M. Tiginyanu, G. Chai, V. V. Ursaki, G. A. Emelchenko, O. Lupan and A. N. Gruzintsev, Sens. Actuators, B, 2009, 144, 56–66 Search PubMed
.
- Y.-H. Hwang, B. Weng, C. Chang, H.-K. Kim, J. Qiu, Z. Shi, X. Li and L. Zhao, J. Nanomater., 2014, 2014, 1–11 Search PubMed
.
- D. Segets, J. Gradl, R. K. Taylor, V. Vassilev and W. Peukert, ACS Nano, 2009, 3, 1703–1710 CrossRef CAS
.
- J. B. Xia and K. Cheah, Phys. Rev. B: Condens. Matter Mater. Phys., 1997, 55, 15688–15693 CrossRef CAS
.
- A. Janotti and C. G. Van De Walle, Phys. Rev. B: Condens. Matter Mater. Phys., 2007, 76, 165202 CrossRef
.
- P. Erhart and K. Albe, Appl. Phys. Lett., 2006, 88, 201918 CrossRef
.
- C. Deng, N. Ma, M. Aravind, G. Wang, P. Yu, C. To, N. Hung and D. H. Ng, Mater. Lett., 2004, 58, 2195–2198 CrossRef
.
- D. K. Kwon, Y. Porte and J. M. Myoung, J. Phys. Chem. C, 2018, 122, 11993–12001 CrossRef CAS
.
Footnote |
| † Electronic supplementary information (ESI) available: Lattice parameters, band gap values, SEM and TEM images. See DOI: 10.1039/d0ma00781a |
| This journal is © The Royal Society of Chemistry 2021 |

