
 Open Access Article
 This Open Access Article is licensed under a
 Creative Commons Attribution 3.0 Unported Licence
Tailored N-doped porous carbons via a MOF assembly process for high-performance CO2 uptake†
Fangyuan
Gai
 abc,
Dongying
Zhu
a,
Yunhuan
Wu
a,
Xiaogang
Zhao
*b,
Changhai
Liang
d,
Zhenguo
Liu
c,
Yunling
Liu
b and
Tonghua
Wang
*d
abc,
Dongying
Zhu
a,
Yunhuan
Wu
a,
Xiaogang
Zhao
*b,
Changhai
Liang
d,
Zhenguo
Liu
c,
Yunling
Liu
b and
Tonghua
Wang
*d
aAdvanced Institute of Materials Science, School of Chemistry and Biology, Changchun University of Technology, Changchun 130012, P. R. China. E-mail: gaifangyuan@dlut.edu.cn
bState Key Laboratory of Inorganic Synthesis and Preparative Chemistry, College of Chemistry, Jilin University, Changchun 130012, China
cResearch Institute of Jilin Petrochemical Co. Ltd, Petro. China, Jilin 132021, China
dState Key Laboratory of Fine Chemicals, Carbon Research Laboratory, School of Chemical Engineering, Dalian University of Technology, 2 Linggong Road, Dalian, 116024, China. E-mail: wangth@dlut.edu.cn
First published on 2nd November 2020
Abstract
Striking a balance between the nitrogen content and pore texture of N-containing metal–organic framework (MOF)-derived carbon is a considerable challenge for high-performance CO2 capture. The high-temperature pyrolysis and activation facilitated well-developed pore structures but resulted in serious nitrogen loss of MOFs. In this work, we developed MOF (ZIF-8)-derived N-doped porous carbons (NPCs) by integrating ZIF-8 with pomelo peel via a co-carbonization and activation process to construct a high-performance CO2 adsorbent. The pomelo peel can effectively prevent the nitrogen loss from the ZIF-8 backbone via pre-melting and polymerization and simultaneously offer the ideal porosity and BET surface area during the co-carbonization and activation process. By tuning the ZIF-8 loading capacity and the activation temperature, the sample NPC-800-4 prepared at 800 °C possessed both ultrahigh surface area (∼1967 m2 g−1) and high N content (∼13.15 wt%). Particularly, the CO2 capacity of NPC-800-4 reached 5.51 mmol g−1 at 25 °C and 9.01 mmol g−1 at 0 °C under 1 bar due to its relatively high content of pyrrolic-N (N5 ∼ 61.2%) and pyridinic-N (N6 ∼ 16.5%), as well as the proper pore size distribution (0.64 nm). In addition, the TPD measurement and CO2 adsorption energy (Qst) of NPC-800-4 also suggested the high desorption activation temperature and energy, indicating a strong binding capacity toward CO2. Moreover, NPC-800-4 exhibited almost constant CO2 uptake in 8 consecutive adsorption–desorption cycles, indicating that the sample with great stability and recyclability would be easily adapted and recycled from industries. This co-carbonization and activation strategy to assembly MOFs with biomass would pave the way for enhancing CO2 capture of MOF-derived carbons.
Introduction
Global warming, resulting from the excessive emission of greenhouse gases into the atmosphere, is one of the most serious environmental problems.1–3 Among several greenhouse gases, CO2 is considered to be the main contributor, which is responsible for about 60% of the greenhouse effect.4 It is of great importance to reduce the CO2 concentration in the atmosphere for the alleviation of global warming. For industrial applications, CO2 capture using aqueous amines is a principal method due to the low cost.5,6 However, absorption by amine scrubbing suffered from energy consumption, toxicity and equipment corrosion in the regeneration process. To overcome these problems, CO2 adsorption using solid adsorbents is an attractive alternative, which can be applied under various conditions. Thus, many researchers have focused on the development of solid adsorbents with easy reversibility and low energy requirements for efficient CO2 capture. For this purpose, porous solid adsorbents including zeolites, carbons, metal organic frameworks (MOF), oxides and covalent organic frameworks (COF) with high surface area and good stability have been extensively studied in the past decades.7,8Among all the porous materials, porous carbons are the most attractive candidates for the CO2 capture due to their advantages of tunable pore structure, low density, high thermal and chemical stability, large specific surface area, low cost and tailored surface functionalization.9–11 In addition, porous carbons12,13 are not sensitive to water vapor by comparison with other CO2-philic materials. As one of the most fascinating materials, N-doped porous carbons (NPCs) exhibited improved wettability and basicity, leading to the enhancement of CO2 adsorption.14 A variety of N-doped porous carbon materials have been developed by post-treatment and templating approaches for the CO2 capture. For instance, biomass-renewable materials such as fir bark,15 bamboo,16 pomelo peel17 and coconut shell18 have been utilized as NPC precursors to be thermal treated and activated by KOH for pore structure development. However, the preparation of biomass-derived NPCs by post-treatment is less controllable in both porosity and functionality. In contrast, the templating method6,19,20 is effective for controlling the pore structure and surface chemistry of the NPC. By using the templating method, the obtained NPC could be adapted from the template and additional carbon source, and thus the more ordered pore structure and controllable N-doping gained from the design of the N-containing carbon precursor.21–23 In this context, for improving CO2 adsorption, it is crucial to survey a suitable carbon precursor to obtain well-developed pore structure and high N-containing NPCs.
As one of the most fascinating precursors of the NPC, the MOF has received much attention owing to its flexible preparation, high surface area, exclusive periodic structure, and abundant C-species in the ligands.24–27 In addition, the N-containing ligand could offer the carbonized MOF skeleton functionalized with N-doping. All these unique features make the MOF work not only as a carbon precursor but also as a template to construct NPCs.28,29 Especially for ZIF-8, a great deal of attention has been paid to develop NPCs from such a N-rich and commercialized MOF to improve CO2 uptake.30–32 By using ZIF-8 as a template, and furfuryl alcohol and NH4OH as additional carbon and nitrogen sources, Xu and co-workers constructed NPCs with a high surface area of 2747 m2 g−1 and a N content of 2.7% at 900 °C, which exhibited a CO2 uptake of 3.9 mmol g−1 under ambient condition.33 Moreover, the direct carbonization of ZIF-8 has been studied by Guo and co-workers, in which the pore structure could be tuned by adjusting the crystal size and the carbonization temperature.34,35 By carbonization of ZIF-8 at 700 °C,35 the resultant NPC exhibited a CO2 uptake of 3.8 mmol g−1 of under ambient condition. Besides the abovementioned, the activation method also adapted to tune the pore structure of ZIF-8-derived NPCs.36,37 By activation with KOH, Xia and co-workers developed ZIF-8-derived NDCs with higher textural properties (specific surface area ∼3700 m2 g−1) but lower CO2 adsorption (2.61–2.83 mmol g−1) and N content (5.3%), compared with the direct carbonized ZIF-8.37 From the literature, we found that although ZIF-8 has been utilized with nitrogen-enriched ligands, well-defined crystal size, proper pyrolysis parameters and additional nitrogen sources, the CO2 uptake of ZIF-8 derived NPCs are still not satisfying. It is still a big challenge to develop high-performance CO2 adsorbents based on ZIF-8-derived NPCs.
For obtaining ideal CO2 capacity, the two main factors (pore size and N-containing) of ZIF-8-derived NPCs should be precisely controlled.10,38 On the one hand, because the CO2 adsorption capacity largely depends on the microporosity ranging from 0.5 to 0.8 nm, the enhancement of effective pore diameter is very important.38,39 On the other hand, both pyrrolic-N and pyridinic-N exhibited basicity, which could serve as an active site to adsorb CO2 by acid–base and hydrogen-bonding interactions, respectively.10,40,41 Thus, increasing the amount of pyrrolic-N and pyridinic-N groups could improve the CO2 uptake of ZIF-8-derived NPCs. In other words, the CO2 uptake quantity is correlated with the effective porosity (0.5–0.8 nm) and enough content of pyrrolic-N and pyridinic-N in ZIF-8-derived NPCs. As one of the most effective and regular strategies, the activation method is effective to facilitate the regulation of the pore size around 0.5 to 0.8 nm and tune the BET surface area.42 However, the high temperature of activation process always caused a serious loss of pyrrolic-N and pyridinic-N in ZIF-8-derived NPCs.43,44 Therefore, for improving CO2 adsorption, how to strike a balance between effective nitrogen content and pore texture of ZIF-8-derived NPCs is a fundamental task.
In this work, we selected N-containing pomelo peel as a secondary carbon and nitrogen source to assemble with N-rich ZIF-8 for the preparation of ZIF-derived NPCs by co-carbonization and activation, in which the pomelo peel not only offers additional pores, carbon and nitrogen, but also prevents nitrogen loss from the ZIF-8 backbone through pre-melting and polymerization during high-temperature (800 °C) treatment. By tuning the assembly amount of ZIF-8 and the co-carbonized temperature, NPC-800-4 exhibited a well-maintained N-content of pyrrolic-N (61.2%) and pyridinic-N (16.5%), which served as effective activated sites of CO2 adsorption. Moreover, the porosity of NPC-800-4 is precisely controlled with a size distribution of 0.64 nm and an ultrahigh BET surface area of 1967 m2 g−1. The CO2 capacity of NPC-800-4 reached 5.51 mmol g−1 under ambient condition, which is higher than that of any other ZIF-8-derived NPC. To the best of our knowledge, there is still no comprehensive investigation of biomass materials effect on the prevention of N-loss in MOFs during NPC formation from high temperature so far. The co-carbonization and activation strategy of the ZIF-8 assembled pomelo peel would build the bridge between biomass materials and MOFs, which offered a potentially cost-effective method to improve the CO2 uptake of NPCs.
Experimental section
Materials
The chemicals 2-methylimidazole (2-Hmim), (Zn(NO3)2·6H2O), nitric acid, methanol, and potassium hydroxide were purchased from Aladdin Company, Shanghai, China. The origin pomelo peel was obtained from pomelos of commercial plantation area in Guangxi Province, China. Deionised water was used in the experiment (resistivity ≥18.2 MΩ). All chemical reagents and solvents were used without further purification.Pre-treatment of pomelo peel
The pre-treatment of pomelo peel was performed according to the literatures.17,45 First, small pieces of the sponge-like peel were removed from the yellow outer skin of pomelo and washed with water. Then, the as-washed sponge-like peel was placed in an oven at 80 °C for 24 hours to make it dry. The dried pomelo peel was ground in a mortar to get a white powder. Then, 10 g of white powder was put into 1 L of the NaOH (1 M) solution and heated to 80 °C for 3 hours to form a suspension. The suspension was filtered and freeze-dried for 12 hours to get a solid powder. The solid powder was dispersed in 1 L of nitric acid (1 M) at 80 °C for 4 hours to obtain a carboxyl-modified pomelo peel (PP-COOH yield 37%).Growth of ZIF-8 on pomelo peel
The mixture of Zn(NO3)2·6H2O powder (1.46 g) and 2-methylimidazole (1.62 g) was weighed at room temperature and added into 100 mL of CH3OH. After that, 3 g of PP-COOH was added to the above mixture and stirred for 24 hours, which turned into a uniform white suspension. The white condensation was filtered from the suspension and freeze-dried to get ZIF-8-assembled pomelo peel (ZIF-8-PP-1).ZIF-8-PP-2, ZIF-8-PP-3, ZIF-8-PP-4 and ZIF-8-PP-5 were obtained from this method by adding different amounts of Zn(NO3)2·6H2O powder, 2-methylimidazole and CH3OH as 3, 9, 18 and 27 times of that used in ZIF-8-PP-1 to make the mass ratio of ZIF-8 and PP-COOH as 1![[thin space (1/6-em)]](https://www.rsc.org/images/entities/char_2009.gif) :3, 1:9, 1:18 and 1:27.
:3, 1:9, 1:18 and 1:27.
Co-Carbonization and activation of ZIF-8-PP
As shown in Scheme S1 (ESI†), 1.0 g of dried ZIF-8-PP-1 composite and 1.5 g of KOH were mixed well and placed in an alumina boat of a tube furnace. First, the mixture was heated to 350 °C under a flow of air to eliminate volatile substances. Then, the furnace was heated to the co-carbonization and activation temperature (600 °C, 700 °C and 800 °C) in a nitrogen atmosphere and maintained at the target temperature for 3 hours in flow nitrogen, and the heating rate was 10 °C min−1. After cooling down, the resulting mixtures were washed several times with 1 M of HCl at room temperature until the pH reached 7 to remove inorganic species, followed by further washing with distilled water. The as-activated sample was dried in an oven at 100 °C for 24 hours to obtain N-doped porous carbons (NPC-600-1, NPC-700-1 and NPC-800-1, yield around 15%). By using the same method, ZIF-8-PP-2, ZIF-8-PP-3, ZIF-8-PP-4 and ZIF-8-PP-5 could also be co-carbonized and activated by KOH under the same condition, and thus NPC-600-2, NPC-700-2, NPC-800-2, NPC-600-3 NPC-700-3, NPC-800-3, NPC-600-4, NPC-700-4, NPC-800-4, NPC-600-5, NPC-700-5, and NPC-800-5 were obtained.Characterization
X-ray diffraction (XRD) measurements were carried out using a Smart Lab diffract meter equipped with a Cu-Kα radiation source (λ = 0.154 nm). Raman spectra were recorded using a Renishaw Raman microscope and collected at an excitation laser of 632.8 nm (1.96 eV). The N2 (77 K) adsorption–desorption experiments were carried out using a Micrometrics ASAP 2020 instrument. Scanning electron microscopic (SEM) images were obtained using a field emission SEM (JSM-7610F) at an accelerating voltage of 10 kV. Thermogravimetric analysis (TGA) curves were tested using an SDT Q600 Analyzer from 25 to 800 °C in a nitrogen atmosphere. Fourier transform infrared (FT-IR) spectroscopy measurements were performed using a PerkinElmer FT-IR/NIR spectrometer. The measurements of UV absorption of the samples were performed using a PerkinElmer spectrometer.Results and discussion
Characterization of ZIF-8-PP
The choice of biomass materials and MOFs for the assembly process is the key point to form carbon precursors for co-carbonization and activation, and thus obtain NPCs with high BET surface area, ideal pore structure and N content for improving CO2 adsorption. It has been previously reported that the pomelo peel-derived NPC possessed an excellent BET surface area, nitrogen content and well-designed 3D structure.17 Our basic idea is to assemble ZIF-8 as an N-rich carbon precursor to integrate with N-containing pomelo peel as the secondary carbon and nitrogen precursor for obtaining NPCs with derived 3D structure, ideal N-content and porosity. Because of the big block, the pomelo peel will pre-melt and polymerize outside the surface of ZIF-8, rather than get into the pore during the co-carbonization and activation process, which may protect the N-content of ZIF-8 backbones from being destroyed by high temperatures.To demonstrate that ZIF-8 assembled with PP-COOH, as shown in Fig. 1A, we characterized PP, PP-COOH, ZIF-8 crystals and ZIF-8-PP composites by FTIR spectra. Compared to PP, PP-COOH exhibited a typical carboxyl stretching vibration located at 1741 cm−1 of the FT-IR spectrum, indicating that COOH was successfully grafted onto the surface of PP. In Fig. 1B, compared with ZIF-8, ZIF-8-PP composites exhibited similar vibration peaks on the FT-IR spectra. By comparison of PP-COOH, the COOH stretching vibration range of ZIF-8-PP composites around 1740–1750 cm−1 indicated a lower intensity due to the electrostatic attraction and coordination effect46 between 2-methylimidazole with –COOH on the surface of PP. Thus, the FTIR spectra effectively suggested that ZIF-8 assembled with PP-COOH.
 | ||
| Fig. 1 FT-IR spectra of (A) PP, PP-COOH, and ZIF-8 and (B) different amounts of ZIF-8-assembled composites. | ||
Further investigation of the assembly process was conducted with X-ray diffraction (XRD) patterns to study the structure of ZIF-8, PP-COOH, and ZIF-8-PP composites (Fig. S1, ESI†). From the XRD pattern of PP-COOH, a broad and weak diffraction was detected, suggesting that PP-COOH exhibited an amorphous structure. Compared with the XRD pattern of pure ZIF-8 powder (yellow line), the XRD pattern of ZIF-8-PP composites suggested almost the same diffraction peaks, indicating that ZIF-8 was successfully assembled on the surface of PP-COOH.
Moreover, the morphologies of the carboxyl-modified pomelo peel (PP-COOH) and ZIF-8-PP composites were also investigated by SEM in Fig. 2 to demonstrate the assembly process. PP-COOH exhibited soft network structures and micrometer-scaled large pores in Fig. 2A, which is promising as an excellent supporting matrix to encapsulate ZIF-8. From Fig. 2B and C, we could find that ZIF-8-PP-1 and ZIF-8-PP-2 showed lower concentrations of ZIF-8-assembly than ZIF-8-PP-3, ZIF-8-PP-4 and ZIF-8-PP-5, suggesting large pieces of matrix wrinkles on PP-COOH. Fig. 2D–F exhibit an increasing amount of ZIF-8 assembly, in which ZIF-8 crystals are embedded and connected by thin fiber network structures of PP-COOH, indicating a successful assembly process of ZIF-8 with both low and high contents.
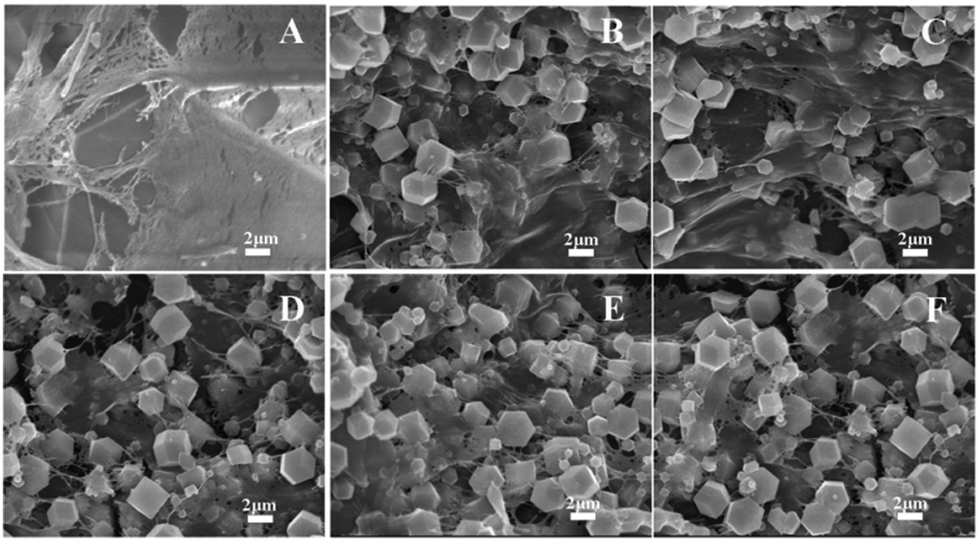 | ||
| Fig. 2 SEM images of (A) PP-COOH, (B) ZIF-8-PP-1, (C) ZIF-8-PP-2, (D) ZIF-8-PP-3, (E) ZIF-8-PP-4 and (F) ZIF-8-PP-5; the scale bar is 2 μm. | ||
Surface properties of NPCs
As shown in Fig. 3, ZIF-8-PP-4 and NPC-800-4 were investigated by a SEM technique to confirm the morphological change during co-carbonization and activation at high temperatures. We found that ZIF-8-PP-4 suggested a uniform ZIF-8 assembly of PP-COOH with a low magnification in a large range of several layers (Fig. 3B), while NPC-800-4 exhibited 3D porous structures after carbonization and activation at 600 °C, 700 °C and 800 °C. The morphology of ZIF-8 could not be detected in the SEM image of NPC-800-4, indicating that amorphous carbons are formed during co-carbonization and activation process.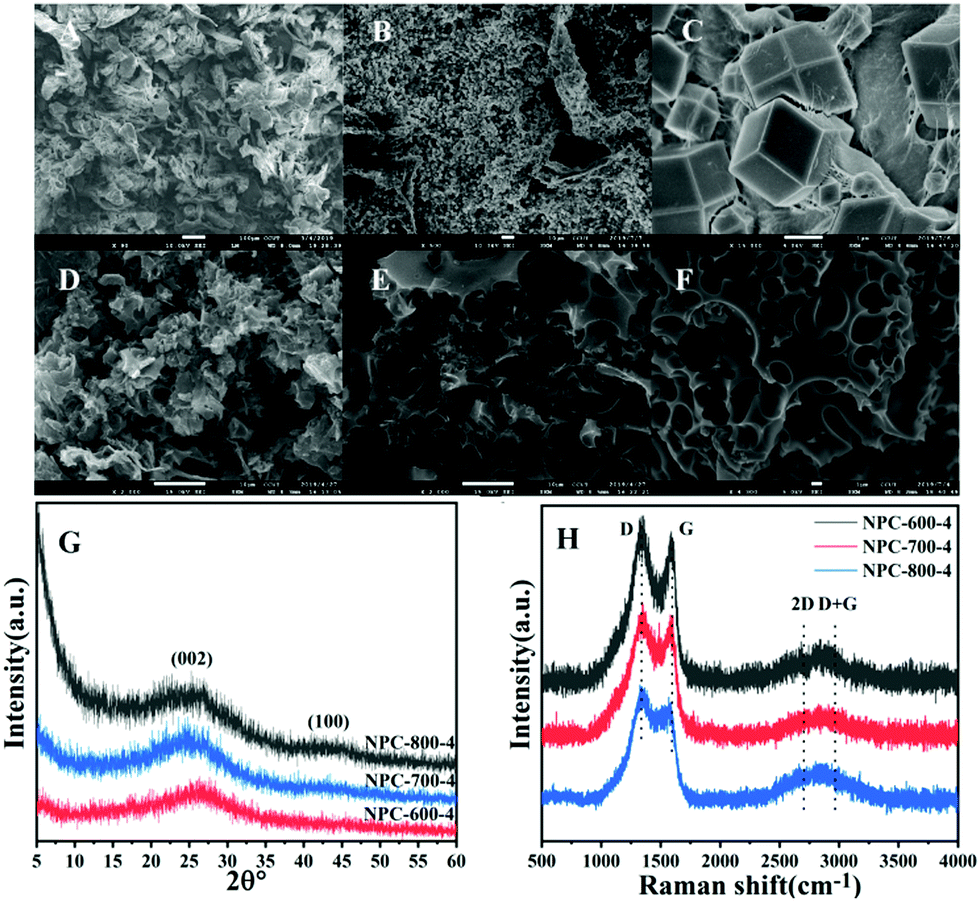 | ||
| Fig. 3 SEM images of PP-COOH (A), ZIF-8-PP-4 (B and C), NPC-600-4 (D), NPC-700-4 (E) and NPC-800-4 (F). The XRD pattern of NPC-800-4 (G) and the Raman spectra of NPC-600-4, NPC-700-4 and NPC-800-4 (H). | ||
Further investigations of NPC-600-4, NPC-700-4 and NPC-800-4 compositions were conducted by wide-angle XRD and Raman spectra. The wide-angle XRD patterns (Fig. 3G) of NPC-800-4 exhibited two broad diffractions around 2θ = 25° and 43°, suggesting an amorphous carbon nature and several graphitic layers formed by increased temperature, which could be further confirmed by Raman spectra (Fig. 3H). The IG/ID value of NPC-800-4 (∼0.873) is higher than that of NPC-700-4 (∼0.868) and NPC-600-4 (∼0.861), indicating that a higher temperature facilitated a higher graphitization degree of NPCs. This result is consistent with the XRD patterns.
As shown in Table 1, the elemental analysis results suggested that with the higher ZIF-8 assembled, the NPC exhibited more N contents, meaning that ZIF-8 played a predominant role for offering N elements of NPCs. The samples treated at high temperatures of 700 °C and 800 °C exhibited minor nitrogen loss compared with the NPC gained at 600 °C, due to the pre-melting and polymerization of PP-COOH covered onto the ZIF-8 surface, thus preventing nitrogen loss from the backbone during co-carbonization and activation process at high temperatures. Moreover, by observation of the CO2 adsorption quantity, we could find that NPC-800-4 exhibited the higher uptake capacity than other NPCs, but its N content (13.15 wt%) was lower than that of NPC-800-5, indicating that the nitrogen content was not completely related to CO2 adsorption capacity of NPCs. This result is in accordance with the literature reports,10 suggesting that only the effective nitrogen species (pyrrolic-N and pyridinic-N) could improve the CO2 uptake of NPCs.
| Sample | CO2 uptake (mmol g−1) | N (wt%) | C (wt%) | S BET (m2 g−1) | V 0 (cm3 g−1) | V t (cm3 g−1) | V n (cm3 g−1) | |
|---|---|---|---|---|---|---|---|---|
| 25 °C | 0 °C | |||||||
| a Surface area was calculated using the BET method at P/P0 = 0.01–0.1. b Total pore volume at P/P0 = 0.99. c Evaluated by the t-plot method. d Pore volume of narrow micropores (<1 nm) obtained from the CO2 adsorption data at 0 °C. | ||||||||
| 800-1 | 3.50 | 5.31 | 4.8 | 60.3 | 1212 | 0.96 | 0.38 | 0.55 |
| 800-2 | 3.55 | 5.61 | 6.3 | 63.9 | 1622 | 0.73 | 0.20 | 0.47 |
| 800-3 | 4.29 | 6.27 | 11.0 | 40.2 | 1686 | 1.11 | 0.11 | 0.91 |
| 800-4 | 5.51 | 9.01 | 13.2 | 60.6 | 1967 | 1.26 | 0.20 | 0.93 |
| 800-5 | 5.40 | 8.74 | 15.8 | 48.8 | 1762 | 1.21 | 0.43 | 0.77 |
| 700-1 | 2.62 | 3.74 | 4.7 | 60.0 | 971 | 0.61 | 0.43 | 0.18 |
| 700-2 | 2.66 | 3.44 | 13.4 | 53.3 | 1016 | 0.62 | 0.35 | 0.25 |
| 700-3 | 3.28 | 5.02 | 12.3 | 56.4 | 1116 | 0.84 | 0.46 | 0.35 |
| 700-4 | 4.07 | 6.45 | 14.5 | 53.8 | 1312 | 0.92 | 0.52 | 0.38 |
| 700-5 | 3.85 | 5.88 | 18.2 | 42.7 | 1191 | 0.97 | 0.35 | 0.58 |
| 600-1 | 2.57 | 3.40 | 5.1 | 44.7 | 464 | 0.17 | 0.18 | 0.09 |
| 600-2 | 2.65 | 3.74 | 14.0 | 55.9 | 657 | 0.40 | 0.34 | 0.05 |
| 600-3 | 2.79 | 4.26 | 14.7 | 49.9 | 744 | 0.33 | 0.32 | 0.04 |
| 600-4 | 3.81 | 5.56 | 17.5 | 46.4 | 966 | 0.42 | 0.42 | 0.07 |
| 600-5 | 3.39 | 5.88 | 20.2 | 40.4 | 855 | 0.37 | 0.37 | 0.07 |
As shown in Fig. 4, more explanations have been given by XPS measurements to demonstrate the pyrrolic-N and pyridinic-N content of NPC-800-4. Fig. S2 (ESI†) suggested the wide-scan XPS spectra of NPC-800-4, which exhibited the obvious C 1s and N 1s peaks located around 284 eV and 400 eV, respectively. By comparing with the C 1s of ZIF-8-PP-4, we could find that the peak (289 eV) of O–C![[double bond, length as m-dash]](https://www.rsc.org/images/entities/char_e001.gif) O disappeared and the peak (286 eV) of C–N became weaker on C 1s of NPC-800-4, suggesting the carbon and nitrogen loss during the co-carbonization and activation processes. To confirm the temperature influence of co-carbonization and activation, the N 1s XPS spectra of NPC-600-4, NPC-700-4 and NPC-800-4 have been deconvoluted into three peaks including pyridinic N at 398.5 eV, pyrrolic N at 400.1 eV, and quaternary N at 401.5 eV (Fig. 4). In the histogram (Fig. 4D), we find that upon co-carbonization and activation, NPC-800-4 contained 61.2% of pyrrolic-N and 16.5% of pyridinic-N, respectively. The higher quaternary N content of NPC-800-4 suggested that NPC-800-4 exhibited a higher pyridinic-N content than NPC-600-4 and NPC-700-4. This result indicated that the high temperature treatment of ZIF-8-PP-4 may facilitate higher contents of pyrrolic-N in the skeleton of NPC-800-4 and, thus, improve CO2 capture.
O disappeared and the peak (286 eV) of C–N became weaker on C 1s of NPC-800-4, suggesting the carbon and nitrogen loss during the co-carbonization and activation processes. To confirm the temperature influence of co-carbonization and activation, the N 1s XPS spectra of NPC-600-4, NPC-700-4 and NPC-800-4 have been deconvoluted into three peaks including pyridinic N at 398.5 eV, pyrrolic N at 400.1 eV, and quaternary N at 401.5 eV (Fig. 4). In the histogram (Fig. 4D), we find that upon co-carbonization and activation, NPC-800-4 contained 61.2% of pyrrolic-N and 16.5% of pyridinic-N, respectively. The higher quaternary N content of NPC-800-4 suggested that NPC-800-4 exhibited a higher pyridinic-N content than NPC-600-4 and NPC-700-4. This result indicated that the high temperature treatment of ZIF-8-PP-4 may facilitate higher contents of pyrrolic-N in the skeleton of NPC-800-4 and, thus, improve CO2 capture.
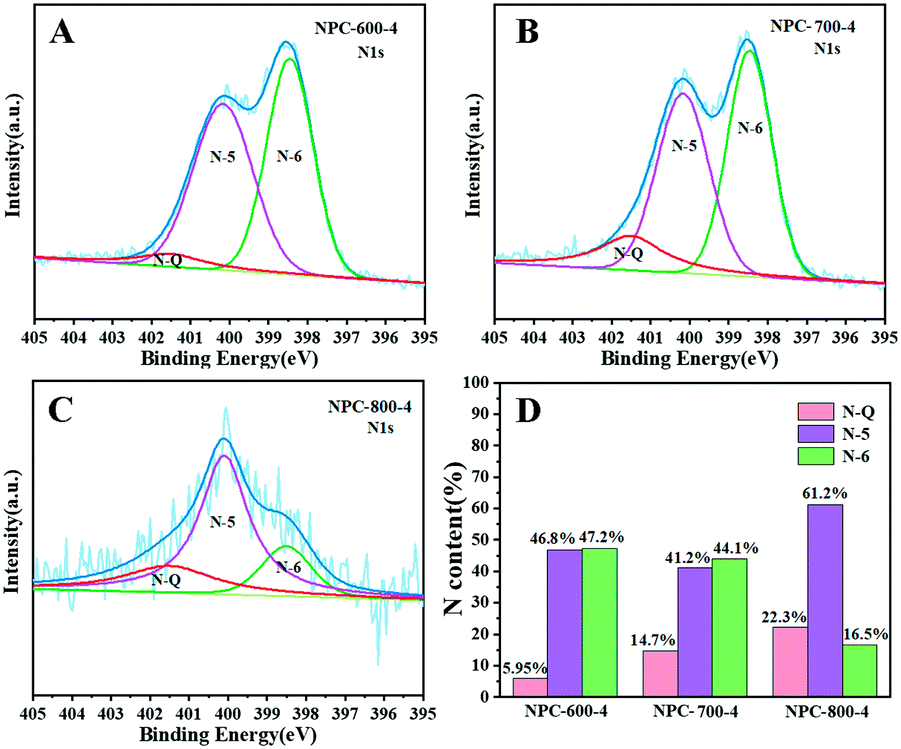 | ||
| Fig. 4 High-resolution XPS patterns of the N 1s spectra of (A) NPC-600-4, (B) NPC-700-4, and (C) NPC-800-4. (D) N content histogram. | ||
Texture features of NPCs
As shown in Fig. 5A, B and Fig. S3 (ESI†), N2 adsorption–desorption isotherms of the NPC at different co-carbonization and activation temperatures (600–800 °C) displays typical type IV isotherms. The obvious adsorptions at a low pressure of 0–0.3 and the capillary condensation at a middle pressure of 0.45–0.9 indicated that all the NPC samples possessed hierarchically porous structures of both micropores and mesopores. The hysteresis loops around 0.9–1.0 may result from the formation of textural pores of NPC samples.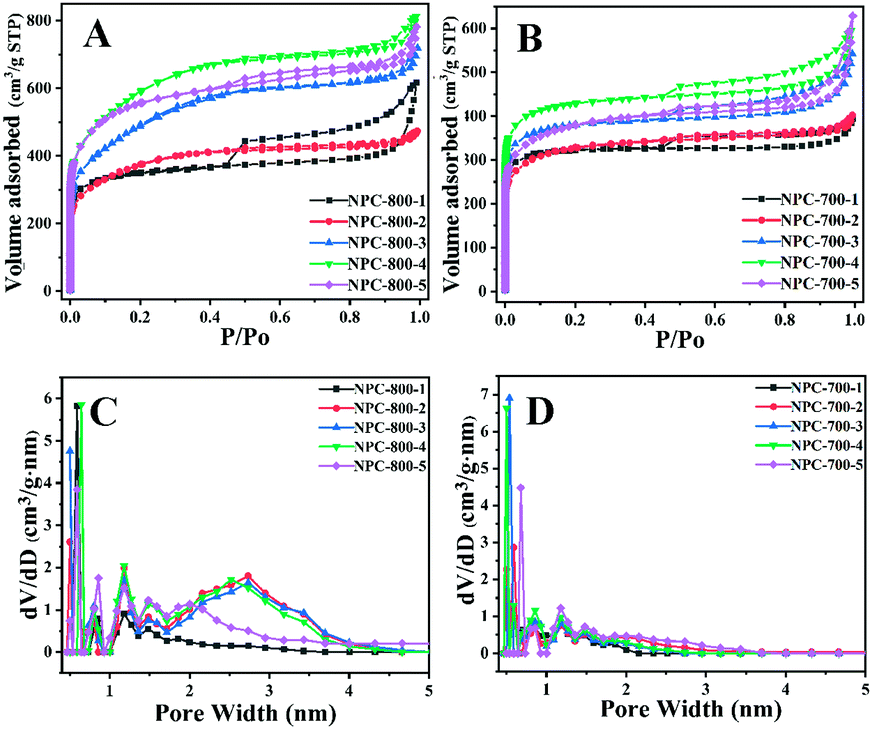 | ||
| Fig. 5 N2 adsorption/desorption (77 K) isotherms of NPCs carbonized at 800 °C (A) and 700 °C (B). DFT pore size distribution curves of NPCs carbonized at 800 °C (C) and 700 °C (D). | ||
As shown in Table 1, increasing the treatment temperature from 600 to 800 °C, the BET specific surface areas of NPC samples obviously increased. For example, the BET surface area of NPC-600-4 is 966 m2 g−1, while the BET surface areas of NPC-700-4 and NPC-800-4 are 1312 m2 g−1 and 1967 m2 g−1. The BET surface area is conformed to this order: SBETNPC-800 > SBETNPC-700 > SBETNPC-600, implying that with certain amounts of ZIF-8 assembled, the high temperature of carbonization and activation facilitated the enhancement of the BET surface area of NPCs. Moreover, the assembly amount of ZIF-8 in the composite could also affect the BET surface area of the resultant NPC samples. From the observation of all the NPC samples treated at different temperatures (600–800 °C), we found that when the mass ratios of ZIF-8 and PP-COOH increased from 1:1 to 1:18, the BET surface area of NPCs gradually enhanced, suggesting that ZIF-8 played an important role to devote the BET surface area during carbonization and activation. However, after increasing the mass ratio of ZIF-8 and PP-COOH to 1:27, the BET surface area suggested an obvious decline by comparison of other samples (SBETNPC-800-4 > SBETNPC-800-5, SBETNPC-700-4 > SBETNPC-700-5, SBETNPC-600-4 > SBETNPC-600-5). This result may ascribe to the incomplete assembly of ZIF-8 on PP-COOH when the concentration of ZIF-8 became higher. Thus, the BET surface area of NPCs is correlated not only with the temperature but also with the amount of ZIF-8 in the composite precursors.
Furthermore, the pore volumes of NPCs gained from different temperatures are shown in Table 1; the total pore volume and narrow micropore (<1 nm) volume of NPC-800-4 exhibited the highest value among all the samples, suggesting that NPC-800-4 may exhibit an excellent CO2 adsorption capacity. We also studied the pore size distribution based on the DFT equilibrium model (Fig. 5C and D); the narrow micropore (<1 nm) diameter of NPC-800-4 is ∼0.64 nm and the mesopore diameter is around 2–3 nm, suggesting the best effect for CO2 capture. The other NPC samples exhibited narrow micropore (<1 nm) of diameter around 0.5–0.6 nm, or almost no mesopores with a diameter around 2–3 nm could be detected, implying that both mesopores and narrow micropores exerted an effect on CO2 adsorption. In other words, by tuning the treatment temperatures and the ZIF-8 assembly quantity, the NPC could be gained with an ideal pore structure and pore diameter for improving CO2 uptake.
CO2 uptake by NPCs
As shown in Fig. 6, the CO2 uptake by NPCs gained from 600–800 °C has been evaluated at 25 °C and 0 °C. The detailed data of CO2 capacity of NPC samples are shown in Table 1. We found that CO2 adsorption at 25 °C and 0 °C is in the range of 2.57–5.51 mmol g−1 and 3.40–9.01 mmol g−1, respectively. In general, NPC-800-4 with an ideal pore size (0.64 nm) and N content (13.15%) exhibited larger CO2 uptake than other samples, which mainly resulted from the synergetic regulation of the ZIF-8 amount and the activation temperature of the carbon precursor and, thus, are beneficial to the adsorption of CO2 molecules. From Fig. 6, we could find that all the samples of NPCs exhibited an enhancement of CO2 uptake for all the samples with the increase in pressure at 25 °C and 0 °C. The shape of CO2 adsorption isotherms also showed a synergetic regulation of pore size based on the factors of ZIF-8 content and activation temperature. In most cases, the NPC gained from higher temperatures suggested bigger pores, and thus exhibited a little lower CO2 uptake under relatively low pressure. However, in this work, most of the NPCs treated at 800 °C showed higher uptake by comparison of other samples, implying that the precise pore structure and properties of NPC-800-4 were regulated by ZIF-8 quantity and activation temperature for improving CO2 uptake. As shown in Fig. S4 (ESI†), we could find that carbon samples derived from the mixture of ZIF-8 and pomelo peel, pomelo peel and naked ZIF-8 exhibited 3.04, 2.75 and 2.96 mmol g−1 of CO2 uptake at 25 °C, whose CO2 uptake were lower than NPC-800-4, suggesting that the assembly process plays an important role to develop carbonization precursors and thus obtain ideal porosity and N-content of the NPC sample.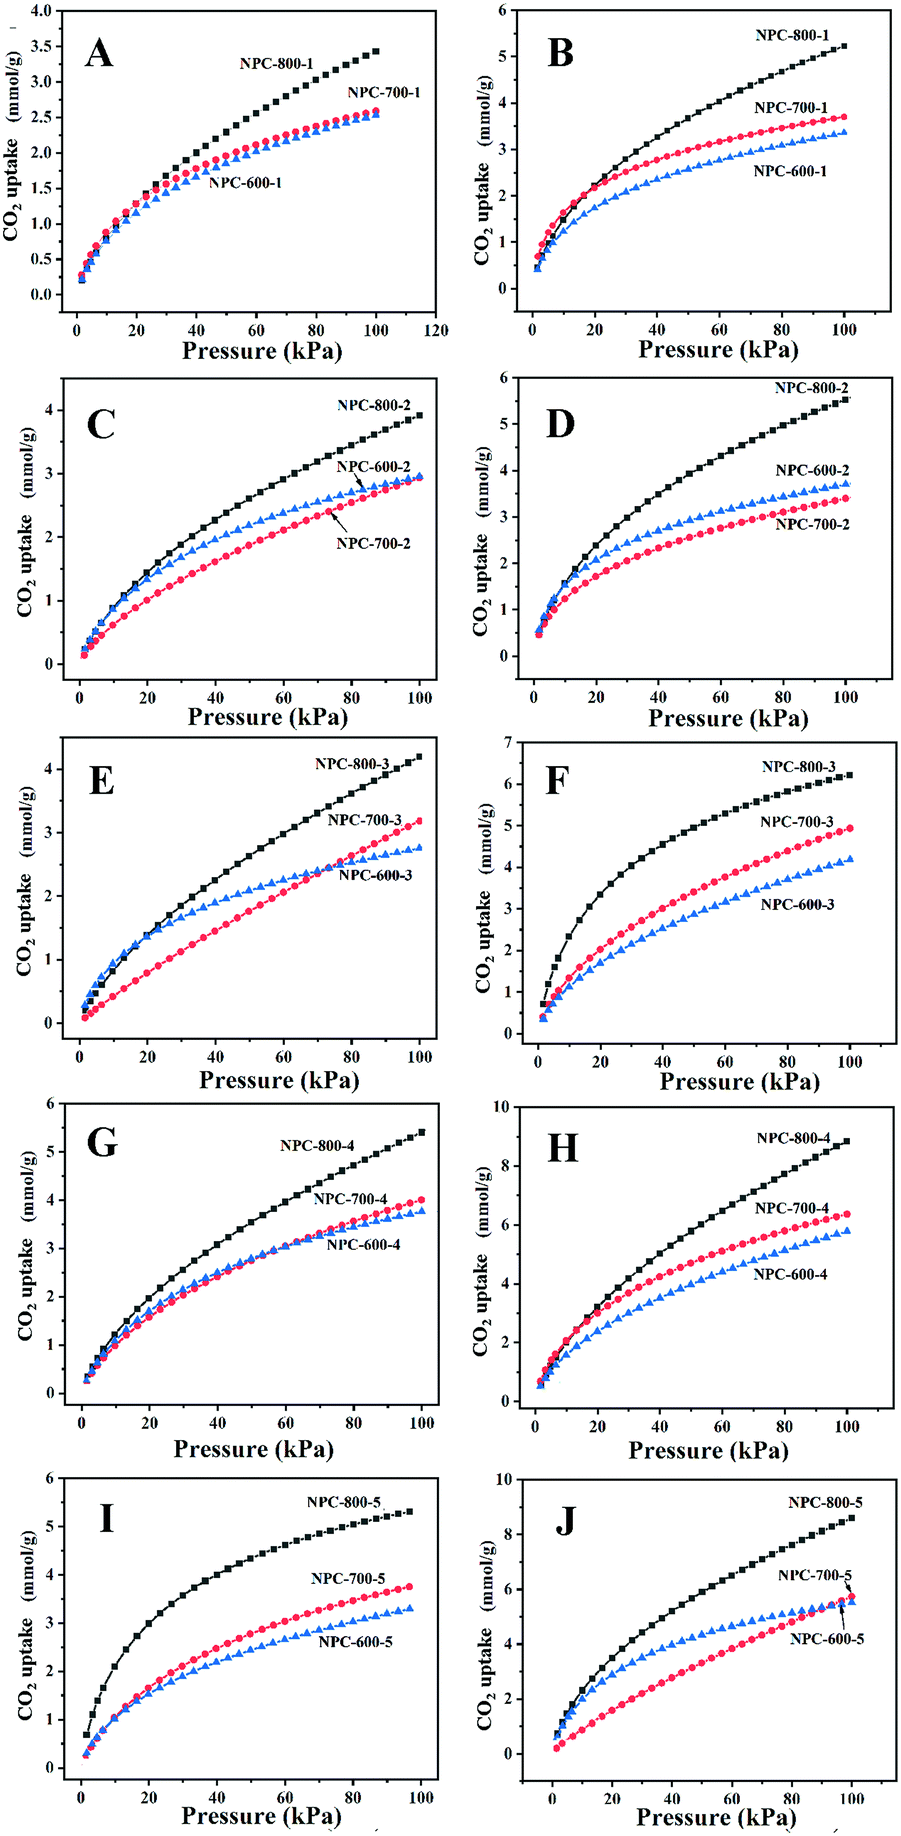 | ||
| Fig. 6 CO2 adsorption of NPC samples at 25 °C (A, C, E, G and I); and at 0 °C (B, D, F, H and J). | ||
As shown in Fig. 7A, the TPD measurements were performed to investigate the strength of interaction between CO2 molecules and NPC-800-4 and the regeneration temperature of NPC-800-4. The CO2 desorption peak is around 107.2 °C, which is slightly higher than that of NPC-700-4 (Fig. S5, ESI†), indicating that the desorption energy of NPC-800-4 is higher than that of NPC-700-4. In other words, the higher activation temperature may facilitate stronger combination between the obtained NPC and CO2 molecules, and thus benefit to improve the CO2 capacity.
 | ||
| Fig. 7 CO2-TPD curve of NPC-800-4 (A). Isosteric heats of adsorption for NPC-800-4 at different CO2 uptakes (B). | ||
Table 2 summarizes several CO2 capture data and the N content of polymers, biomass-derived and MOF-derived NPCs, suggesting the highest CO2 capacity of NPC-800-4 among all the samples. Furthermore, compared to NPC-800-4, the samples with the highest N-content and BET surface area exhibited a smaller CO2 capture capacity. This result suggested that the two factors of N content and BET surface area could not play a dominant role in improving the CO2 capacity of NPCs.
| Carbon precursors | Ref. | BET (m2 g−1) | N (wt%) | CO2 CO2 uptake (mmol g−1) | |
|---|---|---|---|---|---|
| 25 °C | 0 °C | ||||
| K@bio-MOF-1 | 8 | 1129 | 10.16 | 3.29 | 4.75 |
| Chitosan | 10 | 1381 | 4.59 | 3.86 | 5.9 |
| Bamboo | 13 | 2000 | — | — | 7.0 |
| Pomelo peel | 14 | 2725 | 2.85 | — | — |
| NUT-20-EDA | 3 | 1852 | 1.72 | 4.3 | 7.1 |
| Zn/Co ZIF | 27 | 314 | 16.1 | 3.22 | — |
| ZIF-8/FA/NH4OH | 30 | 2747 | 2.7 | 3.9 | 5.1 |
| ZIF-8 | 31 | 942 | — | 1.79 | — |
| ZIF-8 | 32 | 950 | — | 3.51 | — |
| ZIF-8 | 34 | 914 | 21.7 | 3.80 | 5.51 |
| ZIF-8/pomelo peel | This work | 1967 | 13.15 | 5.51 | 9.01 |
To further evaluate the interaction force between CO2 molecules and NPC-800-4, the CO2 adsorption energy (heat of adsorption, Qst) of NPC-800-4 was calculated based on the Clausius–Clapeyron equation using CO2 adsorption isotherms measured at 25 °C and 0 °C. As shown in Fig. 7B, we could find that isosteric adsorption heat curves for NPC-800-4 were calculated in the range of 25.6–34.7 kJ mol−1, which was representative for a physisorption course. At low CO2 uptake, the initial Qst for NPC-800-4 is 32–34.7 kJ mol−1, which is in the range of typical NPCs and is lower than the previous reported value,37,40 suggesting the lower energy requirement for regeneration. The recyclability performance of NPC-800-4 was conducted for repeating several adsorptions-desorption cycles at 25 °C under ambient condition. Between each cycle, the NPC-800-4 was heated at 200 °C for 8 h in vacuum. As shown in Fig. S6 (ESI†), the CO2 uptake exhibited a slight decrease after 8 cycles. Therefore, NPC-800-4 possessed reusability with relatively low energy requirement for regeneration.
Conclusions
In summary, we utilized the assembly process to integrate ZIF-8 with pomelo peel for further co-carbonization and activation to obtain NPC. By tuning the amount of ZIF-8 in the carbon precursor and the activation temperature, the NPC-800-4 exhibited the highest CO2 uptake of 5.51 mmol g−1 at 25 °C and 9.01 mmol g−1 at 0 °C under 1 bar among all the NPC samples. The high CO2 uptake of NPC-800-4 resulted from the precise control of the pore size diameter of ∼0.64 nm, and pyrrolic-N (61.2%) and pyridinic-N (16.5%) contents by using the pomelo peel as secondary carbon and nitrogen precursors, which could prevent nitrogen loss from ZIF-8 during the synthesis of NPCs. Therefore, the assembly of MOFs with biomass materials to form NPC precursors is an effective way to regulate the pore texture, nitrogen content and nitrogen type for effectively improving the CO2 capture under ambient conditions. By using this method, we could introduce new concepts to combine biomass materials and MOFs as NPC precursors for the further development of highly efficient CO2 adsorbents.Conflicts of interest
There are no conflicts to declare.Acknowledgements
This work was supported by the National Natural Science Foundation of China (No. 21501018 and 21878033), the National Key R&D Program of China (No. 2017YFB0603403), Jilin Province Department of Education “13th Five-Year” Science and Technology Project (No. JJKH20181005KJ), Jilin Province Science and Technology Development Program (No. 20190103118JH) and the Open project of State Key Laboratory of Inorganic Synthesis and Preparative Chemistry (No. 2018-29). Dr Fangyuan Gai would like to thank Prof. Huixuan Zhang and Prof. Chunying Duan for their kind support.Notes and references
- W. Lu, M. A. Alam, S. Liu, J. Xu and R. Parra Saldivar, Sci. Total Environ., 2020, 716, 135247 CrossRef CAS.
- Z. Zhang, S.-Y. Pan, H. Li, J. Cai, A. G. Olabi, E. J. Anthony and V. Manovic, Renewable Sustainable Energy Rev., 2020, 125, 109799 CrossRef CAS.
- A.-Z. Peng, S.-C. Qi, X. Liu, D.-M. Xue, S.-S. Peng, G.-X. Yu, X.-Q. Liu and L.-B. Sun, Chem. Eng. J., 2019, 369, 170–179 CrossRef CAS.
- W.-G. Cui, G.-Y. Zhang, T.-L. Hu and X.-H. Bu, Coord. Chem. Rev., 2019, 387, 79–120 CrossRef CAS.
- K. Huang, F. Liu, J.-P. Fan and S. Dai, ACS Appl. Mater. Interfaces, 2018, 10, 36961–36968 CrossRef CAS.
- S. Wang, J. Qin, Y. Zhao, L. Duan, J. Wang, W. Gao, R. Wang, C. Wang, M. Pal, Z.-S. Wu, W. Li and D. Zhao, ChemSusChem, 2019, 12, 3541–3549 CrossRef CAS.
- H. He, J. A. Perman, G. Zhu and S. Ma, Small, 2016, 12, 6309–6324 CrossRef CAS.
- H. He, Q. Sun, W. Gao, J. A. Perman, F. Sun, G. Zhu, B. Aguila, K. Forrest, B. Space and S. Ma, Angew. Chem., Int. Ed., 2018, 57, 4657–4662 CrossRef CAS.
- Y. Pan, Y. Zhao, S. Mu, Y. Wang, C. Jiang, Q. Liu, Q. Fang, M. Xue and S. Qiu, J. Mater. Chem. A, 2017, 5, 9544–9552 RSC.
- Z. Zhang, Z. P. Cano, D. Luo, H. Dou, A. Yu and Z. Chen, J. Mater. Chem. A, 2019, 7, 20985–21003 RSC.
- X. Fan, L. Zhang, G. Zhang, Z. Shu and J. Shi, Carbon, 2013, 61, 423–430 CrossRef CAS.
- P. Zhang, X. Wen, L. Wang, Y. Zhong, Y. Su, Y. Zhang, J. Wang, J. Yang, Z. Zeng and S. Deng, Chem. Eng. J., 2020, 381, 122731 CrossRef CAS.
- G. Lu, H. Wang, Y. Zheng, H. Zhang, Y. Yang, J. Shi, M. Huang and W. Liu, Electrochim. Acta, 2019, 319, 541–551 CrossRef CAS.
- B. N. Bhadra, A. Vinu, C. Serre and S. H. Jhung, Mater. Today, 2019, 25, 88–111 CrossRef CAS.
- L. Luo, T. Chen, Z. Li, Z. Zhang, W. Zhao and M. Fan, J. CO2 Util., 2018, 25, 89–98 CrossRef CAS.
- H. Wei, S. Deng, B. Hu, Z. Chen, B. Wang, J. Huang and G. Yu, ChemSusChem, 2012, 5, 2354–2360 CrossRef CAS.
- Q. Liang, L. Ye, Z.-H. Huang, Q. Xu, Y. Bai, F. Kang and Q.-H. Yang, Nanoscale, 2014, 6, 13831–13837 RSC.
- J. Chen, J. Yang, G. Hu, X. Hu, Z. Li, S. Shen, M. Radosz and M. Fan, ACS Sustainable Chem. Eng., 2016, 4, 1439–1445 CrossRef CAS.
- S. N. Che, K. Lund, T. Tatsumi, S. Iijima, S. H. Joo, R. Ryoo and O. Terasaki, Angew. Chem., Int. Ed., 2003, 42, 2182–2185 CrossRef CAS.
- S. N. Che, A. E. Garcia-Bennett, X. Y. Liu, R. P. Hodgkins, P. A. Wright, D. Y. Zhao, O. Terasaki and T. Tatsumi, Angew. Chem., Int. Ed., 2003, 42, 3930–3934 CrossRef CAS.
- H.-L. Jiang, B. Liu, Y.-Q. Lan, K. Kuratani, T. Akita, H. Shioyama, F. Zong and Q. Xu, J. Am. Chem. Soc., 2011, 133, 11854–11857 CrossRef CAS.
- B. Liu, H. Shioyama, H. Jiang, X. Zhang and Q. Xu, Carbon, 2010, 48, 456–463 CrossRef CAS.
- J.-K. Sun and Q. Xu, Energy Environ. Sci., 2014, 7, 2071–2100 RSC.
- Z. Zhou, L. Yang, Y. Wang, C. He and C. Duan, Curr. Org. Chem., 2018, 22, 1809–1824 CrossRef CAS.
- L. Kan, G. Li and Y. Liu, ACS Appl. Mater. Interfaces, 2020, 12, 18642–18649 CrossRef CAS.
- X. Xu, T. Yang, Q. Zhang, W. Xia, Z. Ding, K. Eid, A. M. Abdullah, M. S. A. Hossain, S. Zhang, J. Tang, L. Pan and Y. Yamauchi, Chem. Eng. J., 2020, 390, 124493 CrossRef CAS.
- W. Jiao, Y. Ban, Z. Shi, X. Jiang, Y. Li and W. Yang, Chem. Commun., 2016, 52, 13779–13782 RSC.
- A. Indra, T. Song and U. Paik, Adv. Mater., 2018, 30, 1705146 CrossRef.
- Y.-Z. Chen, R. Zhang, L. Jiao and H.-L. Jiang, Coord. Chem. Rev., 2018, 362, 1–23 CrossRef CAS.
- J. Cheng, N. Liu, Y. Wang, X. Xuan, X. Yang and J. Zhou, Fuel, 2020, 265, 116972 CrossRef CAS.
- Y. Li, X. Cai, S. Chen, H. Zhang, K. H. L. Zhang, J. Hong, B. Chen, D.-H. Kuo and W. Wang, ChemSusChem, 2018, 11, 1040–1047 CrossRef CAS.
- L. Hu, J. Liu, L. Zhu, X. Hou, L. Huang, H. Lin and J. Cheng, Sep. Purif. Technol., 2018, 205, 58–65 CrossRef CAS.
- A. Aijaz, N. Fujiwara and Q. Xu, J. Am. Chem. Soc., 2014, 136, 6790–6793 CrossRef CAS.
- S. Gadipelli, W. Travis, W. Zhou and Z. Guo, Energy Environ. Sci., 2014, 7, 2232–2238 RSC.
- S. Gadipelli and Z. X. Guo, ChemSusChem, 2015, 8, 2123–2132 CrossRef CAS.
- Q. Wang, W. Xia, W. Guo, L. An, D. Xia and R. Zou, Chem. – Asian J., 2013, 8, 1879–1885 CrossRef CAS.
- F. Bai, Y. Xia, B. Chen, H. Su and Y. Zhu, Carbon, 2014, 79, 213–226 CrossRef CAS.
- S.-Y. Lee and S.-J. Park, J. Colloid Interface Sci., 2013, 389, 230–235 CrossRef CAS.
- M. Idrees, V. Rangari and S. Jeelani, J. CO2 Util., 2018, 26, 380–387 CrossRef CAS.
- Z. Yang, G. Zhang, Y. Xu and P. Zhao, J. CO2 Util., 2019, 33, 320–329 CrossRef CAS.
- H. Wei, J. Chen, N. Fu, H. Chen, H. Lin and S. Han, Electrochim. Acta, 2018, 266, 161–169 CrossRef CAS.
- S. Zhong, C. Zhan and D. Cao, Carbon, 2015, 85, 51–59 CrossRef CAS.
- R. Bai, M. Yang, G. Hu, L. Xu, X. Hu, Z. Li, S. Wang, W. Dai and M. Fan, Carbon, 2015, 81, 465–473 CrossRef CAS.
- L. Rao, R. Ma, S. Liu, L. Wang, Z. Wu, J. Yang and X. Hu, Chem. Eng. J., 2019, 362, 794–801 CrossRef CAS.
- J. Liu, H. Li, H. Zhang, Q. Liu, R. Li, B. Li and J. Wang, J. Solid State Chem., 2018, 257, 64–71 CrossRef CAS.
- L. Yin, Z. Liu, Y. Yang, Y. Guo, G. Zhang, F. Gai, Y. Ao, J. Liu, B. Xin and Y. Liu, Mater. Chem. Phys., 2020, 242, 122563 CrossRef CAS.
Footnote |
| † Electronic supplementary information (ESI) available. See DOI: 10.1039/d0ma00789g |
| This journal is © The Royal Society of Chemistry 2021 |