 Open Access Article
Unravelling the K-promotion effect in highly active and stable Fe5C2 nanoparticles for catalytic linear α-olefin production†
Jin Hee
Lee‡
a,
Hack-Keun
Lee‡
 a,
Kwangsoo
Kim
bc,
Geun Bae
Rhim
d,
Min Hye
Youn
d,
Heondo
Jeong
d,
Jong Hyeok
Park
 c,
Dong Hyun
Chun
*d,
Byung-Hyun
Kim
 *b and
Ji Chan
Park
 *a
*a
aClean Fuel Laboratory, Korea Institute of Energy Research, 152 Gajeong-Ro, Daejeon, 34129, Korea. E-mail: jcpark@kier.re.kr; Tel: +82-42-860-3605
bPlatform Technology Laboratory, Korea Institute of Energy Research, Daejeon, 34129, Korea. E-mail: bhkim@kier.re.kr; Tel: +82-42-860-3218
cDepartment of Chemical and Biomolecular Engineering, Yonsei University, 50 Yonsei-ro, Seoul, 03722, Korea
dCarbon Conversion Laboratory, Korea Institute of Energy Research, 152 Gajeong-Ro, Daejeon, 34129, Korea. E-mail: cdhsl@kier.re.kr; Tel: +82-42-860-3071
First published on 28th December 2020
Abstract
C5–C13 linear alpha(α) olefins (LAOs) are high-value-added chemicals acknowledged by industry. However, using catalysts to elevate the activity and selectivity of LAOs remains a major challenge for Fischer–Tropsch synthesis (FTS). Recently, researchers on catalyst design have reported enhanced LAO production via FTS, but a more detailed understanding of the electron interactions between the active particles and hydrocarbon products is still needed. In the present paper, we report theoretical and experimental results of a potassium (K)-promotion effect on an optimized iron-carbide nanocatalyst (i.e. a carbon-encapsulated iron-carbide nanoparticle supported on nitrogen-doped porous carbon: Fe5C2@C/NPC). The K-doped Fe5C2@C/NPC nanocatalyst shows excellent catalytic performance with a high CO conversion of up to 96.7% at 78 h time-on-stream, C5–C13 LAO selectivity of 16.5% and productivity of 5.9 CH2 μmol gcat−1 s−1, compared to those of the K-free Fe5C2@C/NPC catalyst. The computer simulation model also supports the positive effects of the catalyst with a small amount of K (ca. 1 wt%, K/Fe = 0.05) in the FTS reaction, which well-matched the experimental results.
Introduction
The linear alpha olefins (LAOs), linear hydrocarbons with a C![[double bond, length as m-dash]](https://www.rsc.org/images/entities/char_e001.gif) C bond at the terminal position, are chemical intermediates that are attractive for use in detergents, specialty chemicals, synthetic oils, premium synthetic lubricants and plasticizers, as well as in copolymers.1–4 To date, ethylene oligomerization for homogeneous transition-metal catalysis has been a significant process for LAO production.5,6 For example, more than 1 Mt of alpha olefins per year are produced using the Shell Higher Olefin Process (SHOP), which was discovered in 1968.7,8 On the other hand, promising LAO production methods based on carbon monoxide (CO) and carbon dioxide (CO2) hydrogenation reactions are rarely reported due to the delicate processing conditions and complicated catalyst properties. These are made worse by insufficient understanding of their performance.9–12
C bond at the terminal position, are chemical intermediates that are attractive for use in detergents, specialty chemicals, synthetic oils, premium synthetic lubricants and plasticizers, as well as in copolymers.1–4 To date, ethylene oligomerization for homogeneous transition-metal catalysis has been a significant process for LAO production.5,6 For example, more than 1 Mt of alpha olefins per year are produced using the Shell Higher Olefin Process (SHOP), which was discovered in 1968.7,8 On the other hand, promising LAO production methods based on carbon monoxide (CO) and carbon dioxide (CO2) hydrogenation reactions are rarely reported due to the delicate processing conditions and complicated catalyst properties. These are made worse by insufficient understanding of their performance.9–12
Using the high-temperature Fischer–Tropsch synthesis (HT-FTS) process, which is normally conducted at temperatures of 300–350 °C using an iron-based catalyst, hydrocarbons with carbon chains in the gasoline (C5–C12) range and C2–C4 olefins have been obtained selectively.13–18 However, exquisite control of the catalysts and processes is needed to achieve the desired LAO products and this remains a major challenge.
To increase olefin production, potassium (a representative alkali metal) has been widely used as an additive in HT-FTS.19–23 It can donate electrons to active iron surfaces and increase catalyst basicity, leading to the enhanced performance of the catalyst. For instance, Guo et al. reported bio-promoted iron-carbide catalysts with K, as an efficient catalyst for converting CO2 to LAOs. This combination suppressed the secondary hydrogenation of alkenes on active surfaces.24 Recently, the Tsubaki group reported a bimetallic FeCo catalyst with Y-zeolite for the selective production of LAOs by CO2 hydrogenation.25 Although some iron-based catalysts with alkali promoters have been reported for LAO production, research using computational simulation to interpret their roles in catalysis is still insufficient.26–29
For more efficient production of high value-added hydrocarbons in HT-FTS, active and thermally stable nanocatalysts such as Fe@C core–shells and Fe@graphene with a high Fe load (>20 wt%) and small particle sizes (<20 nm) have been developed.30–33 The catalysts, which have active Fe sites greatly exposed in the FTS reaction, have demonstrated increased productivity of valuable hydrocarbons.
In our previously published work, we reported a new active and stable Fe5C2@C catalyst supported on a structure of N-doped carbon as an optimum catalyst for HT-FTS.34 In addition, we have found that the appropriate K-doping ratios (K/Fe atomic ratio) at the K-doped χ-Fe5C2/charcoal catalysts are in the range of 0.050–0.075.29 From the investigation of the K-promotion effect on the catalyst based on computer simulation, we prepared K-promoted, carbon-encapsulated iron-carbide nanoparticles supported on a nitrogen-doped porous carbon nanostructure (K-Fe5C2@C/NPC). It showed a higher CO conversion rate and better selectivity for linear alpha olefins (LAOs) than those of the K-free Fe5C2@C/NPC catalyst. Furthermore, the initial induction period during the FTS reaction using the catalyst with small amounts of K was significantly reduced, resulting in an increase of overall liquid hydrocarbon productivity, including that of LAOs. The catalyst showed a high C5–C13 LAO productivity of 5.9 CH2 μmol gcat−1 s−1, which is ∼1.5 times higher than that of the K-free Fe5C2@C/NPC catalyst (4.0 CH2 μmol gcat−1 s−1) as well as good thermal stability for the HT-FTS reaction carried out at 340 °C and 1.5 MPa for 78 h.
Experimental
Chemicals
Iron(III) acetylacetonate (Fe(C5H7O2)3, Aldrich, ≥99.9%), urea (CH4N2O) (Aldrich, 99.0–100.5%), potassium carbonate (K2CO3, Aldrich, ≥98.0%) and ethanol (C2H5OH, J.T. Baker, 99.9%) were used without further purification.Computational details
The plane-wave-based spin-polarized density functional theory (DFT) calculations implemented in the Vienna Ab initio Simulation Package (VASP)35–38 were performed to investigate the K-promotion effect on the atomic/electronic structures and adsorption properties of Fe5C2 nanoparticles. The vdW-DF2 functional proposed by Langreth and Lundqvist et al. was used to describe the exchange correlation energy as implemented in the VASP by Klimeš et al.39–42 The projector augmented wave (PAW)43, 44 method was used to describe the interactions between the core and valence electrons. The Kohn–Sham single-electron wave function was expanded by plane-wave basis sets with a cut-off energy of 500 eV. The convergence criteria for the electronic energy and geometry optimization were set at 10−5 eV and 0.02 eV Å−1, respectively. The Brillouin zone was sampled at the Γ-point in all the DFT calculations. First-principles molecular dynamics simulations were employed to generate a reliable nanoparticle model structure. A Fe5C2 nanoparticle structure was prepared by cutting a single crystalline Hägg iron carbide (Fe5C2) structure while maintaining the stoichiometry. Then, the structure was annealed by ramping the temperature from 0 to 1800 K for 100 fs followed by equilibration at 1800 K for 1 ps. The final structure was obtained by ensemble average from the last 500 snapshots during equilibration. The Fe5C2 nanoparticle structure was then quenched to 0 K for 100 ps and relaxed by geometry optimization until the maximal force acting on each atom became less than 0.02 eV Å−1. For a K-doped Fe5C2 nanoparticle structure, the location of two K atoms was chosen as the energetically most-stable configuration among the eight cases considered (see Fig. S1, ESI†).Synthesis of the K-Fe5C2@C/NPC nanocatalyst
The synthesis of the K-free Fe5C2@C/NPC nanocatalyst was described in detail in our previous publication.34 Briefly, 0.5 g of Fe(C5H7O2)3 (1.4 mmol) and 2.5 g of CH4N2O (41.6 mmol) were mixed to uniformity by grinding in a mortar for 5 min. The powder mixture was transferred to alumina boats in a tube-type furnace. The mixture was then heated to 700 °C at a ramping rate of 5.6 °C min−1 under a N2 flow (200 mL min−1) and then maintained at the same temperature for 2 h. After this, serial thermal treatments were carried out under a H2 flow (200 mL min−1) for 4 h at 350 °C, followed by a CO flow (200 mL min−1) for 4 h at 350 °C. Finally, the resulting black powder was cooled to room temperature and then submerged in 30 mL of ethanol under a flow of N2 (500 mL min−1). The powder immersed in 30 mL of ethanol was simply separated using a magnet and then dried in a vacuum oven. For the preparation of the K-doped Fe5C2@C/NPC nanocatalyst, the incipient wetness method was used to merge a K additive with the dried Fe5C2@C/NPC nanocatalyst powder. A solution of aqueous K2CO3 in distilled water (1 mL, 0.024 M) was used. After impregnation with the K solution, the K-incorporated sample was transferred to an alumina boat in a tube-type furnace and then slowly heated at a ramping rate of 2.7 °C min−1 to 350 °C under a CO flow (200 mL min−1). The sample was allowed to remain at 350 K for 4 h under a continuous CO flow. After the thermal treatment, the resulting black powder was cooled to room temperature and then submerged in ethanol under a N2 flow to prevent rapid surface oxidation. The K-Fe5C2@C/NPC nanocatalyst powders were simply separated by magnetic force and then completely dried in a vacuum oven at 50 °C.High-temperature Fischer–Tropsch synthesis reaction
The reaction tests were performed in a fixed-bed stainless-steel reactor tube with an inner diameter of 5 mm. Some (0.1 g) of the catalyst sample were diluted with glass beads (425–600 μm, 2.9 g) to prevent hot-spot generation during the severe exothermic reaction. Before the reaction, the catalyst was reduced in situ under atmospheric pressure by passing a flow of CO (40 mL min−1) over it at 350 °C for 4 h. After reduction, the reaction tests were carried out at 340 °C and 1.5 MPa for 78 h using reactant gas (H2/CO = 1.0 and gas hourly space velocity (GHSV) = 42 NL gcat−1 h−1). The composition of the outlet gases was analysed using a gas chromatograph (Agilent, 3000 Micro GC) equipped with a thermal conductivity detector (TCD) and flame ionization detector (FID). The flow rates of the outlet gases were measured using a wet-gas flow meter (Shinagawa Co.). After the reaction, the solid hydrocarbon products were collected in a hot trap (240 °C) and the liquid hydrocarbon products and water were collected in a cold trap (−3 °C). The isolated solid (wax) and liquid (oil) products were analysed using an offline gas chromatograph (Agilent, 6890 N) and the simulated distillation method (ASTM D2887). Detailed hydrocarbon analysis (DHA) of C5–C13 LAOs (wt%) in the liquid oil sample was performed using ultra-high-resolution capillary gas chromatography and ASTM D6730.Characterization
Transmission electron microscopy (TEM) images and high-angle annular dark-field scanning transmission electron microscopy (HAADF-STEM) images were obtained using a Talos F200X operated at 200 kV. Energy-dispersive X-ray spectroscopy (EDS) elemental analysis and a mapping process were performed using a higher efficiency detection system (Super X: 4 windowless SDD EDS system). The X-ray diffraction (XRD) patterns of the samples were recorded on a high-power powder X-ray diffractometer (Rigaku D/MAX-2500, 18 kW). The N2 sorption isotherms were measured at 77 K with a TriStar II 3020 surface area analyser. Before the measurement, the samples were degassed in a vacuum at 573 K for 4 h. X-ray photoelectron spectroscopy (XPS) was carried out using a K-alpha (TM) with a micro-focused monochromator X-ray source (Thermo VG Scientific, Inc.). The Fe loading amount was measured using inductively coupled plasma optical emission spectrometry (ICP-OES, Thermo Scientific iCAP 6300) and the content of K was determined using ICP-OES (Agilent 5110). The N content in the sample was measured using an oxygen–nitrogen–hydrogen analyser (ONH-2000, ELTRA GmbH). Raman analysis was performed using a Raman microscope (Horiba LabRAM HR Evolution Visible_NIR) with a 514 nm laser.Results and discussion
Synthesis of the K-doped Fe5C2@C/NPC nanocatalyst
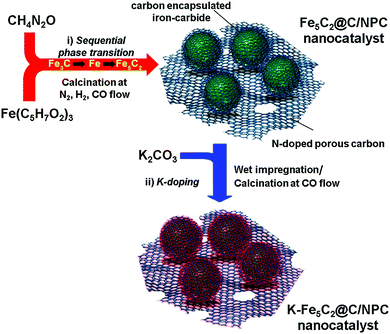
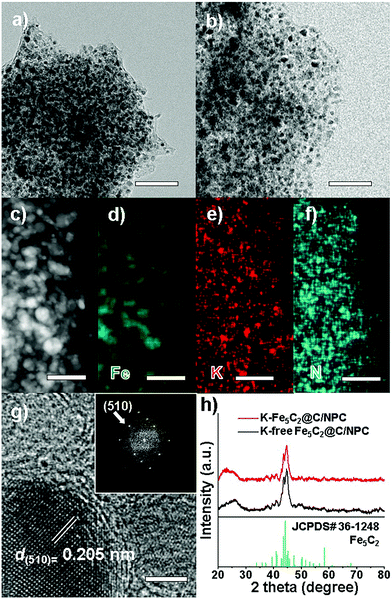
The K-Fe5C2@C/NPC nanocatalyst was prepared through a sequential thermal treatment and the incipient wetness method (Scheme 1). First, the mixed compound prepared by physically grinding Fe(C5H7O2)3 (iron precursor) and CH4N2O (nitrogen-doped carbon source) was transformed by thermal treatment under N2 gas at 700 °C, H2 gas at 350 °C and a CO atmosphere at 350 °C to achieve the desired phases (Fe3C by the initial N2 treatment, Fe by the sequential H2 treatment, and Fe5C2 by the sequential CO treatment). After the serial thermal treatment, a K-free Fe5C2@C/NPC nanocatalyst was obtained. Next, to obtain the K-Fe5C2@C/NPC nanocatalyst, aqueous K solution using the K2CO3 salt as a K source was used to impregnate the Fe5C2@C/NPC nanocatalyst powders. This was followed by the performance of additional CO treatment at 350 °C. In the catalyst, the K-doped Fe5C2 nanoparticles were well dispersed on the carbon structure.The transmission electron microscopy (TEM) images show the overall structures for the K-free and K-doped Fe5C2@C/NPC nanocatalyst (Fig. 1a and b, respectively). The average particle size was 17.2 nm for K-free Fe5C2@C/NPC and 17.4 nm for K-Fe5C2@C/NPC, as determined by measuring 200 particles in the TEM images (Fig. S2, ESI†). The high-angle annular dark-field scanning transmission electron microscopy (HAADF-STEM) image clearly shows Fe5C2 nanoparticles as relatively bright spots originating from the Fe atoms (Fig. 1c). The elemental mappings of iron (green), potassium (red) and nitrogen (cyan) also indicate the uniform distribution of each component (Fig. 1d–f). The HRTEM image shows spherical K-Fe5C2 nanoparticles encapsulated within carbon shells (Fig. 1g). The carbon shells which encapsulate the nanoparticles originated from the carbonized product of urea during the initial calcination process under nitrogen gas. The lattice distance between neighbouring fringes (0.205 nm) and the corresponding Fourier-transform (FT) patterns, demonstrated the formation of iron-carbide crystals that matched the (510) planes of Hägg iron-carbide (Fe5C2).
The X-ray diffraction (XRD) spectra of the K-free and K-doped Fe5C2@C/NPC nanocatalysts show that both kinds of iron carbide particles well-matched with the Fe5C2 phase (Fig. 1f, JCPDS No. 36-1248; space group, C2/c). The broad diffraction peak near 2θ = 25° corresponds to the (002) plane of amorphous carbon. There was no difference between K-Fe5C2@C/NPC and K-free Fe5C2@C/NPC nanocatalysts. Using the Debye–Scherrer equation on the basis of peak broadening of the (020) reflection, the average crystal size of the Fe5C2 nanoparticles was calculated to be 17.2 nm for K-free Fe5C2@C/NPC and 17.5 nm for the K-doped Fe5C2@C/NPC nanocatalyst. These results suggest that the K-doping in the catalyst caused no significant change in either the size or phase of the crystals.
To investigate the chemical structure and elemental surface state of Fe and N in the K-free and K-doped Fe5C2@C/NPC nanocatalysts, X-ray photoelectron spectroscopy (XPS) analysis was performed. The XPS spectra of the energy region of the Fe band exhibited assigned peaks from iron carbide (Fe(0)) at 706–707 eV and from iron-oxides (Fe(2+) and Fe(3+)) at 710–711 eV (Fig. 2a). Partial oxidation of the active iron-carbide nanoparticles occurs due to exposure to the atmosphere during the sampling processes. In the XPS spectrum, the K-doped Fe5C2 nanoparticles showed less intense peaks in the binding-energy ranges. Potassium can effectively stabilize the reduced iron surface against oxidation, as reported elsewhere.45 Because neighbouring K was more easily oxidized than Fe5C2, iron oxidation was suppressed. At the core-level the XPS spectrum of N 1s, two split peaks corresponding to pyridinic N at 400.6 eV and pyrrolic N at 398.4 eV were observed in both K-free and K-doped Fe5C2@C/NPC nanocatalysts (Fig. 2b).
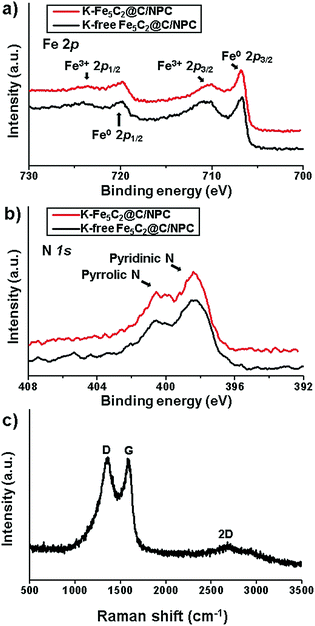 | ||
| Fig. 2 XPS spectra in the energy regions of (a) Fe 2p and (b) N 1s of the K-free Fe5C2@C/NPC and K-Fe5C2@C/NPC nanocatalysts and (c) Raman spectrum of the K-Fe5C2@C/NPC nanocatalyst. | ||
To evaluate the crystallinity and structure of the porous carbon framework of the K-Fe5C2@C/NPC nanocatalyst, Raman spectroscopy was performed (Fig. 2c). The G band near 1580 cm−1 is characteristic of the vibration of sp2-bonded carbon atoms in a 2D hexagonal lattice (E2g mode). The strong peak at around 1350 cm−1, called the D band, was ascribed to the dangling bonds of the in-plane terminations of disordered graphite. The second-order 2D band in the range of 2500–3000 cm−1 is typical of graphitic sp2 materials. The N-doped porous carbon demonstrated a high ID/IG value (∼1.0), suggesting the presence of many disordered sites in the carbon matrix.
The Brunauer–Emmett–Teller (BET) surface area and the porosity in the samples were investigated by N2 sorption measurements (Fig. 3a). The K-Fe5C2@C/NPC nanocatalyst exhibited type IV adsorption–desorption hysteresis. The BET surface area and the pore volume measured were found to be 284.0 m2 g−1 and 0.22 cm3 g−1, respectively. The pore size, calculated by the Barrett–Joyner–Halenda (BJH) method on the desorption branch, was observed to be 3.7 nm (Fig. 3b). From the results of inductively coupled plasma optical emission spectroscopy (ICP-OES), the Fe and K contents were found to be 33.7 and 1.3 wt%, respectively. The total N content in the Fe5C2@C/NPC sample was determined to be 5.0% using a nitrogen analyser (OHN-2000).
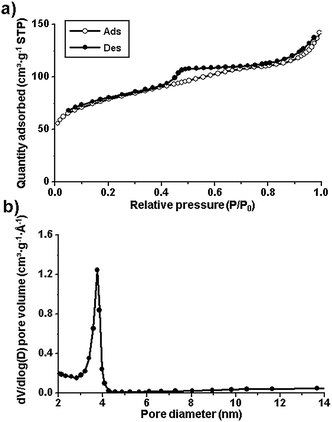 | ||
| Fig. 3 (a) N2 sorption isotherms and (b) pore size distribution diagram of the K-Fe5C@C/NPC nanocatalyst. | ||
High-temperature Fischer–Tropsch synthesis (HT-FTS)
The reaction test with the K-Fe5C2@C/NPC nanocatalyst was performed at 1.5 MPa, 340 °C and a H2/CO ratio = 1, under the high gas hourly space velocity (GHSV) conditions of 42 NL gcat−1 h−1. The CO conversion and selectivity of the catalysts were measured for 72 h over time-on-stream (TOS) by gas chromatography (GC) of the outlet gases containing the unreacted CO, H2, CH4, C2–C4 hydrocarbons and CO2. Liquid oil and solid wax recovered in a cold trap and a hot trap, respectively, were further analysed using simulated distillation (SIMDIS). The K-free Fe5C2@C/NPC nanocatalyst was also used under the same reaction conditions for comparison with the K-doped Fe5C2@C/NPC nanocatalyst.In HT-FTS, the reactions for paraffin and olefin hydrocarbon-product formation and the water-gas shift (WGS) reaction occur as indicated below:
| nCO + (2n + 1)H2 → CnH2n+2 (paraffins) + nH2O | (1) |
| nCO + 2nH2 → CnH2n (olefins) + nH2O | (2) |
| CO + H2O ↔ CO2 + H2 | (3) |
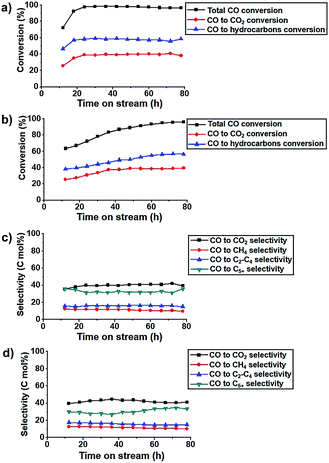
The K-Fe5C2@C/NPC nanocatalyst exhibited very high CO conversion even under high GHSV conditions of 42 NL gcat−1 h−1 (Fig. 4a). The CO conversion in the K-free Fe5C2@C/NPC catalyst gradually increased until ∼78 h from 63.5% at TOS = 12 h to 96.0% at TOS = 78 h. On the other hand, the K-Fe5C2@C/NPC nanocatalyst showed much more rapidly stabilized CO conversions of 72.3% at TOS = 12 h and 92.5% at TOS = 18 h, finally reaching 96.7% at TOS = 78 h (Fig. 4b). The selectivity data of the K-doped Fe5C2@C/NPC nanocatalyst at TOS = 78 h were calculated to be CO2 (39.4%), CH4 (9.6%), C2–C4 (15.2%) and C5+ (35.8%) (Fig. 4c). These values are comparable to those of the K-free Fe5C2@C/NPC nanocatalyst (CO2![[thin space (1/6-em)]](https://www.rsc.org/images/entities/char_2009.gif) :
:![[thin space (1/6-em)]](https://www.rsc.org/images/entities/char_2009.gif) 41.2%, CH4
41.2%, CH4![[thin space (1/6-em)]](https://www.rsc.org/images/entities/char_2009.gif) :
:![[thin space (1/6-em)]](https://www.rsc.org/images/entities/char_2009.gif) 10.2%, C2–C4
10.2%, C2–C4![[thin space (1/6-em)]](https://www.rsc.org/images/entities/char_2009.gif) :
:![[thin space (1/6-em)]](https://www.rsc.org/images/entities/char_2009.gif) 15.1%, C5+: 33.5%) (Fig. 4d).
15.1%, C5+: 33.5%) (Fig. 4d).
The activities of the catalysts were monitored as the iron-time-yield (FTY, i.e. the number of CO moles converted to hydrocarbons per gram of iron per second) over TOS (Fig. 5a). The K-Fe5C2@C/NPC nanocatalyst showed much faster stabilization behaviour, with a rapid increase of the FTY values (up to 4.4 × 10⁻⁴ molCO gFe−1 s−1), than did the K-free Fe5C2@C/NPC nanocatalyst. The FTY value of the K-Fe5C2@C/NPC nanocatalyst was very high relative to the results reported previously for K-doped Fe catalysts (Table S1, ESI†). From the results, it was confirmed that the K added to the Fe5C2 particles contributes to the activation of the catalyst and increases the reactivity.
 | ||
| Fig. 5 (a) FT activity, (b) total syncrude (C5+ hydrocarbons) distribution graphs, (c) Total hydrocarbon product distribution, and (d) ASF plots of C5+ hydrocarbons and chain-growth probability. | ||
To determine the hydrocarbon product distributions and specific hydrocarbon productivity, the detailed composition of the liquid and solid hydrocarbons was determined by ASTM D2887 (Fig. 5b). The K-Fe5C2@C/NPC nanocatalyst showed higher C2–C4 olefins (16.7%) and diesel range C13–C18 hydrocarbons (4.4%), compared to K-free Fe5C2@C/NPC (Fig. 5c). The trend toward heavier hydrocarbons with this catalyst was also observed in relation to the chain-growth probability (α value) of the hydrocarbons. This was determined using the Anderson–Schulz–Flory (ASF) chain-growth mechanism in the following equation, where Wn is the weight fraction of hydrocarbons with carbon number n (Fig. 5d):
log(Wn/n) = log(ln2![[thin space (1/6-em)]](https://www.rsc.org/images/entities/char_2009.gif) α) + n α) + n![[thin space (1/6-em)]](https://www.rsc.org/images/entities/char_2009.gif) log log![[thin space (1/6-em)]](https://www.rsc.org/images/entities/char_2009.gif) α α |
The α value of the hydrocarbons by K-free Fe5C2@C/NPC was calculated to be 0.7952, using the slope of the graph fitted to the linear regression at C5–C43. On the other hand, K-free Fe5C2@C/NPC showed two α values (α1 = 0.7317 at C5–C18 and α2 = 0.8502 at C19–C43) which are attributed to the K-lean sites and K-rich sites of the catalyst, respectively.
The total hydrocarbon (HC) product yield (grams of hydrocarbons generated per gram of iron per second) was measured after 78 h on-stream of the reaction (Fig. 6a). The K-Fe5C2@C/NPC nanocatalyst shows a higher hydrocarbon product yield (5.48 gHC gcat−1 h−1), than that of the K-free Fe5C2@C/NPC nanocatalyst (5.05 gHC gcat−1 h−1). The yields using the former were calculated using the sum of the specific product yields [CH4 (1.57), C2–C4 paraffins (1.06), C2–C4 olefins (0.91), C5–C12 (1.58), C13–C18 (0.24) and C19+ (0.12) gHC gcat−1 h−1]. The detailed yield values of each hydrocarbon product for the K-free Fe5C2@C/NPC nanocatalyst were CH4 (1.41), C2–C4 paraffins (0.98), C2–C4 olefins (0.80), C5–C12 (1.54), C13–C18 (0.21), and C19+ (0.11) gHC gcat−1 h−1.
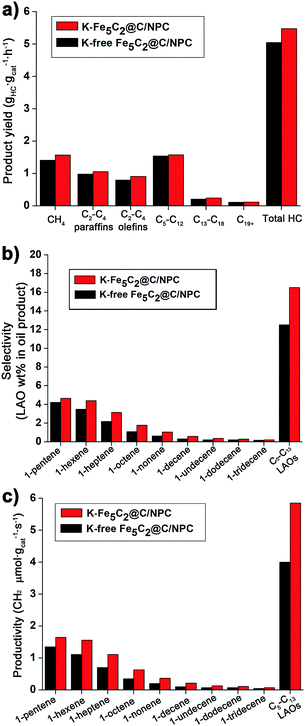 | ||
| Fig. 6 (a) Specific hydrocarbon productivity and (b) C5–C13 LAO selectivity and (c) productivity of K-free Fe5C2@C/NPC and K-Fe5C2@C/NPC nanocatalysts. | ||
The specific C5–C13 LAO content in the liquid oil sample recovered after the HT-FTS reactions was obtained by detailed hydrocarbon analysis. The K-Fe5C2@C/NPC nanocatalyst also showed higher selectivity for C5–C13 LAOs (16.5 wt%), which is the sum of C5 LAO (4.7 wt%), C6 LAO (4.4 wt%), C7 (3.2 wt%), C8 LAO (1.8 wt%), C9 LAO (1.1 wt%), C10 LAO (0.6 wt%), C11 LAO (0.4 wt%), C12 LAO (0.3 wt%), and C13 LAO (0.2 wt%), compared to the K-free Fe5C2@C/NPC nanocatalyst (12.5 wt%) (Fig. 6b). The C5–C13 LAO productivity data (the number of CH2 micromoles assigned to LAOs per gram of catalyst per second) of reactions with K-free Fe5C2@C/NPC and K-Fe5C2@C/NPC nanocatalysts were also calculated, based on the C5–C13 LAO contents obtained (Fig. 6c). The K-Fe5C2@C/NPC nanocatalyst showed ∼1.5 times higher total C5–C13 LAO productivity (5.9 CH2 μmol gcat−1 s−1) than that of the K-free Fe5C2@C/NPC nanocatalyst (4.0 CH2 μmol gcat−1 s−1).
After 78 h of the HT-FTS reaction, the recovered K-Fe5C2@C/NPC nanocatalyst showed high stability, maintaining its original structure without particle aggregation, as a result of the carbon shells protecting the Fe5C2 particles (Fig. S3, ESI†).
Theoretical investigation of the K-promotion effect
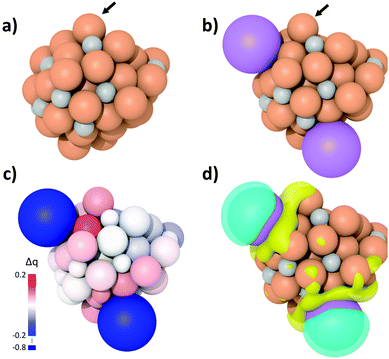
To elucidate the origin of the enhanced LAO selectivity, spin-polarized DFT calculations and subsequent charge density analyses were performed for the K-free Fe5C2 and K-Fe5C2 nanoparticles (Fig. 7a and b). Both Bader charge and differential charge density analyses revealed that K adsorption on the Fe5C2 nanoparticles promotes active electron transfer from K to the adjacent Fe atoms and that these Fe atoms become less positively charged (Fig. 7c and d). The active electron transfer and charge state of the substrate metal atoms have been demonstrated to play an important role in determining the adsorption strength between olefins and metal atoms via π-complexation. In such cases, the metal atoms with more positive charges enhance olefin adsorption.46–50 Thus, the olefin adsorption calculations on the K-free Fe5C2 and K-Fe5C2 nanoparticles were performed (Fig. S4, ESI†) and the adsorption energy was calculated using the following equation:| Eads = E(olefin/nanoparticle) − [E(olefin) + E(nanoparticle)] |
| Adsorption energy (eV) | ||||
|---|---|---|---|---|
| System | C5H10 | C6H12 | C7H14 | C8H16 |
| K-free Fe5C2 | −1.30 | −1.59 | −1.35 | −1.72 |
| K-Fe5C2 | −0.81 | −1.01 | −0.55 | −1.15 |
Conclusions
K-doped Fe5C2@C/NPC nanocatalyst, bearing highly active and stable Fe5C2 nanoparticles (∼17 nm) encapsulated within carbon shells, were prepared via subsequent thermal treatment under the flows of N2, H2 and CO followed by K impregnation. From computational simulations, it appears that Fe5C2 particles with a small amount of K (∼1 wt%, K/Fe = 0.05) exhibit facile C5–C8 olefin dissociation via lowering of the chemisorption energy. The K-doped Fe5C2@C/NPC showed high FT activity and CO conversion (∼97%), as well as good selectivity for C5–C13 LAOs with excellent stability. The K promotion led to facile CO adsorption and dissociation, which increased the basicity of the active Fe5C2 surface. The appropriate electronic state derived from the K-doped Fe5C2 nanoparticles resulted in enhanced selectivity for C5–C13 LAOs along with control of the hydrogenation and desorption rates. In addition, the high load of active Fe (∼34 wt%) with its uniform dispersion on the nitrogen-doped porous carbon support also contributed to enhanced activity and productivity in HT-FTS. With its enhanced CO conversion, reduced induction period and increased selectivity for C5–C13 LAOs, it is anticipated that the K-doped Fe5C2@C/NPC nanocatalyst could optimize the sustainable production of valuable LAOs from HT-FTS.Author contributions
Jin Hee Lee: FTS experiment and drafting; Hack-Keun Lee: data curation and drafting; Kwangsoo Kim: DFT calculation; Geun Bae Rhim: data curation; Min Hye Youn: investigation; Heon-Do Jeong: visualization; Jong Hyeok Park: visualization; Dong Hyun Chun: conceptualization and editing; Byung-Hyun Kim: computer simulation and writing; Ji Chan Park: conceptualization, methodology and writing.Conflicts of interest
There are no conflicts to declare.Acknowledgements
This work was conducted within the framework of a research and development program of the Korea Institute of Energy Research (C0-2419-02) and funded by the National Research Foundation of Korea (NRF) grant funded by the Korea government (No. 2019R1A2C2086827). This work was also supported by the National Supercomputing Center with supercomputing resources including technical support (KSC-2019-CRE-0202).Notes and references
- M. Chen, W. Lu, H. Zhu, L. Gong, Z. Zhao and Y. Ding, Ind. Eng. Chem. Res., 2020, 59, 4388 CrossRef CAS.
- A. Gollwitzer, T. Dietel, W. P. Kretschemer and R. Kempe, Nat. Commun., 2017, 8, 1226 CrossRef.
- A. Chatterjee, S. H. H. Eliasson, K. W. Törnroos and V. R. Jensen, ACS Catal., 2016, 6, 7784 CrossRef CAS.
- Y. Kim, H. B. Im, U. H. Jung, J. C. Park, M. H. Youn, H.-D. Jeong, D.-W. Lee, G. B. Rhim, D. H. Chun, K. B. Lee and K. Y. Koo, Fuel, 2019, 256, 115957 CrossRef CAS.
- G. P. Belov and P. E. Matkovsky, Petroleum Chem., 2010, 50, 283 CrossRef.
- B. L. Small and M. Brookhart, J. Am. Chem. Soc., 1998, 120, 7143 CrossRef CAS.
- W. Keim, Angew. Chem., Int. Ed., 2013, 52, 12492 CrossRef CAS.
- J. Zheng, J. Cai, F. Jiang, Y. Xu and X. Liu, Catal. Sci. Technol., 2017, 7, 4736 RSC.
- M. K. Khan, P. Butolia, H. Jo, M. Irshad, D. Han, K.-W. Nam and J. Kim, ACS Catal., 2020, 10, 10325 CrossRef CAS.
- J. Wang, Y. Xu, G. Ma, J. Lin, H. Wang, C. Zhang and M. Ding, Appl. Mater. Interfaces, 2018, 10, 43578 CrossRef CAS.
- S. L. Soled, E. Iglesia, S. Miseo, B. A. DeRites and R. A. Fiato, Top. Catal., 1995, 2, 193 CrossRef CAS.
- S. Yang, S. Lee, S. C. Kang, S. J. Han, K.-W. Jun, K.-W. Lee and Y. T. Kim, RSC Adv., 2019, 9, 14176 RSC.
- Q. Zhang, J. Kang and Y. Wang, ChemCatChem, 2010, 2, 1030 CrossRef CAS.
- H. M. T. Galvis, J. H. Bitter, C. B. Khare, M. Ruitenbeek, A. I. Dugulan and K. P. de Jong, Science, 2012, 335, 835 CrossRef.
- S. O. Moussa, L. S. Panchakarla, M. Q. Ho and M. S. El-Shall, ACS Catal., 2014, 4, 535 CrossRef CAS.
- S. Jang, S. W. Kang, D. H. Chun, H.-T. Lee, J.-I. Yang, H. Jung, H.-D. Jeong, K. M. Nam and J. C. Park, New J. Chem., 2017, 41, 2756 RSC.
- V. V. Ordomsky, B. Legras, K. Cheng, S. Paul and A. Y. Khodakov, Catal. Sci. Technol., 2015, 5, 1433 RSC.
- S. W. Kang, K. H. Kim, D. H. Chun, J.-I. Yang, H.-T. Lee, H. Jung, J. T. Lim, S. H. Jang, C. S. Kim, C. W. Lee, S. H. Joo, J. W. Han and J. C. Park, J. Catal., 2017, 349, 66–74 CrossRef CAS.
- Z. Tian, C. Wang, J. Yue, X. Zhang and L. Ma, Catal. Sci. Technol., 2019, 9, 2728 RSC.
- F. Jiang, M. Zhang, B. Liu, Y. Xu and X. Liu, Catal. Sci. Technol., 2017, 7, 1245 RSC.
- P. A. Chernavskii, V. O. Kazak, G. V. Pankina, Y. D. Perfiliev, T. Li, M. Virginie and A. Y. Khodakov, Catal. Sci. Technol., 2017, 7, 2325 RSC.
- Y. Cheng, J. Lin, K. Xu, H. Wang, X. Yao, Y. Pei, S. Yan, M. Qiao and B. Zong, ACS Catal., 2016, 6, 389 CrossRef CAS.
- W. N. Hoc, Y. Zhang, R. J. O’brien, M. Luo and B. H. Davis, Appl. Catal., A, 2002, 236, 77 CrossRef.
- L. Guo, J. Sun, X. Ji, J. Wei, Z. Wen, R. Yao, H. Xu and Q. Ge, Nat. Commun., 2018, 1, 11 Search PubMed.
- L. Guo, Y. Cui, H. Li, Y. Fang, R. Prasert, J. Wu, G. Yang, Y. Yoneyama and N. Tsubaki, Catal. Commun., 2019, 130, 105759 CrossRef.
- J. Xie, J. Yang, A. I. Dugulan, A. Holmen, D. Chen, K. P. de Jong and M. J. Louwerse, ACS Catal., 2016, 6, 3147 CrossRef CAS.
- C.-F. Huo, B.-S. Wu, P. Gao, Y. Yang, Y.-W. Li and H. Jiao, Angew. Chem., Int. Ed., 2011, 50, 7403 CrossRef CAS.
- J. C. Park, S. Jang, G. B. Rhim, J. H. Lee, H. Choi, H.-D. Jeong, M. H. Youn, D.-W. Lee, K. Y. Koo, S. W. Kang, J.-I. Yang, H.-T. Lee, H. Jung, C. S. Kim and D. H. Chun, Appl. Catal., A, 2018, 564, 190 CrossRef CAS.
- J. C. Park, S. C. Yeo, D. H. Chun, J. T. Lim, J.-I. Yang, H.-T. Lee, S. Hong, H. M. Lee, C. S. Kim and H. Jung, J. Mater. Chem. A, 2014, 2, 14371 RSC.
- V. P. Sanots, T. A. Wenzendonk, J. J. D. Jaén, A. I. Dugulan, M. A. Nasalevich, H.-U. Islam, A. Chojecki, S. Sartipi, X. Sun, A. A. Hakeem, A. C. J. Koeken, M. Ruitenbeek, T. Davidian, G. R. Meima, G. Sankar, F. Kapteijn, M. Makkee and J. Gascon, Nat. Commun., 2015, 6, 6451 CrossRef.
- L. O. Arteta, M. J. V. Romero, T. Wezendonk, F. Kaptein and J. Gascon, Catal. Sci. Technol., 2018, 8, 210 RSC.
- S. Y. Hong, D. H. Chun, J.-I. Yang, H. Jung, H.-T. Lee, S. Hong, S. H. Jang, J. T. Lim, C. S. Kim and J. C. Park, Nanoscale, 2015, 7, 16616 RSC.
- H.-K. Lee, J. H. Lee, J. H. Seo, D. H. Chun, S. W. Kang, D. W. Lee, J.-I. Yang, G. B. Rhim, M. H. Youn, H.-D. Jung, H. Jung and J. C. Park, J. Catal., 2019, 378, 289 CrossRef CAS.
- J. H. Lee, H.-K. Lee, D. H. Chun, H. Choi, G. B. Rhim, M. H. Youn, H. Jeong, S. W. Kang, J.-I. Yang, H. Jung, C. S. Kim and J. C. Park, Nano Res., 2019, 12, 2568 CrossRef CAS.
- G. Kresse and J. Hafner, Phys. Rev. B: Condens. Matter Mater. Phys., 1993, 47, 558 CrossRef CAS.
- G. Kresse and J. Hafner, Phys. Rev. B: Condens. Matter Mater. Phys., 1994, 49, 14251 CrossRef CAS.
- G. Kresse and J. Furthmüller, Phys. Rev. B: Condens. Matter Mater. Phys., 1996, 54, 11169 CrossRef CAS.
- G. Kresse and J. Furthmüller, Comput. Mater. Sci., 1996, 6, 15 CrossRef CAS.
- M. Dion, H. Rydberg, E. Schröder, D. C. Langreth and B. I. Lundqvist, Phys. Rev. Lett., 2004, 92, 246401 CrossRef CAS.
- G. Román-Pérez and J. M. Soler, Phys. Rev. Lett., 2009, 103, 096102 CrossRef.
- K. Lee, E. D. Murray, L. Kong, B. I. Lundqvist and D. C. Langreth, Phys. Rev. B: Condens. Matter Mater. Phys., 2010, 82, 081101 CrossRef.
- J. Klimeš, D. R. Bowler and A. Michaelides, Phys. Rev. B: Condens. Matter Mater. Phys., 2011, 83, 195131 CrossRef.
- P. E. Blöchl, Phys. Rev. B: Condens. Matter Mater. Phys., 1994, 50, 17953 CrossRef.
- G. Kresse and D. Joubert, Phys. Rev. B: Condens. Matter Mater. Phys., 1999, 59, 1758 CrossRef CAS.
- J. Gaube and H.-F. Klein, Appl. Catal., A, 2008, 350, 126 CrossRef CAS.
- J. P. Chen and R. T. Yang, Langmuir, 1995, 11, 3450 CrossRef CAS.
- H. Y. Huang, J. Padin and R. T. Yang, J. Phys. Chem. B, 1999, 103, 3206 CrossRef CAS.
- S. W. Kang, K. Char and Y. S. Kang, Chem. Mater., 2008, 20, 1308 CrossRef CAS.
- R. Faiz and K. Li, Chem. Eng. Sci., 2012, 73, 261 CrossRef CAS.
- Y. Eum, B. S. Kim, I. S. Chae, G. H. Moon, S. C. Park, J. Jang and Y. S. Kang, Macromol. Res., 2020, 28, 1026 CrossRef CAS.
Footnotes |
| † Electronic supplementary information (ESI) available. See DOI: 10.1039/d0ma00920b |
| ‡ These authors contributed equally to this work. |
| This journal is © The Royal Society of Chemistry 2021 |

