 Open Access Article
Applications of MXene (Ti3C2Tx) in photocatalysis: a review
Xing
Li
 a,
Yang
Bai
*a,
Xian
Shi
b,
Na
Su
a,
Gongzhe
Nie
a,
Rumeng
Zhang
c,
Hongbo
Nie
ad and
Liqun
Ye
a,
Yang
Bai
*a,
Xian
Shi
b,
Na
Su
a,
Gongzhe
Nie
a,
Rumeng
Zhang
c,
Hongbo
Nie
ad and
Liqun
Ye
 *ae
*ae
aState Key Laboratory of Oil and Gas Reservoir Geology and Exploitation, School of Oil & Natural Gas Engineering, Southwest Petroleum University, Chengdu, 610500, China. E-mail: baiyanghyq@foxmail.com
bInstitute of Fundamental and Frontier Sciences, University of Electronic Science and Technology of China, Chengdu, 610054, China
cKey Laboratory of Ecological Security for Water Source Region of Mid-line Project of South-to-North Water Diversion of Henan Province, College of Chemistry and Pharmaceutical Engineering, Nanyang Normal University, Nanyang, 473061, China
dCNOOC (China) Co., LTD. Tianjing Branch, Tianjing, 300452, China
eCollege of Materials and Chemical Engineering, Key Laboratory of Inorganic Nonmetallic Crystalline and Energy Conversion Materials, China Three Gorges University, Yichang, 443002, China. E-mail: lqye@ctgu.edu.cn
First published on 28th January 2021
Abstract
MXenes are two-dimensional nanomaterials, which can be constructed from different elements. The rich interlayer groups, surface groups, and the flexible layer spacing of MXenes make them ideal catalysts. Among these, Ti3C2Tx has gained particular attention as a photocatalyst for photocatalytic CO2 reduction reactions (CO2RR), hydrogen evolution reactions (HER), and photocatalytic degradation reactions. The structure of Ti3C2Tx, hydrophilic surface functional groups, and the Gibbs free energy for hydrogen adsorption lead to the excellent photocatalytic HER performance of this material. Numerous surface defects on Ti3C2Tx also provide plentiful CO2 adsorption sites for CO2RR. It is the structure of two-dimensional nanomaterials and their high-speed electron transport channels that enable their excellent catalytic oxidation activity. However, at present, there are still challenges that limit their further application, the most significant of which is the material stability. In order to overcome this, the synthetic routes to prepare these photocatalysts need to be adapted.
1 Introduction
Photocatalysis is an environment-friendly technology developed in the 20th century. When light is absorbed by some special semiconductors, namely “photocatalysts”, electrons (e−) originally in the valence band (VB) are excited to the conduction band (CB) and holes (h+) are formed in the initial position. Free electrons with strong reducibility can reduce the valence state of some elements in compounds (such as carbon in CO2 and nitrogen in N2) when regular methods are not useful or cost too much. Thus far, photocatalysis has shown its huge application prospects in clean energy, environmental remediation, and many other fields; currently, researchers are heading towards new photocatalyst development and reaction mechanisms. Photocatalytic hydrogen evolution reaction (HER), CO2 reduction reaction (CO2RR), and photocatalytic degradation reaction represent the three main aspects of photocatalysis.Photocatalytic nanomaterials have an extensive number of potential applications. When their particle size is below a certain value, the Fermi level of the electronic energy levels morphs from continuous to discrete levels and the energy gap grows wider. These semiconductors are, therefore, more susceptible to photon excitation, which improves their photocatalytic activity.1
Nanomaterials can be divided into four categories, according to the dimensions of their structural scale: (1) zero-dimensional materials, e.g., groups of nanostructure clusters; (2) one-dimensional nanomaterials, e.g., fibrous nanotubes, nanowires, nanoribbons, or other related structures; (3) two-dimensional nanomaterials, e.g., layered nanomaterials, quantum wells, superlattices, and other structures; (4) three-dimensional nanomaterials, e.g., composite structures consisting of one or more zero-dimensional, one-dimensional, or two-dimensional nanomaterials. The first three are collectively known as low Vannami materials. In low Vannami materials, two-dimensional nanomaterials show significant changes in the surface, electron energy levels, state density, and other aspects compared with three-dimensional materials. This due to the fact that their thickness is greatly reduced compared to other two-dimensional materials; thus, these possess unique optical and electronic characteristics, which make them a hot topic in catalysis.2,3
MXenes are two-dimensional nanomaterials and have a general material formula of Mn+1XnTx. In this formula, M represents nitrogen or carbon, X is generally a transition metal element, and T represents the functional groups. MXenes typically consist of transition metal carbides, nitrides, or carbides that are several atomic layers thick. It was first reported in 20114 that MXene materials have comparable conductivity towards transition metal carbides due to the presence of hydroxy groups or terminal oxygen species on their surfaces. The most important feature of this range of materials is that, unlike conventional battery materials, they provide more channels for ions to move through, thus dramatically increasing their speed.
Ti3C2Tx was the first discovered MXene material and is also the most widely used MXene material in the field of photocatalysis.5–7 It was first obtained by etching the Al layer of Ti3AlC2 with hydrofluoric acid. In this paper, the application of Ti3C2Tx as a photocatalyst and approaches to improve its catalytic performance are summarized.
2 MXene
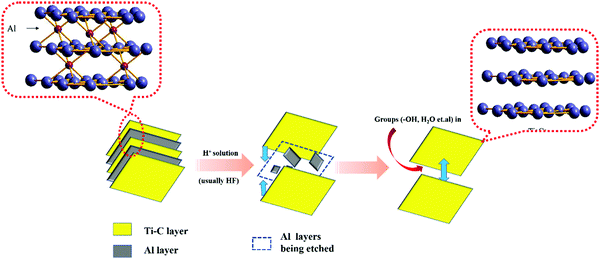
The preparation of MXenes can be divided into two approaches, namely, bottom-up and top-down. Presently, the top-down etching method is commonly employed. This is due to the MAX phase9,10 (commonly, M means early transition metal elements such as Ti and Nb; A represents the Al or Si layer; X represents C or N elements) as M is mainly composed of metallic bonds between the atoms, which are connected to A. The chemical properties are largely dictated by A. By using certain concentrations of hydrofluoric acid or LiF/HCl11 to etch the MAX phase of Ti3AlC2, ternary carbides within the titanium carbon layers become closer to each other. In this process, the Al layer is etched away gradually, resulting in a greater carbon–titanium interlayer spacing in the Ti3C2Tx product. In order to obtain Ti3AlC2 with a graphene-like structure consisting of only a few or single layers, mechanical or chemical intercalation dissection is required. However, when chemical intercalation is used for stripping, some organic molecules may occupy the active sites exposed on the surface, which is unfavorable for photocatalytic reactions.
Etching is a slow process, as shown in Fig. 1(a). In this process, Al layers are gradually peeled off, while the Ti–C skeleton layers are not damaged because of their strong ionic bonding.12 Free groups such as –OH and some H2O molecules enter into the framework of Ti–C and become inter-connected by hydrogen bonds, which expands the layer spacing of Ti3C2Tx. This permits ions with a large radius to enter the layer spacing,13 providing an operating space for the ion intercalation method to peel-off few layers of Ti3C2Tx. The number of –OH groups and H2O molecules within the interlayer space accounts for the large electrical capacity of Ti3C2Tx.
Ti3C2Tx obtained by direct etching with hydrofluoric acid possesses a different morphology to Ti3C2Tx obtained by etching with LiF/HCl. Furthermore, NMR spectroscopy revealed a greater number of –OH and –F functional groups on the surface of Ti3C2Tx etched by hydrofluoric acid, while LiF/HCl etching furnished a material with predominantly –O functional groups.
2.2 Structure and properties of Ti3C2Tx
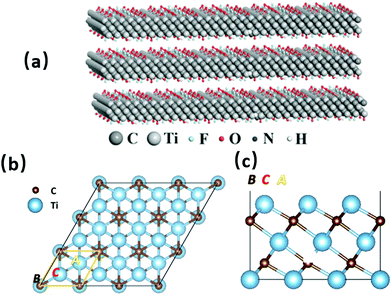
Various surface groups (such as –O, –F, and –OH) have supplied abundant anchored sites for the base photocatalyst to form efficient heterojunction structures, which are ideal for photocatalytic activities.26 There is also a large number of exposed metal sites on the surface, which can be used as active sites for reactions.
The surface chemical state of MXene materials has a large influence on the regulation of its physical properties. When –F on the surface is replaced by an –O group, the electrochemical performance is improved. For example, when Ti3C2Tx is treated with a KOH and CH3OOK solution, the –O groups on the surface increase, along with the electric capacity. Under an atmosphere of N2, Ar, or other inert gases, the number of –F groups on the surface of Ti3C2Tx is reduced, after which the electrical capacity is greatly increased.
Ti3C2Tx shows an excellent absorption of light between 300 nm and 500 nm.27 Recently, researchers have even found that the absorption can be broadened to the near-infrared (NIR) region. According to a further study, this may be related to its surface plasmon resonance (SPR), and the thinner the material, the stronger the SPR.28 Such a peculiarity makes Ti3C2Tx an ideal photothermal co-catalyst.
The crystal structure of Ti3C2Tx contains Ti defects, which appear to contribute significantly to the instability of this material.14,33 High angle annular dark field (HAADF)-STEM imaging is an important tool in 2D materials’ characterization and is used to unambiguously resolve the crystal structure and defect configurations.34,35 As shown in Fig. 4, widespread Ti defects were directly detected through the HAADF-STEM imaging of the single-layer Ti3C2Tx flakes. Single-layered Ti3C2Tx obtained by HF etching was observed through HAADF-STEM images in Fig. 4(a)–(c). Fig. 4(d) was obtained by calculating tens of such images, and it reveals that the relationship between HF concentration and defect formation. It was found that vacancy clusters are rarely observed after etching with 2.7 wt% HF concentration but are relatively common after etching with 7 wt% HF.33 Generally speaking, the average concentration of VTi (Ti vacancies) is positively related to that of HF.
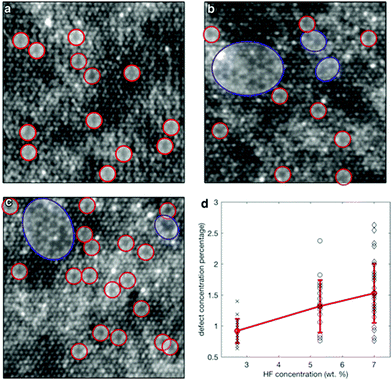 | ||
| Fig. 4 HAADF-STEM images from single-layer Ti3C2Tx MXene flakes prepared using etchants with different HF concentrations: (a) 2.7 wt% HF, (b) 5.3 wt% HF, and (c) 7 wt% HF. Single VTi vacancies are indicated by the red circles, while vacancy clusters VCTi are shown by the blue circles. (d) Scatter plot of the defect concentration from the images acquired from samples produced using different HF concentrations. The red line shows the error plot with the average and standard deviation for different HF concentrations.33 | ||
3. Application in photocatalysis
Due to the excellent structural properties of Ti3C2Tx, there are many cases in which Ti3C2Tx is used as a co-catalyst in photocatalytic systems or is directly involved in photocatalytic reaction systems. This paper summarizes the application of Ti3C2Tx in the field of photocatalysis from three aspects: photocatalytic hydrogen evolution reactions (HER), photocatalytic CO2 reduction reactions (CO2RR), and photocatalytic degradation reactions.3.1 Application in HER
Ti3C2Tx is the most widely used photocatalytic agent in hydrogen evolution reactions36–39 (HER). Ti3C2Tx has the following advantages that make it ideal for use in photolysis: (a) hydrophilic surface functional groups are conducive for the adsorption of water molecules and promote the reaction; and (b) the Gibbs free energy of Ti3C2Tx adsorption on hydrogen approaches zero infinitely, which is conducive for the reduction of H+.There are three important steps in the HER process, which are:30,40,41 (a) initial h+ + e− formation; (b) generation of H* (the intermediate adsorption state); and (c) formation of the 1/2 H2 product. The adsorption state of H* in process (b) directly affects the final hydrogen evolution efficiency and is an extremely important factor, which can be represented by the Gibbs adsorption free energy |ΔGH*|. Through simulation calculations, it was found that when all the Ti3C2Tx surface groups are –F, ΔGH* = −0.927 eV, and the adsorption is too strong. When all the surface groups are –O, |ΔGH*| is 0.003 eV, which is even better than the commonly used catalyst Pt (ΔGH* ≈ − 0.090 eV).42,43 Therefore, Ti3C2Tx is a good HER co-catalyst. Examples of Ti3C2Tx used for photolysis in recent years are summarized below (Table 1).
| Name | H2 production (μmol h−1 gcatalyst−1) | AQY (%) | Activity improvement factor | Sacrificial reagent | Preparation methods | Monolayer or multilayer | Light source | Morphology | Year | Ref. |
|---|---|---|---|---|---|---|---|---|---|---|
| CdS/Ti3C2Tx | 14![[thin space (1/6-em)]](https://www.rsc.org/images/entities/char_2009.gif) 342 342 |
40.1% (420 nm) | 135.59 times | Lactic acid (17.6%) | One-step hydrothermal method | Ti3C2Tx NPs | 300 W Xe lamp (λ > 420 nm) | Cauliflower-structure by self-assembly of many NPs | 2017 | 30 |
| 2D-Layered Carbon/TiO2 | 480.8 | 1.98% (400 nm) | TEOA (10%) | Ti3C2Tx oxidation | Multilayer | 300 W Xe lamp (λ > 400 nm) | Nanosheets | 2017 | 44 | |
| Ti3C2Tx/rutile TiO2 | 17.8 | 0.3% | Approximately 4 times | Methanol (25%) | Hydrothermal method | Monolayer | 200 W Hg lamp (λ > 400 nm) | 2D sheetswith TiO2 attached on the surfaces and between the sheets | 2016 | 45 |
| Ti3C2/Pt/g-C3N4 | 5000 | 3.1% (420 nm) | 15 times than pristine g-C3N4 | TEOA (10%) | Hydrothermal and photodeposition method | Monolayer | 300 W Xe lamp | Nanosheets with porous nanoparticles | 2018 | 46 |
| Sulfur-doped Carbon/TiO2 | 333 | 7.36% | Methanol (10%) | Ti3C2Tx oxidation | Multilayer | 300 W Xe lamp (λ > 400 nm) | Nanosheets | 2018 | 47 | |
| Ti3C2Tx/TiO2 nanoflowers | 783.11 | 5.86 (350 nm) | 6 times | Methanol (20%) | Hydrothermal and calcination | Multilayer | 300 W Xe lamp | Nanoflowers | 2018 | 48 |
| Zn2In2S5/Ti3C2Tx | 2596.76 | 8.96% (420 nm) | 1.97 times | 0.25 M Na2SO3/0.35 M Na2S/H2PtCl6 | Hydrothermal | Multilayer | 300 W Xe lamp (λ > 420 nm) | Flower-like microspheres | 2018 | 49 |
| d-Ti3C2/TiO2/g-C3N4 | 1620 | 4.16% (420 nm) | 12.15 times than pure g-C3N4 | TEOA (10%) | Calcination | Monolayer | 300 W Xe lamp (λ > 420 nm) | 2D–2D heterostructure | 2018 | 50 |
| ZnS/Ti3C2 | 502.6 | 4 times | Lactic acid (20%) | Hydrothermal | Multilayer | 300 W Xe lamp | Sphere-like structure | 2019 | 51 | |
| 1D CdS nanorod/2D Ti3C2 MXene nanosheet | 2407 | 35.6% (429 nm) | 6.68 times | Lactic acid (10%) | Electrostatic self-assembly | Monolayer | 300 W Xe lamp (λ > 420 nm) | 1D/2D nanosheets | 2019 | 52 |
| TiO2 nanofibers/MXene Ti3C2 | 6979 | 3.8 times than TiO2 nanofibers | Methanol (10%) | Electrostatic self-assembly technique | Monolayer | 300 W Xe lamp | Nanofibers/nanosheets | 2019 | 53 | |
| TiO2 nanoparticale/monolayer Ti3C2 | 2650 | 15.8% (305 nm) | 2.88 times than TiO2 nanoparticles/multilayer Ti3C2 | Methanol (25%) | Electrostatic self-assembly technique | Monolayer | 200 W Hg lamp (285–325 nm) | Nanosheets | 2019 | 54 |
| MoS2/Ti3C2 | 6144.7 | 2.33 times | Methanol (30%) | Hydrothermal | Multilayer | 300 W Xe lamp (λ > 400 nm) | Spheres-like structure | 2019 | 55 | |
| Ti3C2 MXene/O-doped g-C3N4 | 25124 | 17.59% (405 nm) | 1.8 times than O-doped g-C3N4 | TEOA | Electrostatic self-assembly technique | Multilayer | 300 W Xe lamp | 2D nanosheets structure | 2019 | 56 |
| CdLa2S4/Ti3C2 | 11182.4 | 15.60% (420 nm) | 13.4 times | 0.25 M Na2SO3 and 0.35 M Na2S | Hydrothermal | Monolayer | 300 W Xe lamp (λ > 420 nm) | Particle-like | 2019 | 57 |
| Ti3C2 MXene quantum dots/g-C3N4 | 5111.8 | 3.654% | 25.97 times | TEOA (15%) | Deposition | Ti3C2 MXene quantum dots | 300 W Xe lamp | Nanosheets | 2019 | 58 |
| MoxS@TiO2@Ti3C2 | 10505.8 | 7.535% | 5.99 times than Mo2S@TiO2@Ti3C2 | TEOA | In situ growth and hydrothermal | Multilayer | 300 W Xe lamp | Nanosheets | 2019 | 59 |
| Ti3C2/porous MOFs (UiO-66-NH2) | 204 | Approximately 8 times | 0.1 M Na2S and 0.1 M Na2SO3 | Hydrothermal | Monolayer | 350 W Xe lamp | 3D structure | 2019 | 60 | |
| C-TiO2/g-C3N4 | 1409 | 8 times than C-TiO2 | TEOA (10%) | Calcination | Multilayer | 300 W Xe lamp (λ > 420 nm) | Smooth sheet-like structure | 2019 | 32 | |
| CdS@Ti3C2@CoO | 134.46 | 1.75 times than CdS@CoO | Calcination | Monolayer | 300 W Xe lamp (λ > 420 nm) | Spheres-like structure | 2019 | 61 | ||
| TiO2–Ti3C2–CoSx | 950 | 5.8 times than TiO2 | Methanol (20%) | Hydrothermal | Multilayer | 300 W Xe lamp | Smooth round block morphology | 2019 | 62 | |
| Ti3C2(TiO2)@CdS/MoS2 | 8470 | 3.76 times than CdS/MoS2 | lactic acid (20%) | Hydrothermal | Multilayer | 300 W Xe lamp (λ > 420 nm) | Nanospheres | 2019 | 63 | |
| Ti3C2 MXene/MoS2 nanosheets/TiO2 nanosheets | 6425.297 | 4.61% | 7.15 times than TiO2/Ti3C2 | TEOA | Ti3C2Tx oxidation | Multilayer | 300 W Xe lamp | Ti3C2 nanosheets with MoS2 nanoparticales | 2019 | 64 |
| 2D/3D g-C3N4/Ti3C2 (MXene) heterojunction | 116.2 | 6.64 times | TEOA (10%) | Calcination | Multilayer | 300 W Xe lamp (λ > 420 nm) | Nanosheets | 2020 | 65 | |
| Au/MoS2/Ti3C2 | 12000 | Methanol (30%) | Electrostatic self-assembly technique | Multilayer | Nanosphere-like | 2020 | 66 | |||
| 2D/2D Ti3C2/g-C3N4 | 72.3 | 0.81% (400 nm) | 10.18 times than pure g-C3N4 | TEOA (10%) | Electrostatic selfassembly approach | Monolayer | 200 W Hg lamp | Flat irregularly shaped nanosheets of 2D/2D structures | 2019 | 67 |
| MXene@Au@CdS | 17070.43 | 1.85 times than pure CdS | 0.35 mol L−1 Na2S and 0.25 mol L−1 Na2SO3 solution | Hydrothermal | Monolayer | 300 W Xe lamp (λ > 420 nm) | Nanosheets | 2020 | 68 | |
| Black phosphorus quantum dots/Ti3C2@TiO2 | 684.5 | 11.35 times | TEOA (25%) | Solvent-heatmethod | Multilayer | 300 W Xe lamp (λ > 420 nm) | Nanosheets | 2020 | 69 |
Ti3C2Tx plays a significant role in HER, whether as a co-catalyst or as a part of the overall catalyst, as it greatly improves the performance of the base catalyst. As shown in Table 1, the presence of Ti3C2Tx increases the yield of H2 compared to solely the base catalyst by more than 2 times. The quantum efficiency is also significantly improved to 40.1%, whilst the maximum value of hydrogen production is 14.34 mmol g−1 h−1.
Monolayer Ti3C2Tx or quantum dot Ti3C2Tx displays better activity in HER. However, the use of monolayer Ti3C2Tx as a photocatalyst has several disadvantages: (a) the preparation of monolayer Ti3C2Tx is complex; (b) the structural stability is low and the catalyst is easily oxidized in water; (c) manipulation of the mono-layer or few-layer structures is not easy to carry out. Few-layer structures are presently prepared by electrostatic self-assembly or by in situ growth. The stability of the composite catalyst obtained by in situ growth is significantly greater than that obtained by electrostatic self-assembly.
Due to the surface hydrophilic groups,70 suitable Gibbs adsorption free energies |ΔGH*|, and excellent electron transfer efficiency, Ti3C2Tx not only plays an important role in the three-step process of HER but can participate in electron hole separation.
Xiao et al. successfully synthesized the Schottky junction of 1D CdS nanorod/2D Ti3C2 MXene nanosheet in 2019.52 As shown in Fig. 5, Xiao et al. anchored Cd2+ using the deficiency of Ti on the Ti3C2 surface and the electrostatic interaction of free Cd2+ to prepare the 1D CdS nanorods. The composite material demonstrated excellent hydrogen production performance (2407 μmol h−1 gcatalyst−1), producing 6.68 times as much H2 as pure CdS (Fig. 6).
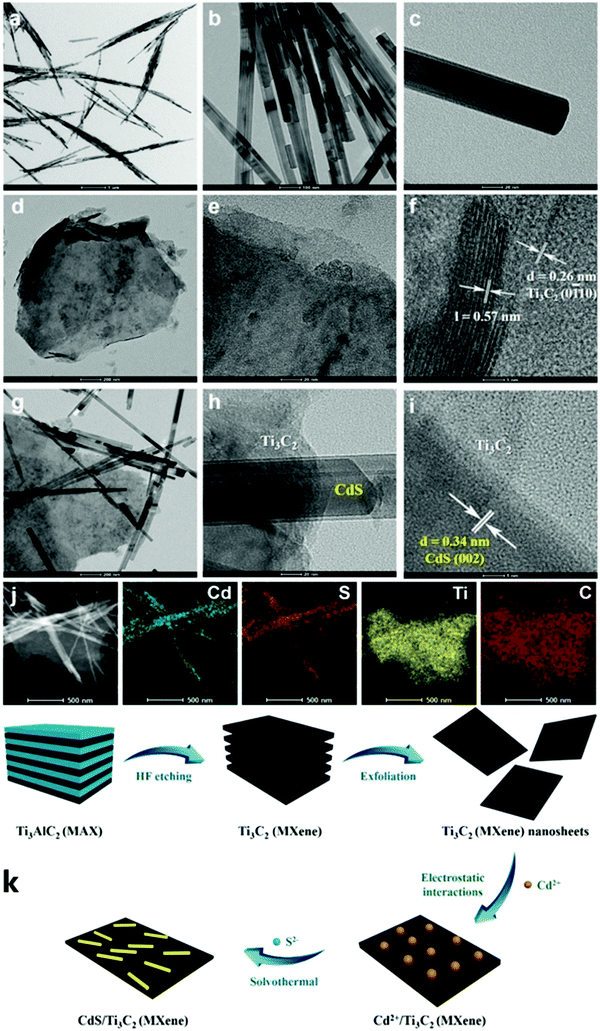 | ||
| Fig. 5 TEM images of (a–c) CdS, (d–f) exfoliated Ti3C2 MXene nanosheets, (g–i) the composite CM-20, (j) the corresponding elemental mapping results of CM-20, and (k) the oxidation process of Ti3C2Tx.52 | ||
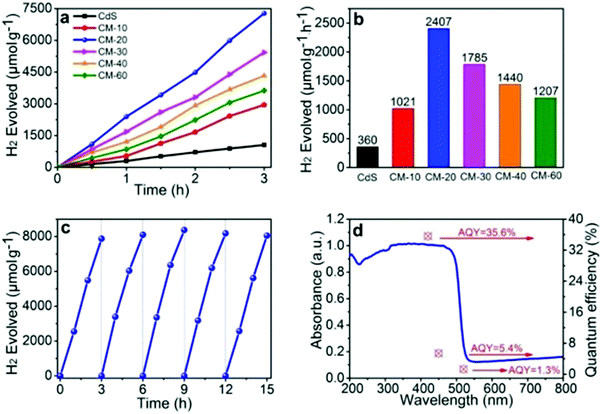 | ||
| Fig. 6 (a and b) Photocatalytic H2 evolution performance of different samples, (c) the recycled photocatalytic H2 evolution experiments of CM-20, (d) AQY values and the wavelength dependence of photocatalytic H2 evolution in the composite CM-20.52 | ||
Theoretically, the surface negative value (zeta potential value: ∼18 mV) of Ti3C2Tx is sufficient to adsorb positively charged Cd2+. Ti3C2Tx treated with DMSO forms a low-layered structure, on which Cd2+ can be anchored and one-dimensional CdS nanorods can be grown. As shown in Fig. 5, due to the constraint effect of Ti3C2Tx, the length of 1D CdS nanorods in the 1D CdS nanorods/2D Ti3C2Tx heterojunctions is smaller than that of the 1D CdS nanorods alone.
CdS equipped with Ti3C2Tx displays excellent electrochemical properties. As shown in Fig. 7, the photocurrent of 1D CdS nanorods/2D Ti3C2Tx was significantly better than that of one-dimensional CdS nanorods and the optical resistance was significantly lower than that of one-dimensional CdS nanorods. ESR tests show that the hydroxyl radical and superoxide radical signals of 1D CdS nanorods/2D Ti3C2Tx were significantly enhanced after the addition of Ti3C2Tx. In conclusion, under the same illumination conditions, 1D CdS nanorods/2D Ti3C2Tx generate more photogenic carriers. These produce oxygen-containing groups with oxidizing reductivity, which can participate in photocatalytic hydrogenation reactions.
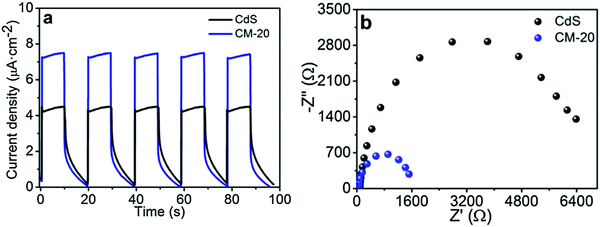 | ||
| Fig. 7 (a) Photocurrent density curves and (b) EIS Nyquist plots of CdS and CM-20.52 | ||
1D CdS nanorods/2D Ti3C2Tx typically exhibit better visible light response, electron hole separation efficiency, and more effective carrier transport efficiency after the formation of multi-dimensional heterojunctions. This accounts for their excellent photocatalytic hydrogen evolution capability.
Using Ti3C2Tx as the co-catalyst, Wang et al. synthesized a TiO2/Ti3C2Tx complex photocatalyst,45 which was 4 times more efficient than pure phase TiO2 in photohydrolyzing aquatic hydrogen. This is attributed to the Schottky barrier formed between TiO2 and Ti3C2Tx, which effectively improves the separation efficiency of the electron holes. As shown in Scheme 1, excited electrons can be wired to Ti3C2Tx from the conduction band of TiO2 owing to the close contact between Ti3C2Tx and TiO2; thus, negative charge is accumulated in Ti3C2Tx and a depletion layer formed at the metal–semiconductor interface, which is the Schottky barrier.45
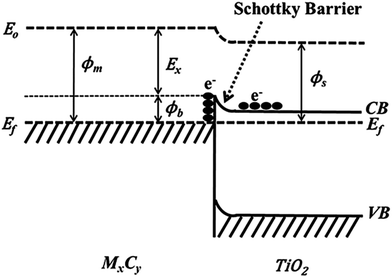 | ||
| Scheme 1 Formation of Schottky barrier at the MXene/TiO2 interface.45 | ||
In this work, Wang et al. treated Ti3C2Tx with DMSO to form low-layer structures. Amorphous TiO2 was formed from TiCl4 hydrolysis and then on the surface of Ti3C2Tx, amorphous TiO2 was coated. After hydrothermal treatment, anatase TiO2/Ti3C2Tx material was formed, as shown in Fig. 8. Amorphous TiO2 is micro-spherical and is coated on the surface of Ti3C2Tx, displaying a low-layered structure (Fig. 8). After water heat treatment, the whole structure forms into a brittle cake structure (Fig. 9).
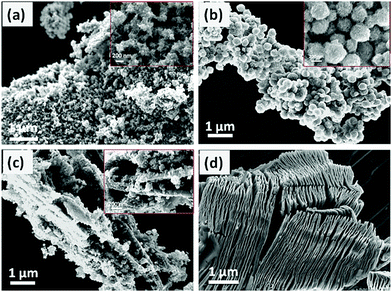 | ||
| Fig. 8 SEM images of (a) TiO2 (50 wt%), (d) Ti3C2Tx, (b) TiO2/Ti3C2Tx (5 wt%), and (c) TiO2/Ti3C2Tx.45 | ||
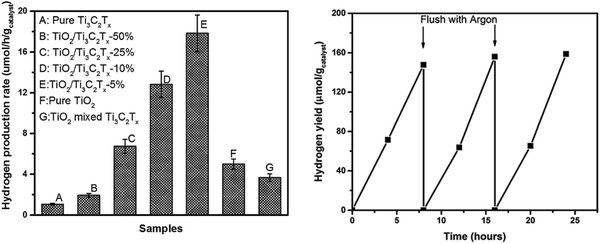 | ||
| Fig. 9 (a) Photocatalytic hydrogen production rates and (b) recycling studies over the TiO2/Ti3C2Tx (5 wt%) sample.45 | ||
The TiO2/Ti3C2Tx material displays excellent photocatalytic hydrogen evolution capability with good cycling stability. The hydrogen production efficiency of TiO2/Ti3C2Tx-5% is about 4 times as high as that of pure phase TiO2, reaching 17.8 μmol h−1 gcatalyst−1. The hydrogen production efficiency of the 10% and 50% samples decreased slightly, which may be related to light energy absorption, as shown in Fig. 10(a). With the increase in Ti3C2Tx addition, the light absorption capacity of the samples in the 250–380 nm region is gradually decreased. This significant improvement in the hydrogen production efficiency is closely related to the smooth carriage of Ti3C2Tx. As shown in Fig. 10(b), after the formation of the Schottky barrier, the carrier separation efficiency is improved, thus improving its photocatalytic capacity.
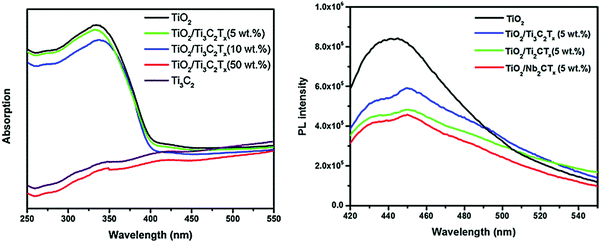 | ||
| Fig. 10 (a) PL spectra and (b) DRS spectra of TiO2, TiO2/Ti3C2Tx (5 wt%), TiO2/Ti3C2Tx (10 wt%), and TiO2/Ti3C2Tx (50 wt%).45 | ||
Thus, in conclusion, after loading with Ti3C2Tx, H2 production increased at least twice. Such an amazing promotion is mainly related with 3 aspects of Ti3C2Tx: (a) it supplies a high throughput channel as a co-catalyst for the excited electrons while the holes cannot pass the boundaries; (b) its hydrophilcity; and (c) the Gibbs free energy of Ti3C2Tx adsorption on hydrogen approaches zero infinitely.
3.2 Application in CO2RR
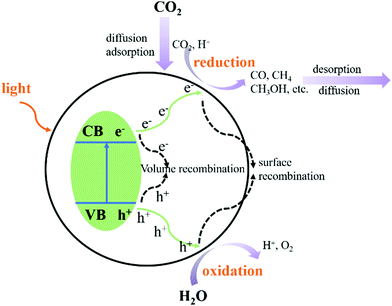
The photocatalytic CO2 reduction reaction (CO2RR) consists of five steps:71–74 light absorption, charge separation, CO2 adsorption, surface redox reaction, and product desorption. As shown in Fig. 11, when the CB of the photocatalyst is greater than the redox potential of CO2, and charge separation occurs whilst the electrons and holes recombine. Several complex factors dictate which of these two competing processes predominantly occurs. After the adsorption of CO2 and the migration of photogenerated electrons and holes from the inside of the crystal structure to the surface, the redox reaction is carried out on the surface of the catalyst. The product then de-attaches, which completes the entire photocatalytic CO2 reduction reaction.Ti3C2Tx is also widely used in the photocatalytic CO2 reduction reaction. However, due to its own carbon source and instability, further research is needed to understand the mechanism of photocatalytic CO2 reduction of Ti3C2Tx.
In 2017, Zhang et al. summarized the CO2 reduction capacity of three MXene materials with surface groups, which terminate with –O through theoretical calculations.75 Among the three materials, Ti2CO2, V2CO2, and Ti3C2O2, Ti2CO2 showed the best photocatalytic CO2 reduction capacity. Of the two reduction paths76–78 shown in Fig. 12, the pathway of “CO2–HCOO–HCOOH” has a favorable energy barrier of about 0.53 eV.
Through DFT calculations, it was revealed that in the first step reaction of CO2 adsorption in CO2RR, the O atom of the CO2 molecule occupies an O defect position on the MXene. This mode in adsorption requires the lowest energy. The adsorption energies of the three materials were Ti3C2O2 (−0.73 eV), Ti2CO2 (−0.67 eV), and V2CO2 (−0.35 eV). Ti2CO2 has a lower adsorption energy compared to V2CO2 as the Ti atoms are more likely to lose electrons than the V atoms.
If the reaction proceeds via pathway 1 (Fig. 11), one of the oxygen atoms of the CO2 molecule is captured by the oxygen defect. This results in the breaking of the C–O bond, while CO is produced. In this step, Ti3C2O2 would lower the energy barrier of the C–O bond to about 0.86 eV. Pathway 2 (Fig. 11) has an energy barrier greater than 1 eV. In this pathway, the CO2 molecules are captured by an oxygen defect on the surface of MXene and are hydrogenated to form COOH. This is further hydrogenated and converted into the products CO and H2O. CO, which is produced, can further react to form HCOOH, HCOH, CH2OH, CH4, and other products.
Studies into the application of Ti3C2Tx in CO2RR is summarized in Table 2.
| Photocatalyst | Products and yield (μmol g−1 h−1) | Activity improvement factor | Reaction conditions | Light source | Preparation method | Morphology | Monolayer or Multilayer | Year | Ref. |
|---|---|---|---|---|---|---|---|---|---|
| 2D/2D Ti3C2 MXene/g-C3N4 nanosheet | CO (5.19) | 8.37 (CO) | 20 mg | 300 W Xe lamp (λ > 420 nm) | Calcination under N2 atmosphere | 2D/2D nanosheets | Monolayer | 2020 | 79 |
| CH4 (0.044) | 2.09 (CH4) | catalyst gas–solid | |||||||
| Alklinized Ti3C2/decorating g-C3N4 | CO (11.21 μmol g−1) | 5.96 (CO) | 40 mg catalyst gas–solid | 300 W Xe lamp (λ > 420 nm) | Alkali etching | 3D | Multilayer | 2019 | 80 |
| CH4 (0.044 μmol g−1) | 5.6 (CH4) | ||||||||
| TiO2/Ti3C2 | CO | — | 50 mg | 300 W Xe lamp | Calcination | Nanoparticles | Multilayer | 2018 | 81 |
| CH4 (0.22) | catalyst liquid–solid | ||||||||
| 2D/2D ultrathin Ti3C2/Bi2WO6 | CO | 4.34 (CH4) | 100 mg | Xe lamp | Hydrothermal | Flat shape 2D structure | Monolayer | 2018 | 82 |
| CH4 (1.78) | 6.28 (CH3OH) | catalyst liquid–solid | |||||||
| CH3OH (0.44) | |||||||||
| 2D/2D/0D TiO2/C3N4/Ti3C2 | CO (4.39) | 1.39 (CO) (than TiO2/C3N4) | 30 mg catalyst liquid–solid | 300 W Xe lamp | Electrostatic self-assembly | 2D/2D structure | Ti3C2 quantum dots | 2020 | 83 |
| CH4 (1.20) |
In 2018, Cao et al. prepared a 2D/2D heterogeneous junction of Ti3C2Tx/Bi2WO6 and the composite showed excellent photocatalytic CO2 reduction performance.82 As shown in Fig. 13, multi-layer structure Ti3C2Tx was tested with DMSO. After the formation of low-layer structure Ti3C2Tx, the oxygen-rich surface was negatively charged, which permitted Bi3+ to be adsorbed from hydrolyzed Bi(NO3)355H2O.84 After the addition of a tungsten source, a 2D/2D Ti3C2Tx/Bi2WO6 heterojunction was formed. The concurrent addition of CTAB furthermore ensures the ultrathin structure of both Bi2WO685 and Ti3C2Tx.86
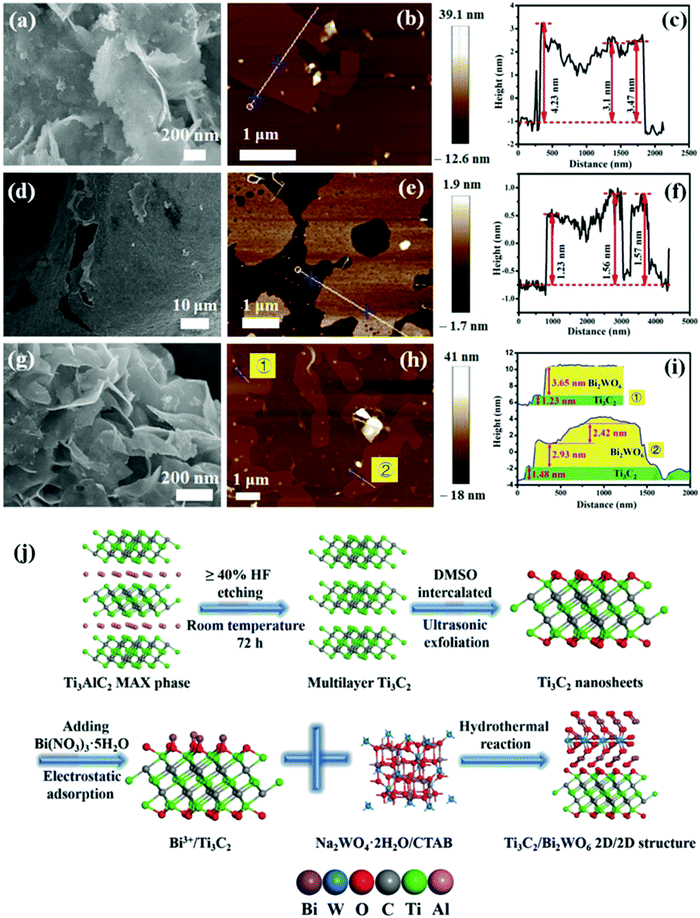 | ||
| Fig. 13 (a–c) Typical FESEM, AFM images, and height cutaway view of Bi2WO6, (d–f) Ti3C2 nanosheets, (g–i) TB2 (Ti3C2Tx/Bi2WO6), and (j) schematic illustration of the synthetic process.82 | ||
The successful preparation of heterojunctions greatly enhances the ability of Bi2WO6 to reduce CO2. The CH4 production of the sample TB2 reached 1.78 μmol h−1 g−1, while the yield of CH3OH reached 0.44 μmol h−1 g−1. The isotopic spectra of Fig. 14(b) and (c) indicates that the produced CH4 and CH3OH are formed from the photocatalytic reduction of CO2.
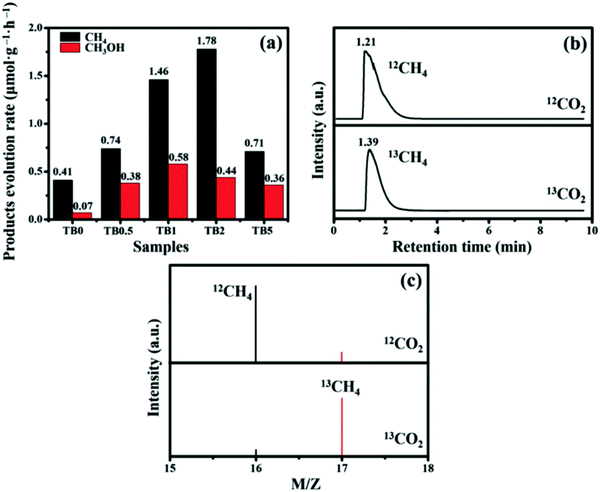 | ||
| Fig. 14 (a) Photocatalytic activity of TB0 to TB5; (b) GC-MS spectra over TB2 after irradiation for several hours with different carbon sources; (c) GC-MS analysis of the reaction products with 12C and 13C as carbon sources.82 | ||
As shown in Fig. 15(a), Ti3C2Tx exhibits excellent light absorption performance between 200–800 nm. The light absorption capacity of Bi2WO6 was also significantly improved by carrying Ti3C2Tx. To be noted, as shown in Fig. 14(b), the fluorescence lifetime decreased after loading with Ti3C2Tx. This is because TC supplies a more efficient non-radiative decay pathway. In electrochemical tests, the photocurrent photoelectric impedance spectrum further revealed that the carriage of Ti3C2Tx greatly promoted the carrier strength of Bi2WO6. This further confirmed the successful construction of the Ti3C2Tx/Bi2WO6 heterojunction.
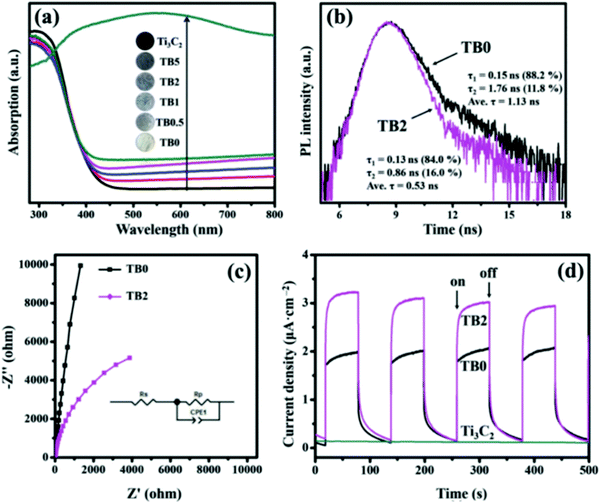 | ||
| Fig. 15 (a) UV-Vis DRS of all the as-prepared samples; (b) TRPL spectra of TB0 and TB2; (c) EIS plots and (d) transient photocurrent of the prepared samples.82 | ||
Yang et al. prepared 2D/2D Ti3C2 MXene/g-C3N4 heterojunctions in 2020.79 As shown in Fig. 16(g), Ti3AlC2 was successfully etched to form Ti3C2, as indicated by the XRD patterns.87,88 2D g-C3N4 was found to grow on the surface of Ti3C2 under an atmosphere of N2. The formed 2D/2D Ti3C2 MXene/g-C3N4 demonstrated excellent photocatalytic CO2 reduction capability. As shown in Fig. 17, the photocatalytic performance of pure phase g-C3N4 for the production of CO and CH4 is only 0.62 μmol h−1 g−1 and 0.021 μmol h−1 g−1, respectively, in contrast to Ti3C2, wherein the production of CO and CH4 is 5.19 μmol h−1 g−1, 0.044 μmol h−1 g−1, respectively. The isotopic experiments confirm that the product is produced by the photocatalytic reduction of CO2.
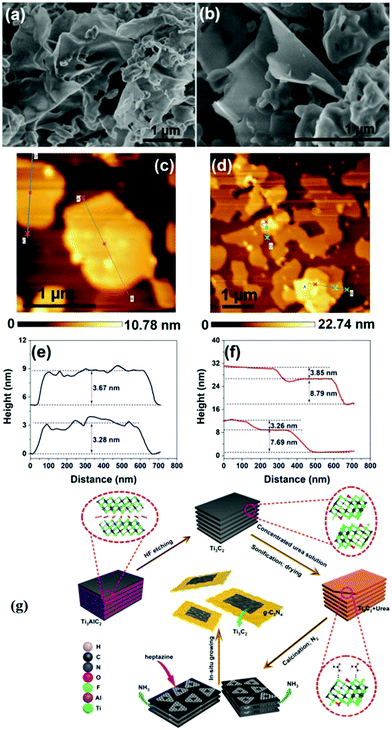 | ||
| Fig. 16 FESEM images of UCN (a) and 10TC (b) samples, AFM images and the corresponding height profiles of UCN (c and e), 10TC (d and f) samples, and (g) schematic illustration for the fabrication process.79 | ||
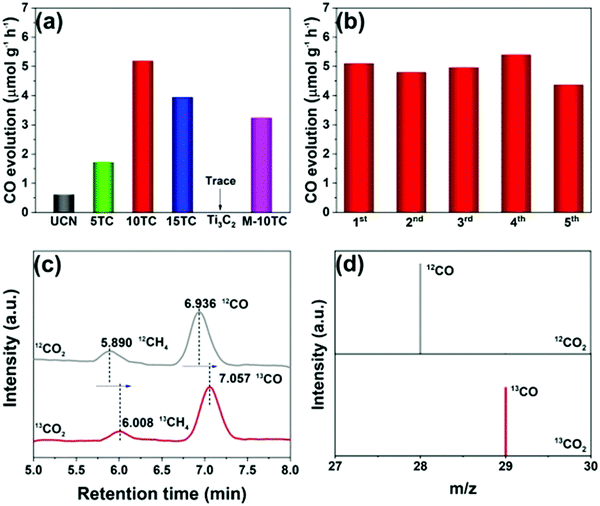 | ||
| Fig. 17 Photocatalytic CO2 reduction performance of the as-prepared samples (a); cycling tests over the 10TC sample (b); GC-MS analysis of the products from the photoreduction of CO2 over 10TC using labelled 12CO2 and 13CO2 as the carbon sources (c and d).79 | ||
The tests of PL and TRPL showed that the composite rate of electron holes45,89 decreased significantly after carrying Ti3C2. As shown in Fig. 18(b), the fitted pure phase C3N4 had a lifetime of only 4.14 ns, while 10TC had a lifetime of 4.51 ns, which represents a significant increase in the lifetime of the carriers. This is closely related to the smooth carrying of Ti3C2. An excellent “storage capacitor” is produced when Ti3C2 forms a heterojunction with g-C3N4. When the electrons are transmitted to the semiconductor surface, they transfer to Ti3C2 quickly while the holes cannot. This greatly reduces the electron hole composite and improves the photocatalytic performance of the material. On the other hand, abundant defects on the Ti3C2 surface provide excellent sites for CO2 adsorption.
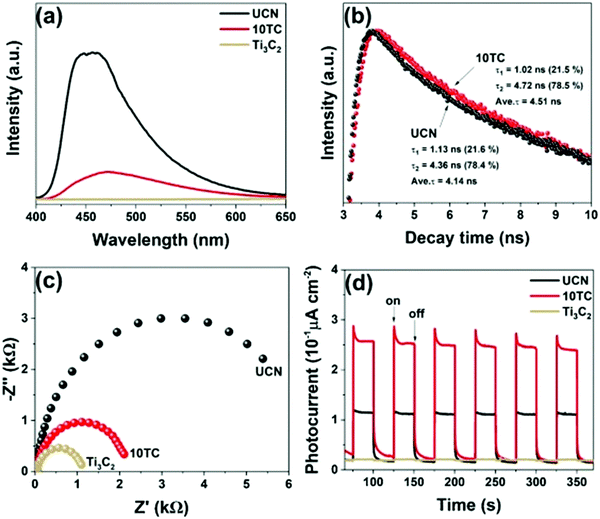 | ||
| Fig. 18 PL spectra, EIS, and TPR plots of UCN, Ti3C2, and 10TC samples (a, c, and d); TR-PL spectra of UCN and 10TC (b).79 | ||
In conclusion, the application of Ti3C2Tx in CO2RR is relatively less than that of photocatalytic water splitting. This is because of its instability and its own carbon resources, which can cause interferences during the photocatalytic CO2 reduction reaction. As shown in Table 2, among limited reports, Ti3C2Tx with both single-layered structures and multi-layered structures shows an obvious production promotion. It is to be noted that there are no new products (such as C2 products, formaldehyde, and methyl ether) after loading with Ti3C2Tx compared to the base photocatalyst. This phenomenon confirms that Ti3C2Tx cannot change the energy barrier of the base photocatalyst for CO2 reduction. Thus, in general, the obvious promotion during CO2RR may be related to the two features of Ti3C2Tx: (a) abundant surface vacancies for CO2 adsorption and (b) promoting the separation of carriers.
3.3 Applications in degradation
The main principle of photocatalytic degradation by photocatalytic semiconductor materials is that light stimulates the generation of oxidizing holes.90–93 These can oxidize dissolved oxygen into efficient oxygen-active species such as superoxide radicals (˙O2−), singlet oxygen (˙O), and hydroxyl radicals (˙OH). These species can directly oxidize the substrate.94–96 Ti3C2 has a wealth of surface groups and active sites, which are conducive for the adsorption of substrates. Accordingly, Ti3C2 has been of particular interest as a photoactive degradation catalyst. A summary of the previous studies investigating the application of Ti3C2 in photocatalytic degradation reactions is shown in Table 3.| Photocatalyst | Substrate of degradation | Removal rate (%)/rate constants (min−1) | Reaction conditions | Light source | Oxygenic species | Morphology | Monolayer or multilayer | Year | Ref. | |||||||||||||||||
|---|---|---|---|---|---|---|---|---|---|---|---|---|---|---|---|---|---|---|---|---|---|---|---|---|---|---|
| Ag3PO4/Ti3C2 | Methyl orange (MO) | (rate constants) 0.094 (MO) | 20 mg catalyst + 50 mL 20 mg L−1 substrate, 30 min dark adsorption | 300 W Xe lamp (λ > 420 nm) | h+ (main) | 2D Ti3C2/Ag3PO4 particles | Monolayer | 2018 | 87 | |||||||||||||||||
| 2,4-Dinitrophenol (2,4-DNP) | 2,4-DNP (0.005) | ˙OH | ||||||||||||||||||||||||
| Tetracycline hydrochloride (TC–H) | TC–H (0.32) | |||||||||||||||||||||||||
| Thiamphenicol (TPL) | TPL (0.0042) | |||||||||||||||||||||||||
| Chloramphenicol (CPL) | CPL (0.025) | |||||||||||||||||||||||||
| Ti3C2/SrTiO3 composites | UO22+ | (Removal rate) | 20 mg catalyst + 60 mL 50 ppm substrate, 8 hours dark adsorption | 300 W Xe lamp (λ = 320–2500 nm) | ˙OH | 2D Ti3C2/SrTiO3 particles | Multilayer | 2019 | 97 | |||||||||||||||||
| 77% in 180 min | ||||||||||||||||||||||||||
| Ti3C2–OH/Bi2WO6 composites | Rhodamine B | (Rate constants) 0.0596 | 10 mg catalyst + 50 mL 2 × 10⁻⁵ mol L−1 substrate, 30 min dark adsorption | 300 W Xe lamp (λ = 400–2500 nm) | h+ | Porous spherical structure | Ti3C2–OH | 2019 | 98 | |||||||||||||||||
| MoS2@Ti3C2 Nanohybrid | Liquid paraffin (LP) | (Rate constants) 0.0476 | A certain amount of sample + 2.0 g of deionized water and 1.0 g of LP + 10 mL dichloromethane as the sacrifice reagent, 30 min dark adsorption | 1000 W high-pressure mercury lamp | MoS2 nanosheets/Ti3C2 sheets | Multilayer | 2019 | 99 | ||||||||||||||||||
| 0D/2D Bi3TaO7/Ti3C2 | Methylene blue | (Rate constants) 0.032 | 50 mg catalyst + 100 mL 10 mg L−1 | 300 W Xe lamp (λ > 420 nm) | ˙OH | Bi3TaO7 nanoparticles/Ti3C2 nanosheets | Multilayer | 2020 | 100 | |||||||||||||||||
| Substrate, 60 min dark adsorption | ||||||||||||||||||||||||||
| 2D/2D Ti3C2/Porous g-C3N4 | Phenol | (Rate constants) 0.022 | 20 mg catalyst + 50 mL 10 mg L−1 | 500 W Xe lamp (λ > 400 nm) | 2D/2D Ti3C2/PCN nanocomposite | Multilayer with ultra-sonication | 2020 | 101 | ||||||||||||||||||
| Substrate, 30 min dark adsorption | ||||||||||||||||||||||||||
| CdS@Ti3C2@TiO2 | Sulfachloropyridazine (SCP) | (Removal rate) SCP (about 95% in 60 min) | 50 mg catalyst + 200 mL 20 mg L−1 | Light intensity 300 mW cm−2 (λ = 400–1050 nm) | ˙O2− | CdS nanoparticles/Ti3C2@TiO2 bulk | Bulk Ti3C2@TiO2 | 2019 | 102 | |||||||||||||||||
| Methylene blue (MB) | MB (about 80% in 60 min) | |||||||||||||||||||||||||
| Rhodamine B (RhB) | RhB (about 99% in 60 min) | substrate, 30 min dark adsorption | ||||||||||||||||||||||||
| Phenol | Phenol (about 50% in 60 min) | |||||||||||||||||||||||||
| (111) TiO2-x/Ti3C2 | Mmethylene blue (MB) | (Removal rate) MB (75% in 150 min) | 10 mg catalyst + 200 mL 20 mg L−1 | 500 W Xe lamp (λ > 400 nm) | ˙OH (main) | TiO2 nanoparticles/Ti3C2 nanosheets | Multilayer | 2017 | 103 | |||||||||||||||||
| (001) TiO2/Ti3C2 | Methyl orange (MO) | (Rate constants) 0.018 | 10 mg catalyst + 200 mL 20 mg L−1 substrate, 60 min dark adsorption | 300 W Xe lamp | ˙OH (main) | TiO2 square nanosheets/Ti3C2 nanosheets | Multilayer | 2016 | 104 | |||||||||||||||||
| Graphene layers anchored TiO2/g-C3N4 | Rhodamine B (RhB) | (Rate constants) 0.0559 (RhB) | 10 mg catalyst + 200 mL (RhB 20 mg L−1, TC 10 mg L−1, CIP 3 mg L−1, BPA 5 mg L−1), 60 min dark adsorption | 300 W Xe lamp (λ > 400 nm) | ˙OH | 3D bulk | Bulk Ti3C2@TiO2 | 2020 | 105 | |||||||||||||||||
| Tetracycline (TC) | 0.0244 (TC) | ˙O2− | ||||||||||||||||||||||||
| Ciprofloxacin (CIP) | 0.0168 (CIP) | h+ | ||||||||||||||||||||||||
| Bisphenol A (BPA) | 0.0194 (BPA) | |||||||||||||||||||||||||
| 2D/2D Ti3C2/MoS2 | Methylene orange (MO) | (Rate constants) 0.00836 | 50 mg catalyst + 50 mL 20, 30, 50 mg L−1 substrate, 30 min dark adsorption, 60 min dark adsorption | 400 W metal halide lamp | h+ | Flower-like nanosphere | Multilayer | 2020 | 106 | |||||||||||||||||
| ˙OH | ||||||||||||||||||||||||||
| α-Fe2O3/ZnFe2O4@Ti3C2 | Rhodamine B (RhB) | (Rate constants) 0.02686 (RhB) (Removal rate) | 20 mg catalyst + 100 mL 10 mg L−1 substrate, 30 min dark adsorption | 300 W Xe lamp (λ > 400 nm) | ˙O2− | α-Fe2O3/ZnFe2O4 nanoparticles/Ti3C2 nanosheets | Multilayer | 2019 | 107 | |||||||||||||||||
| Cr(VI) | Cr(VI) | ˙OH | ||||||||||||||||||||||||
| Light off: about 70% in 90 min | h+ | |||||||||||||||||||||||||
| Light on: about 90% in 90 min | ||||||||||||||||||||||||||
In 2018, Cai et al. produced a Ag3PO4/Ti3C2 composite photocatalyst, which possessed excellent photocatalytic degradation performance.87
As shown in Fig. 19, after DMSO and sonication treatment, Ti3C2 with a low-layer structure was formed. After the addition of silver nitrate, Ag+ was adsorbed due to the negative charge on the surface of Ti3C2. Ag3PO4 nanoparticles were grown in situ, forming a heterojunction between the Ag3PO4 nanoparticles and the Ti3C2 nanosheets.
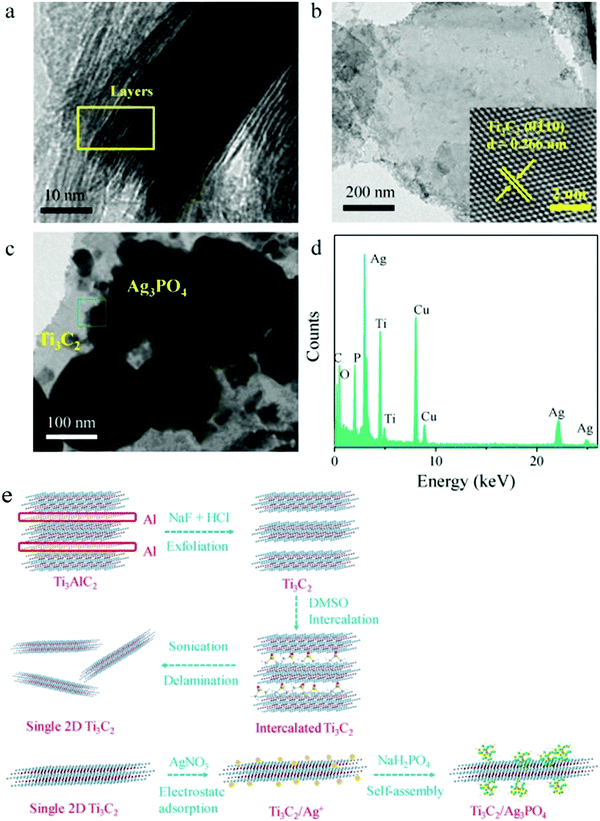 | ||
| Fig. 19 TEM images of (a) bulk Ti3C2, (b) single Ti3C2 sheet, (c) Ag3PO4/Ti3C2 composite. (d) EDX spectra of the Ag3PO4/Ti3C2 composite and (e) the schematic representation of single 2D Ti3C2 sheets and Ag3PO4/Ti3C2 synthesis.87 | ||
As shown in Fig. 20, the heterojunction of the Ag3PO4 nanoparticles/Ti3C2 nanosheets shows a photocatalytic degradation stage rate K of 0.094, 0.005, 0.32, and 0.0042 min−1 for methyl orange (MO), 2,4-dinitrophenol (2,4-DNP), tetracycline (TC–H), thiamphenicol (TPL), and chloramphenicol (CPL), respectively. According to EPR analysis, the hydroxyl radical (˙OH) plays an important role in the oxidation system, as shown in Fig. 20(f). This may be related to abundant Ti defects on the Ti3C2 surface. Ti sites exposed on the surface of Ti3C2 have strong redox reactivity, which promotes multiple electron reduction reactions (O2 → H2O2 → ˙OH).
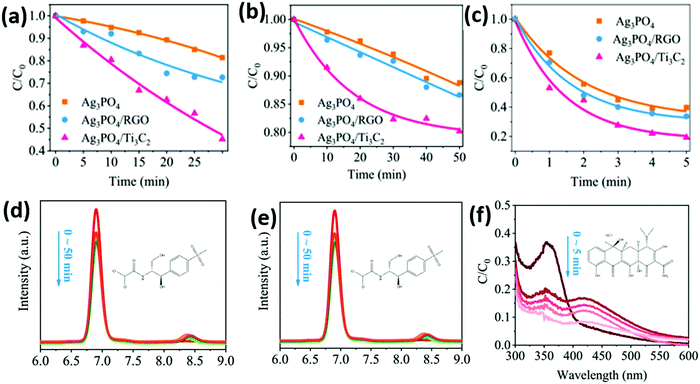 | ||
| Fig. 20 Photocatalytic degradation of various pollutants by the as-prepared catalysts. (a) CPL, (b) TPL, and (c) TC-H degradation efficiency in the presence of the as-prepared catalysts under visible light irradiation (λ > 420 nm). HPLC chromatogram of (d) CPL and (e) TPL under different degradation times using the as-prepared catalysts. (f) UV-vis absorption spectra of TC–H under different degradation times using different catalysts.87 | ||
As shown in Fig. 21, PL, TRPL, and the electrochemical characterization spectra indicate that the carrier separation efficiency of the material is significantly improved after carrying Ti3C2. This may be attributed to (i) the abundant surface hydrophilic functional groups of the Ti3C2 construct, which have strong interfacial contact with Ag3PO4, facilitating the separation of carriers; (ii) the strong redox reactivity of the surface Ti sites, which promote multiple electron reduction reactions to induce more ˙OH production; and (iii) a Schottky junction formed at the Ag3PO4/Ti3C2 interface enabling efficient transfer electrons to the Ti3C2 surface. This inhibits the photocossion of Ag3PO4 caused by photogeneration electrons.
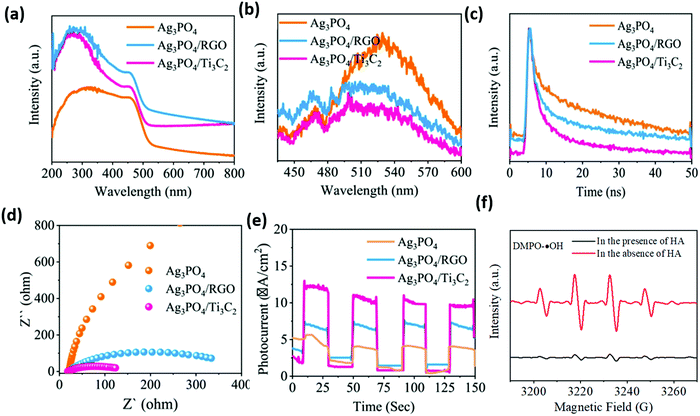 | ||
| Fig. 21 UV-vis diffuse reflectance spectra (a), PL spectra (b), time-resolved PL decay spectra (c), EIS Nyquist plots (d), transient photocurrent responses (e) of the as-prepared catalysts, and DMPO spin-trapping ESR spectra for DMPO–˙OH in the Ag3PO4/Ti3C2 system in the presence or absence of HA.87 | ||
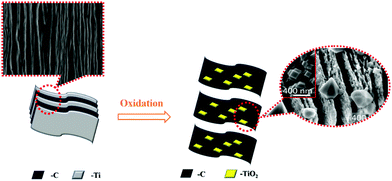
Under high temperature conditions, Ti in the Ti3C2 skeleton layer is oxidized into TiO2, while C still exists in the form of a graphene-like layer. Therefore, under high temperature conditions, Ti3C2 can be converted into amorphous TiO2 anchored within the graphene-like layer. In 2020, Wu et al. took advantage of this material, which displayed excellent photocatalytic degradation performance.105
As shown in Fig. 22(e) and (f), high temperature treated Ti3C2 still retains its morphology and a 3D block-shaped morphology is formed after carrying g-C3N4 (Fig. 23).
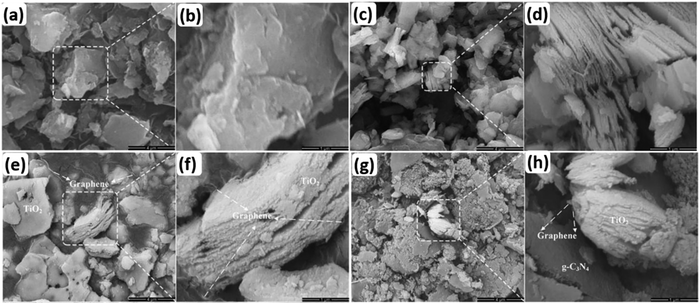 | ||
| Fig. 22 SEM images of C3N4 (a and b), Ti3C2 (c and d), heated Ti3C2 (e and f), and graphene layers anchored TiO2/g-C3N4 (g and h).105 | ||
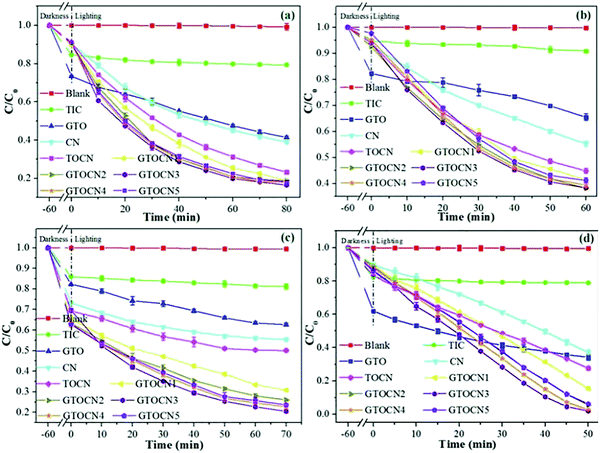 | ||
| Fig. 23 The photocatalytic degradation performance of TC (a), CIP (b), BPA (c), and RhB (d) by photocatalysts under visible light irradiation.105 | ||
Graphene layers anchored to TiO2/g-C3N4 show first-order kinetic constants for the degradation of rhodamine B (RhB), tetracycline (TC), ciprofloxacin (CIP), and bisphenol A (BPA) of 0.0559, 0.0244, 0.0168, and 0.0194 min−1, respectively. According to the EPR test results (Fig. 24(a)–(d)), the oxygen active species that play a role in the oxidation process mainly include ˙O2− and ˙OH. Furthermore, signals corresponding to the holes (h+) were also detected. The contribution to the degradation of these test molecules appears to be in the order of ˙O2− > h+ > ˙OH.
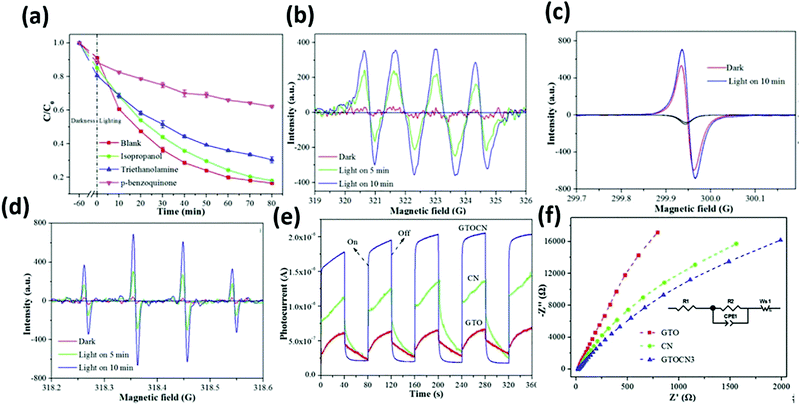 | ||
| Fig. 24 Trapping experiment for the photocatalytic degradation of TC over GTOCN3 (a); ESR spectra of CNTOC3 for (b) DMPO–˙O2−, (c) TEMPO–h+, (d) DMPO–˙OH in the dark and under visible light irradiation, I–T curves under visible light irradiation (e) and the EIS response (f) of the samples.105 | ||
High-temperature treated Ti3C2 has a greatly enhanced light absorption capacity, whilst the carrier separation efficiency and transmission efficiency are also improved. The improvement of the photocurrent (Fig. 24(e) and (f)) also verified that the graphene layers anchoring TiO2 lead to the formation of a heterogeneous junction. This is due to the change in the electric field between g-C3N4.
In conclusion, as a co-catalyst, the application of Ti3C2Tx in photocatalytic degradation is mainly due to its three characteristics: (a) in a liquid–solid phase reaction, its hydrophilicity makes it easy for the adsorption or contact between the pollutants and photocatalysts; (b) high throughput electron transfer makes it easier to generate concentrated holes (h+); and (c) Ti sites exposed on the surface of Ti3C2 have strong redox reactivity, which promotes multiple electron reduction reactions, such as the reaction of activating molecular oxygen (O2→H2O2→˙OH).
4. Challenges
The application of Ti3C2Tx in photocatalysis is worthy of further investigation, despite the many problems that need to be solved. The main issue lies in the instability of the composite material, resulting in unstable photocatalytic performance. This contributes to the difficulty in determining the photocatalytic process mechanisms of Ti3C2Tx-based photocatalysts. Many of the existing solutions use either few- or single-layer structured materials. However, the preparation process of these is complex. Despite this, Ti3C2Tx has an excellent optical response ability and displays broad catalytic activity.5. Summary and outlook
5.1 Summary
In recent years, Ti3C2Tx has attracted wide interest as a photocatalytic material due to its rich surface space and surface defects, hydrophilic properties, large interlayer spacing, and excellent microwave absorbing properties. Ti3C2Tx-based photocatalysts are widely used in hydrogen evolution reactions (HER), CO2 reduction reactions (CO2RR), photocatalytic degradation reactions, and show excellent catalytic performance. The application of Ti3C2Tx in photocatalysis still warrants further investigation.The further application of Ti3C2Tx in photocatalysis depends on the development of the material itself. Methods to improve the stability of the Ti3C2Tx structure need to be explored, starting from synthetic methods. In addition, the rich groups on the surface of Ti3C2Tx and its hydrophilicity should be further explored, particularly in photocatalytic liquid phase reactions.
5.2 Outlook
During photocatalytic CO2RR, although both monolayer-structured and multilayer-structured Ti3C2Tx exhibit high performance, isotope detection shows that some carbon resources come from CO2 molecular; thus, there are still some ambiguities and other possibilities. For example, the valence state of “C” in Ti3C2Tx is mostly “−4”, which makes it possible for CO2 to react with Ti3C2Tx in order to form the CO as product; this pathway involves redox reaction rather than catalysis.
This, in all, the mechanism needs to be explored more, both during the photocatalytic reaction and the oxidation of Ti3C2Tx itself.
Ti3C2Tx is the earliest material in the MXene family; thus, the improvement of its application in photocatalysis represents a great significance for the application of the whole family.
Conflicts of interest
There are no conflicts to declare.Acknowledgements
This work was supported by the National Natural Science Foundation of China (No. 51702270 and 51872147), the 111 Project (D20015), the Program for Innovative Research Team of Science and Technology in the University of Henan Province (19IRTSTHN025), PetroChina Innovation Foundation (No. 2018D-5007-0604), and Sichuan Science and Technology Program (No. 2020JDJQ0057).References
- J. Mao, Z. Liu and Z. Ren, Size effect in thermoelectric materials, npj Quantum Mater., 2016, 1(1), 16028 CrossRef.
- X. Feng, G. Hu and J. Hu, Solution-phase synthesis of metal and/or semiconductor homojunction/heterojunction nanomaterials, Nanoscale, 2011, 3(5), 2099–2117 RSC.
- S. Zhang, S. Guo, Z. Chen, Y. Wang, H. Gao, J. Gomez-Herrero, P. Ares, F. Zamora, Z. Zhu and H. Zeng, Recent progress in 2D group-VA semiconductors: from theory to experiment, Chem. Soc. Rev., 2018, 47(3), 982–1021 RSC.
- M. Naguib, M. Kurtoglu, V. Presser, J. Lu, J. Niu, M. Heon, L. Hultman, Y. Gogotsi and M. W. Barsoum, Two-dimensional nanocrystals produced by exfoliation of Ti3AlC2, Adv. Mater., 2011, 23(37), 4248–4253 CrossRef CAS.
- N. K. Chaudhari, H. Jin, B. Kim, D. San Baek, S. H. Joo and K. Lee, MXene: an emerging two-dimensional material for future energy conversion and storage applications, J. Mater. Chem. A, 2017, 5(47), 24564–24579 RSC.
- Y. Zhang, L. Wang, N. Zhang and Z. Zhou, Adsorptive environmental applications of MXene nanomaterials: a review, RSC Adv., 2018, 8(36), 19895–19905 RSC.
- K. Huang, Z. Li, J. Lin, G. Han and P. Huang, Two-dimensional transition metal carbides and nitrides (MXenes) for biomedical applications, Chem. Soc. Rev., 2018, 47(14), 5109–5124 RSC.
- B. Anasori, M. R. Lukatskaya and Y. Gogotsi, 2D metal carbides and nitrides (MXenes) for energy storage, Nat. Rev. Mater., 2017, 2(2), 16098 CrossRef CAS.
- T. Deng, J. Sun, P. Tai, Y. Wang, L. Zhang, H. Chang, Z. Wang, L. Niu, Y. Sheng, D. Xue, Q. Huang, Y. Zhou, P. Song and J. Li, Ti3AlC2, a candidate structural material for innovative nuclear energy system: the microstructure phase transformation and defect evolution induced by energetic heavy-ion irradiation, Acta Mater., 2020, 189, 188–203 CrossRef CAS.
- J. Halim, M. R. Lukatskaya, K. M. Cook, J. Lu, C. R. Smith, L. A. Naslund, S. J. May, L. Hultman, Y. Gogotsi, P. Eklund and M. W. Barsoum, Transparent conductive two-dimensional titanium carbide epitaxial thin films, Chem. Mater., 2014, 26(7), 2374–2381 CrossRef CAS.
- A. Hu, J. Yu, H. Zhao, H. Zhang and W. Li, One-step synthesis for cations intercalation of two-dimensional carbide crystal Ti3C2 MXene, Appl. Surf. Sci., 2020, 505, 144538 CrossRef CAS.
- M. Ghidiu, M. R. Lukatskaya, M. Q. Zhao, Y. Gogotsi and M. W. Barsoum, Conductive two-dimensional titanium carbide ‘clay’ with high volumetric capacitance, Nature, 2014, 516(7529), 78–81 CrossRef CAS.
- M. R. Lukatskaya, O. Mashtalir, C. E. Ren, Y. Dall'Agnese, P. Rozier, P. L. Taberna, M. Naguib, P. Simon, M. W. Barsoum and Y. Gogotsi, Cation intercalation and high volumetric capacitance of two-dimensional titanium carbide, Science, 2013, 341(6153), 1502–1505 CrossRef CAS.
- L. H. Karlsson, J. Birch, J. Halim, M. W. Barsoum and P. O. Persson, Atomically resolved structural and chemical investigation of single MXene sheets, Nano Lett., 2015, 15(8), 4955–4960 CrossRef CAS.
- D. Magne, V. Mauchamp, S. Celerier, P. Chartier and T. Cabioc'h, Site-projected electronic structure of two-dimensional Ti3C2 MXene: the role of the surface functionalization groups, Phys. Chem. Chem. Phys., 2016, 18(45), 30946–30953 RSC.
- H. W. Wang, M. Naguib, K. Page, D. J. Wesolowski and Y. Gogotsi, Resolving the structure of Ti3C2Tx MXenes through multilevel structural modeling of the atomic pair distribution function, Chem. Mater., 2016, 28(1), 349–359 CrossRef CAS.
- K. J. Harris, M. Bugnet, M. Naguib, M. W. Barsoum and G. R. Goward, Direct measurement of surface termination groups and their connectivity in the 2D MXene V2CTx using NMR spectroscopy, J. Phys. Chem. C, 2015, 119(24), 13713–13720 CrossRef CAS.
- M. A. Hope, A. C. Forse, K. J. Griffith, M. R. Lukatskaya, M. Ghidiu, Y. Gogotsi and C. P. Grey, NMR reveals the surface functionalisation of Ti3C2 MXene, Phys. Chem. Chem. Phys., 2016, 18(7), 5099–5102 RSC.
- Q. Xue, H. Zhang, M. Zhu, Z. Pei, H. Li, Z. Wang, Y. Huang, Y. Huang, Q. Deng, J. Zhou, S. Du, Q. Huang and C. Zhi, Photoluminescent Ti3C2 MXene quantum dots for multicolor cellular imaging, Adv. Mater., 2017, 29(15), 1604847 CrossRef.
- D. Er, J. Li, M. Naguib, Y. Gogotsi and V. B. Shenoy, Ti3C2 MXene as a high capacity electrode material for metal (Li, Na, K, Ca) ion batteries, ACS Appl. Mater. Interfaces, 2014, 6(14), 11173–11179 CrossRef CAS.
- Q. Tang, Z. Zhou and P. Shen, Are MXenes promising anode materials for Li ion batteries? Computational studies on electronic properties and Li storage capability of Ti3C2 and Ti3C2X2 (X = F, OH) monolayer, J. Am. Chem. Soc., 2012, 134(40), 16909–16916 CrossRef CAS.
- Q. Hu, D. Sun, Q. Wu, H. Wang, L. Wang, B. Liu, A. Zhou and J. He, MXene: a new family of promising hydrogen storage medium, J. Phys. Chem. A, 2013, 117(51), 14253–14260 CrossRef CAS.
- Y. Xie, Y. Dall'Agnese, M. Naguib, Y. Gogotsi, M. W. Barsoum, H. L. L. Zhuang and P. R. C. Kent, Prediction and characterization of MXene nanosheet anodes for non-lithium-ion batteries, ACS Nano, 2014, 8(9), 9606–9615 CrossRef CAS.
- C. Eames and M. S. Islam, Ion intercalation into two-dimensional transition-metal carbides: global screening for new high-capacity battery materials, J. Am. Chem. Soc., 2014, 136(46), 16270–16276 CrossRef CAS.
- H. Pan, Ultra-high electrochemical catalytic activity of MXenes, Sci. Rep., 2016, 6, 32531 CrossRef CAS.
- M. Q. Zhao, C. E. Ren, Z. Ling, M. R. Lukatskaya, C. F. Zhang, K. L. Van Aken, M. W. Barsoum and Y. Gogotsi, Flexible MXene/Carbon nanotube composite paper with high volumetric capacitance, Adv. Mater., 2015, 27(2), 339–345 CrossRef CAS.
- Z. Guo, J. Zhou, L. Zhu and Z. Sun, MXene: a promising photocatalyst for water splitting, J. Mater. Chem. A, 2016, 4(29), 11446–11452 RSC.
- M. Q. Zhao, C. E. Ren, Z. Ling, M. R. Lukatskaya, C. F. Zhang, K. L. Van Aken, M. W. Barsoum and Y. Gogotsi, Flexible MXene/Carbon nanotube composite paper with high volumetric capacitance, Adv. Mater., 2015, 27(2), 339–345 CrossRef CAS.
- G. Gao, A. P. O’Mullane and A. Du, 2D MXenes: A new family of promising catalysts for the hydrogen evolution reaction, ACS Catal., 2016, 7(1), 494–500 CrossRef.
- J. Ran, G. Gao, F.-T. Li, T.-Y. Ma, A. Du and S.-Z. Qiao, Ti3C2 MXene co-catalyst on metal sulfide photo-absorbers for enhanced visible-light photocatalytic hydrogen production, Nat. Commun., 2017, 8(1), 13907 CrossRef CAS.
- M. Naguib, O. Mashtalir, M. R. Lukatskaya, B. Dyatkin, C. Zhang, V. Presser, Y. Gogotsi and M. W. Barsoum, One-step synthesis of nanocrystalline transition metal oxides on thin sheets of disordered graphitic carbon by oxidation of MXenes, Chem. Commun., 2014, 50(56), 7420–7423 RSC.
- X. Han, L. An, Y. Hu, Y. Li, C. Hou, H. Wang and Q. Zhang, Ti3C2 MXene-derived carbon-doped TiO2 coupled with g-C3N4 as the visible-light photocatalysts for photocatalytic H2 generation, Appl. Catal., B, 2020, 265, 118539 CrossRef CAS.
- X. Sang, Y. Xie, M. W. Lin, M. Alhabeb, K. L. Van Aken, Y. Gogotsi, P. R. C. Kent, K. Xiao and R. R. Unocic, Atomic defects in monolayer titanium carbide (Ti3C2Tx) MXene, ACS Nano, 2016, 10(10), 9193–9200 CrossRef CAS.
- W. Zhou, X. Zou, S. Najmaei, Z. Liu, Y. Shi, J. Kong, J. Lou, P. M. Ajayan, B. I. Yakobson and J. C. Idrobo, Intrinsic structural defects in monolayer molybdenum disulfide, Nano Lett., 2013, 13(6), 2615–2622 CrossRef CAS.
- M. H. Gass, U. Bangert, A. L. Bleloch, P. Wang, R. R. Nair and A. K. Geim, Free-standing graphene at atomic resolution, Nat. Nanotechnol., 2008, 3(11), 676–681 CrossRef CAS.
- K. Takanabe, Photocatalytic Water Splitting: Quantitative Approaches toward Photocatalyst by Design, ACS Catal., 2017, 7(11), 8006–8022 CrossRef CAS.
- J. Ran, J. Zhang, J. Yu, M. Jaroniec and S. Z. Qiao, Earth-abundant cocatalysts for semiconductor-based photocatalytic water splitting, Chem. Soc. Rev., 2014, 43(22), 7787–7812 RSC.
- S. S. Chen, T. Takata and K. Domen, Particulate photocatalysts for overall water splitting, Nat. Rev. Mater., 2017, 2(10), 17050 CrossRef CAS.
- A. Kudo and Y. Miseki, Heterogeneous photocatalyst materials for water splitting, Chem. Soc. Rev., 2009, 38(1), 253–278 RSC.
- Y. Jiao, Y. Zheng, M. Jaroniec and S. Z. Qiao, Design of electrocatalysts for oxygen- and hydrogen-involving energy conversion reactions, Chem. Soc. Rev., 2015, 44(8), 2060–2086 RSC.
- J. K. Norskov, T. Bligaard, J. Rossmeisl and C. H. Christensen, Towards the computational design of solid catalysts, Nat. Chem., 2009, 1(1), 37–46 CrossRef CAS.
- J. K. Nørskov, T. Bligaard, A. Logadottir, J. R. Kitchin, J. G. Chen, S. Pandelov and U. Stimming, Trends in the exchange current for hydrogen evolution, J. Electrochem. Soc., 2005, 152(3), J23 CrossRef.
- H. Berit, G. H. Poul, B. Jacob, P. J. Kristina, H. N. Jane, H. Sebastina, C. lb and K. N. Jens, Biomimetic hydrogen evolution: MoS2 nanoparticles as catalyst for hydrogen evolution, J. Am. Chem. Soc., 2005, 15(127), 5308–5309 Search PubMed.
- W. Yuan, L. Cheng, Y. Zhang, H. Wu, S. Lv, L. Chai, X. Guo and L. Zheng, 2D-layered Carbon/TiO2 hybrids derived from Ti3C2 MXenes for photocatalytic hydrogen evolution under visible light irradiation, Adv. Mater. Interfaces, 2017, 4(20), 1700577 CrossRef.
- H. Wang, R. Peng, Z. D. Hood, M. Naguib, S. P. Adhikari and Z. Wu, Titania composites with 2D transition metal carbides as photocatalysts for hydrogen production under visible-light irradiation, ChemSusChem, 2016, 9(12), 1490–1497 CrossRef CAS.
- X. An, W. Wang, J. Wang, H. Duan, J. Shi and X. Yu, The synergetic effects of Ti3C2 MXene and Pt as co-catalysts for highly efficient photocatalytic hydrogen evolution over g-C3N4. Phys. Chem.y, Chem. Phys., 2018, 20(16), 11405–11411 CAS.
- W. Yuan, L. Cheng, Y. An, S. Lv, H. Wu, X. Fan, Y. Zhang, X. Guo and J. Tang, Laminated hybrid junction of sulfur-doped TiO2 and a carbon substrate derived from Ti3C2 MXenes: toward highly visible light-driven photocatalytic hydrogen evolution, Adv. Sci., 2018, 5(6), 1700870 CrossRef.
- Y. Li, X. Deng, J. Tian, Z. Liang and H. Cui, Ti3C2 MXene-derived Ti3C2/TiO2 nanoflowers for noble-metal-free photocatalytic overall water splitting. Appl, Mater. Today, 2018, 13, 217–227 Search PubMed.
- H. Wang, Y. Sun, Y. Wu, W. Tu, S. Wu, X. Yuan, G. Zeng, Z. J. Xu, S. Li and J. W. Chew, Electrical promotion of spatially photoinduced charge separation via interfacial-built-in quasi-alloying effect in hierarchical Zn2In2S5/Ti3C2(O, OH)x hybrids toward efficient photocatalytic hydrogen evolution and environmental remediation, Appl. Catal., B, 2019, 245, 290–301 CrossRef CAS.
- M. Zhang, J. Qin, S. Rajendran, X. Zhang and R. Liu, Heterostructured d-Ti3C2/TiO2/g-C3N4 nanocomposites with enhanced visible-light photocatalytic hydrogen production activity, ChemSusChem, 2018, 11(24), 4226–4236 CrossRef CAS.
- L. Tie, S. Yang, C. Yu, H. Chen, Y. Liu, S. Dong, J. Sun and J. Sun, In situ decoration of ZnS nanoparticles with Ti3C2 MXene nanosheets for efficient photocatalytic hydrogen evolution, J. Colloid Interface Sci., 2019, 545, 63–70 CrossRef CAS.
- R. Xiao, C. Zhao, Z. Zou, Z. Chen, L. Tian, H. Xu, H. Tang, Q. Liu, Z. Lin and X. Yang, In situ fabrication of 1D CdS nanorod/2D Ti3C2 MXene nanosheet Schottky heterojunction toward enhanced photocatalytic hydrogen evolution, Appl. Catal., B, 2020, 268, 118382 CrossRef CAS.
- Y. Zhuang, Y. Liu and X. Meng, Fabrication of TiO2 nanofibers/MXene Ti3C2 nanocomposites for photocatalytic H2 evolution by electrostatic self-assembly, Appl. Surf. Sci., 2019, 496, 143647 CrossRef CAS.
- T. Su, Z. D. Hood, M. Naguib, L. Bai, S. Luo, C. M. Rouleau, I. N. Ivanov, H. Ji, Z. Qin and Z. Wu, Monolayer Ti3C2Tx as an effective co-catalyst for enhanced photocatalytic hydrogen production over TiO2, ACS Appl. Energy Mater., 2019, 2(7), 4640–4651 CrossRef CAS.
- J. Zhang, C. Xing and F. Shi, MoS2/Ti3C2 heterostructure for efficient visible-light photocatalytic hydrogen generation, Int. J. Hydrogen Energy, 2020, 45(11), 6291–6301 CrossRef CAS.
- P. Lin, J. Shen, X. Yu, Q. Liu, D. Li and H. Tang, Construction of Ti3C2 MXene/O-doped g-C3N4 2D–2D Schottky-junction for enhanced photocatalytic hydrogen evolution, Ceram. Int., 2019, 45(18), 24656–24663 CrossRef CAS.
- L. Cheng, Q. Chen, J. Li and H. Liu, Boosting the photocatalytic activity of CdLa2S4 for hydrogen production using Ti3C2 MXene as a co-catalyst, Appl. Catal., B, 2020, 267, 118379 CrossRef CAS.
- Y. Li, L. Ding, Y. Guo, Z. Liang, H. Cui and J. Tian, Boosting the photocatalytic ability of g-C3N4 for hydrogen production by Ti3C2 MXene quantum dots, ACS Appl. Mater. Interfaces, 2019, 11(44), 41440–41447 CrossRef CAS.
- Y. Li, L. Ding, Z. Liang, Y. Xue, H. Cui and J. Tian, Synergetic effect of defects rich MoS2 and Ti3C2 MXene as cocatalysts for enhanced photocatalytic H2 production activity of TiO2, Chem. Eng. J., 2020, 383, 123178 CrossRef CAS.
- P. Tian, X. He, L. Zhao, W. Li, W. Fang, H. Chen, F. Zhang, Z. Huang and H. Wang, Ti3C2 nanosheets modified Zr-MOFs with Schottky junction for boosting photocatalytic HER performance, Sol. Energy, 2019, 188, 750–759 CrossRef CAS.
- Z. Ai, K. Zhang, B. Chang, Y. Shao, L. Zhang, Y. Wu and X. Hao, Construction of CdS@Ti3C2@CoO hierarchical tandem p–n heterojunction for boosting photocatalytic hydrogen production in pure water, Chem. Eng. J., 2020, 383, 123130 CrossRef CAS.
- J.-H. Zhao, L.-W. Liu, K. Li, T. Li and F.-T. Liu, Conductive Ti3C2 and MOF-derived CoSx boosting the photocatalytic hydrogen production activity of TiO2, CrystEngComm, 2019, 21(14), 2416–2421 RSC.
- Z. Ai, Y. Shao, B. Chang, B. Huang, Y. Wu and X. Hao, Effective orientation control of photogenerated carrier separation via rational design of a Ti3C2(TiO2)@CdS/MoS2 photocatalytic system, Appl. Catal., B, 2019, 242, 202–208 CrossRef CAS.
- Y. Li, Z. Yin, G. Ji, Z. Liang, Y. Xue, Y. Guo, J. Tian, X. Wang and H. Cui, 2D/2D/2D heterojunction of Ti3C2 MXene/MoS2 nanosheets/TiO2 nanosheets with exposed (001) facets toward enhanced photocatalytic hydrogen production activity, Appl. Catal., B, 2019, 246, 12–20 CrossRef CAS.
- J. Li, L. Zhao, S. Wang, J. Li, G. Wang and J. Wang, In situ fabrication of 2D/3D g-C3N4/Ti3C2 (MXene) heterojunction for efficient visible-light photocatalytic hydrogen evolution, Appl. Surf. Sci., 2020, 515, 145922 CrossRef CAS.
- J. Zhang, M. Liu, Y. Wang and F. Shi, Au/MoS2/Ti3C2 composite catalyst for efficient photocatalytic hydrogen evolution, CrystEngComm, 2020, 22(21), 3683–3691 RSC.
- T. Su, Z. D. Hood, M. Naguib, L. Bai, S. Luo, C. M. Rouleau, I. N. Ivanov, H. Ji, Z. Qin and Z. Wu, 2D/2D heterojunction of Ti3C2/g-C3N4 nanosheets for enhanced photocatalytic hydrogen evolution, Nanoscale, 2019, 11(17), 8138–8149 RSC.
- J. Yin, F. Zhan, T. Jiao, W. Wang, G. Zhang, J. Jiao, G. Jiang, Q. Zhang, J. Gu and Q. Peng, Facile preparation of self-assembled MXene@Au@CdS nanocomposite with enhanced photocatalytic hydrogen production activity, Sci. China Mater., 2020, 63(11), 2228–2238 CrossRef CAS.
- Z. Yao, H. Sun, H. Sui and X. Liu, Construction of BPQDs/Ti3C2@TiO2 composites with favorable charge transfer channels for enhanced photocatalytic activity under visible light irradiation, Nanomater., 2020, 10(3), 452 CrossRef CAS.
- J. Liu, H.-B. Zhang, R. Sun, Y. Liu, Z. Liu, A. Zhou and Z.-Z. Yu, Hydrophobic, flexible, and lightweight MXene foams for high-performance electromagnetic-interference shielding, Adv. Mater., 2017, 29(38), 1702367 CrossRef.
- Y. Chen, G. Jia, Y. Hu, G. Fan, Y. H. Tsang, Z. Li and Z. Zou, Two-dimensional nanomaterials for photocatalytic CO2 reduction to solar fuels, Sustainable Energy Fuels, 2017, 1(9), 1875–1898 RSC.
- J. Fu, K. Jiang, X. Qiu, J. Yu and M. Liu, Product selectivity of photocatalytic CO2 reduction reactions, Mater. Today, 2020, 32, 222–243 CrossRef CAS.
- K. Li, B. Peng and T. Peng, Recent advances in heterogeneous photocatalytic CO2 conversion to solar fuels, ACS Catal., 2016, 6(11), 7485–7527 CrossRef CAS.
- J. L. White, M. F. Baruch, J. E. Pander Iii, Y. Hu, I. C. Fortmeyer, J. E. Park, T. Zhang, K. Liao, J. Gu, Y. Yan, T. W. Shaw, E. Abelev and A. B. Bocarsly, Light-driven heterogeneous reduction of carbon dioxide: photocatalysts and photoelectrodes, Chem. Rev., 2015, 115(23), 12888–12935 CrossRef CAS.
- X. Zhang, Z. Zhang, J. Li, X. Zhao, D. Wu and Z. Zhou, Ti2CO2 MXene: a highly active and selective photocatalyst for CO2 reduction, J. Mater. Chem. A, 2017, 5(25), 12899–12903 RSC.
- H. He, P. Zapol and L. A. Curtiss, Computational screening of dopants for photocatalytic two-electron reduction of CO2 on anatase (101) surfaces, Energy Environ. Sci., 2012, 5(3), 6196–6205 RSC.
- Y. Ji and Y. Luo, Theoretical study on the mechanism of photoreduction of CO2 to CH4 on the anatase TiO2(101) surface, ACS Catal., 2016, 6(3), 2018–2025 CrossRef CAS.
- Y. Ji and Y. Luo, New mechanism for photocatalytic reduction of CO2 on the anatase TiO2(101) surface: the essential role of oxygen vacancy, J. Am. Chem. Soc., 2016, 138(49), 15896–15902 CrossRef CAS.
- C. Yang, Q. Tan, Q. Li, J. Zhou, J. Fan, B. Li, J. Sun and K. Lv, 2D/2D Ti3C2 MXene/g-C3N4 nanosheets heterojunction for high efficient CO2 reduction photocatalyst: Dual effects of urea, Appl. Catal., B, 2020, 268, 118738 CrossRef CAS.
- Q. Tang, Z. Sun, S. Deng, H. Wang and Z. Wu, Decorating g-C3N4 with alkalinized Ti3C2 MXene for promoted photocatalytic CO2 reduction performance, J. Colloid Interface Sci., 2020, 564, 406–417 CrossRef CAS.
- J. Low, L. Zhang, T. Tong, B. Shen and J. Yu, TiO2/MXene Ti3C2 composite with excellent photocatalytic CO2 reduction activity, J. Catal., 2018, 361, 255–266 CrossRef CAS.
- S. Cao, B. Shen, T. Tong, J. Fu and J. Yu, 2D/2D heterojunction of ultrathin MXene/Bi2WO6 nanosheets for improved photocatalytic CO2 reduction, Adv. Funct. Mater., 2018, 28(21), 1800136 CrossRef.
- F. He, B. Zhu, B. Cheng, J. Yu, W. Ho and W. Macyk, 2D/2D/0D TiO2/C3N4/Ti3C2 MXene composite S-scheme photocatalyst with enhanced CO2 reduction activity, Appl. Catal., B., 2020, 272, 119006 CrossRef CAS.
- J. Halim, K. M. Cook, M. Naguib, P. Eklund, Y. Gogotsi, J. Rosen and M. W. Barsoum, X-ray photoelectron spectroscopy of select multi-layered transition metal carbides (MXenes), Appl. Surf. Sci., 2016, 362, 406–417 CrossRef CAS.
- L. Liang, F. Lei, S. Gao, Y. Sun, X. Jiao, J. Wu, S. Qamar and Y. Xie, Single unit cell bismuth tungstate layers realizing robust solar CO2 reduction to methanol, Angew. Chem., Int. Ed., 2015, 54(47), 13971–13974 CrossRef CAS.
- H. Lin, X. Wang, L. Yu, Y. Chen and J. Shi, Two-dimensional ultrathin MXene ceramic nanosheets for photothermal conversion, Nano Lett., 2017, 17(1), 384–391 CrossRef CAS.
- T. Cai, L. Wang, Y. Liu, S. Zhang, W. Dong, H. Chen, X. Yi, J. Yuan, X. Xia, C. Liu and S. Luo, Ag3PO4/Ti3C2 MXene interface materials as a Schottky catalyst with enhanced photocatalytic activities and anti-photocorrosion performance, Appl. Catal., B, 2018, 239, 545–554 CrossRef CAS.
- X. Zhao, M. Liu, Y. Chen, B. Hou, N. Zhang, B. Chen, N. Yang, K. Chen, J. Li and L. An, Fabrication of layered Ti3C2 with an accordion-like structure as a potential cathode material for high performance lithium–sulfur batteries, J. Mater. Chem. A, 2015, 3(15), 7870–7876 RSC.
- J. Qian, A. Yuan, C. Yao, J. Liu, B. Li, F. Xi and X. Dong, Highly Efficient Photo-Reduction of p-nitrophenol by protonated graphitic carbon nitride nanosheets, ChemCatChem, 2018, 10(20), 4747–4754 CrossRef CAS.
- M. R. Hoffmann, S. T. Martin and W. Choi, Environmental Applications of semiconductor photocatalysis, Chem. Rev., 1995, 95(1), 69–96 CrossRef CAS.
- S. Dong, J. Feng, M. Fan, Y. Pi, L. Hu, X. Han, M. Liu, J. Sun and J. Sun, Recent developments in heterogeneous photocatalytic water treatment using visible light-responsive photocatalysts: a review, RSC Adv., 2015, 5(19), 14610–14630 RSC.
- W. Guo, F. Zhang, C. Lin and Z. L. Wang, Direct growth of TiO2 nanosheet arrays on carbon fibers for highly efficient photocatalytic degradation of methyl orange, Adv. Mater., 2012, 24(35), 4761–4764 CrossRef CAS.
- G. Xi and J. Ye, Synthesis of bismuth vanadate nanoplates with exposed {001} facets and enhanced visible-light photocatalytic properties, Chem. Commun., 2010, 46(11), 1893–1895 RSC.
- B. B. Adormaa, W. K. Darkwah and Y. Ao, Oxygen vacancies of the TiO2 nano-based composite photocatalysts in visible light responsive photocatalysis, RSC Adv., 2018, 8(58), 33551–33563 RSC.
- V. Augugliaro, M. Bellardita, V. Loddo, G. Palmisano, L. Palmisano and S. Yurdakal, Overview on oxidation mechanisms of organic compounds by TiO2 in heterogeneous photocatalysis, J. Photochem. Photobiol., C, 2012, 13(3), 224–245 CrossRef CAS.
- Y. Nosaka and A. Y. Nosaka, Generation and Detection of Reactive Oxygen Species in Photocatalysis, Chem. Rev., 2017, 117(17), 11302–11336 CrossRef CAS.
- H. Deng, Z.-j. Li, L. Wang, L.-y. Yuan, J.-h. Lan, Z.-y. Chang, Z.-f. Chai, W.-q. Shi and Nanolayered Ti3C2, and SrTiO3 composites for photocatalytic reduction and removal of uranium(VI), ACS Appl. Nano Mater., 2019, 2(4), 2283–2294 CrossRef CAS.
- H. Fang, Y. Pan, M. Yin and C. Pan, Enhanced photocatalytic activity and mechanism of Ti3C2–OH/Bi2WO6: Yb3+,Tm3+ towards degradation of RhB under visible and near infrared light irradiation, Mater. Res. Bull., 2020, 121, 110618 CrossRef CAS.
- S. Jiao and L. Liu, Friction-induced enhancements for photocatalytic degradation of MoS2@Ti3C2 nanohybrid, Ind. Eng. Chem. Res., 2019, 58(39), 18141–18148 CrossRef CAS.
- K. Li, X. Lu, Y. Zhang, K. Liu, Y. Huang and H. Liu, Bi3TaO7/Ti3C2 heterojunctions for enhanced photocatalytic removal of water-borne contaminants, Environ. Res., 2020, 185, 109409 CrossRef CAS.
- N. Liu, N. Lu, H. Yu, S. Chen and X. Quan, Efficient day-night photocatalysis performance of 2D/2D Ti3C2/Porous g-C3N4 nanolayers composite and its application in the degradation of organic pollutants, Chemosphere, 2020, 246, 125760 CrossRef CAS.
- Q. Liu, X. Tan, S. Wang, F. Ma, H. Znad, Z. Shen, L. Liu and S. Liu, MXene as a non-metal charge mediator in 2D layered CdS@Ti3C2@TiO2 composites with superior Z-scheme visible light-driven photocatalytic activity, Environ. Sci. Nano, 2019, 6(10), 3158–3169 RSC.
- C. Peng, H. Wang, H. Yu and F. Peng, (111) TiO2−x/Ti3C2: Synergy of active facets, interfacial charge transfer and Ti3+ doping for enhance photocatalytic activity, Mater. Res. Bull., 2017, 89, 16–25 CrossRef CAS.
- C. Peng, X. Yang, Y. Li, H. Yu, H. Wang and F. Peng, Hybrids of two-dimensional Ti3C2 and TiO2 exposing {001} facets toward enhanced photocatalytic activity, ACS Appl. Mater. Interfaces, 2016, 8(9), 6051–6060 CrossRef CAS.
- Z. Wu, Y. Liang, X. Yuan, D. Zou, J. Fang, L. Jiang, J. Zhang, H. Yang and Z. Xiao, MXene Ti3C2 derived Z-scheme photocatalyst of graphene layers anchored TiO2/g-C3N4 for visible light photocatalytic degradation of refractory organic pollutants, Chem. Eng. J., 2020, 394, 124921 CrossRef CAS.
- Z. Yao, H. Sun, H. Sui and X. Liu, 2D/2D Heterojunction of R-scheme Ti3C2 MXene/MoS2 nanosheets for enhanced photocatalytic performance, Nanoscale Res. Lett., 2020, 15(1), 78 CrossRef CAS.
- H. Zhang, M. Li, C. Zhu, Q. Tang, P. Kang and J. Cao, Preparation of magnetic α-Fe2O3/ZnFe2O4@Ti3C2 MXene with excellent photocatalytic performance, Ceram. Int., 2020, 46(1), 81–88 CrossRef CAS.
- X. Zhao, A. Vashisth, E. Prehn, W. Sun, S. A. Shah, T. Habib, Y. Chen, Z. Tan, J. L. Lutkenhaus, M. Radovic and M. J. Green, Antioxidants unlock shelf-stable Ti3C2T (MXene) nanosheet dispersions, Matter, 2019, 1(2), 513–526 CrossRef.
| This journal is © The Royal Society of Chemistry 2021 |

