 Open Access Article
Creative Commons Attribution 3.0 Unported Licence
Pb(II) adsorption from aqueous solution by an aluminum-based metal organic framework–graphene oxide nanocomposite
Tonoy
Chowdhury
 *ab,
Lei
Zhang
*b,
Junqing
Zhang
b and
Srijan
Aggarwal
c
aDepartment of Mechanical Engineering, University of North Texas, Denton, TX 76207, USA. E-mail: tonoychowdhury@my.unt.edu
bDepartment of Mechanical Engineering, University of Alaska Fairbanks, PO Box 755905, Fairbanks, AK 99775, USA. E-mail: lzhang14@alaska.edu
cDepartment of Civil, Geological & Environmental Engineering, University of Alaska Fairbanks, PO Box 755900, Fairbanks, AK 99775, USA
First published on 22nd March 2021
Abstract
The composites of metal–organic frameworks (MOF) and graphene oxide (GO) have demonstrated strong potential in removing organic and inorganic contaminants from industrial wastewaters. Motivated by the promise of these emerging nanocomposites, here we report for the first time the adsorption performance of an aluminum-based MOF (MIL-53(Al)) and GO nanocomposite for Pb(II) removal from aqueous solutions. The developed GO-MIL-53(Al) nanocomposites exhibited a large surface area (∼1300 m2 g−1) with abundant active sites, and demonstrated rapid (<30 min to achieve equilibrium adsorption) and high Pb(II) removal with an equilibrium adsorption capacity of 232 mg g−1 at room temperature. The adsorption kinetics and thermodynamics analyses of the Pb(II) adsorption data indicated that the adsorption process followed the pseudo-second-order and Langmuir isotherm models, respectively. Pre and post-adsorption FTIR data illustrated that after adsorption Pb(II) ions may be transformed into the corresponding hydroxide and oxide salts owing to the interaction with oxygen and hydroxyl groups in the GO-MIL-53(Al) nanocomposite. Furthermore, the GO-MIL-53(Al) nanocomposite exhibited consistent Pb(II) removal efficiency for selected natural water samples, suggesting its potential in removing Pb(II) from complex natural water and wastewater matrices.
Introduction
Metals with an atomic weight between 63.5 and 200.6 amu and density exceeding 5 g cm−3 are considered to be heavy metals.1,2 Waste water from textile, leather, food processing, mining, oil, agricultural and pharmaceutical industries contain a high concentration of heavy metal ions such as Pb(II), Hg(II), As(III), and Cd(II).3 As these metal ions have good water solubility,4 they can be adsorbed easily by the human body when ingested, causing serious health disorders including cancer, organ damage, central nervous system damage, and even death.1,4,5The pollution from Pb(II) represents a major concern among all the heavy metals. It is a general metabolic poison and enzyme inhibitor which can damage bones, brain, kidneys and muscles after accumulating in these organs.6 Accumulating an excessive amount of Pb(II) through drinking water over an extensive period of time can cause diseases like anaemia, encephalopathy, hepatitis, kidney disease and mental impairment.7 Battery manufacturing, printing, painting and dyeing industries are some of the main sources of Pb(II) in wastewater.8
Over the years, a number of methods have been developed and reported for heavy metal removal such as solvent extraction,9 ion exchange,10 precipitation,11 filtration12,13 and photocatalytic degradation.14,15 In addition to these methods, adsorption is widely used for heavy metal removal due to its high removal capacity with selectivity, simple operation, and lower environmental impact.16 Among the plethora of adsorbents explored and investigated in the last few years, nanomaterials have emerged as superior and next-generation adsorbents due to their excellent and controllable surficial and chemical properties that lead to better adsorption of heavy metal ions compared to traditional adsorbents like porous carbon-based materials, bioadsorbents, and zeolites.3–5 Metal organic frameworks (MOFs), as a new class of crystalline nanoporous materials, have received significant interest due to their high surface areas, diverse structures, low density, and tunable porosity.17 These features make MOFs very promising materials for water treatment, gas storage and separation, electrochemical energy storage, catalysis, sensing, and drug delivery.18–20 Recently, there have been successful reports of MOFs and their composites being used to adsorb various heavy metal ions such as Pb(II), Cd(II), Co(II), Cr(VI), Ni(II), As(V) and Zn(II) from water.21,22 Similarly, graphene oxide (GO), a novel nanomaterial having a large number of active adsorption sites, has also been proven to be a great adsorbent for removing heavy metals from wastewater in recent years.23 Fabrication of a MOF–GO nanocomposite will be effective in increasing adsorption capacity for the removal of heavy metal ions and dyes.24–26 Benefiting from the large specific surface area and abundant active sites, MOF–GO composites have already shown a superior adsorption capacity compared with pristine materials.27
Herein, an aluminum-based MOF (MIL-53(Al)) and GO nanocomposite was synthesized by a facile one-step hydrothermal method, aimed at improving the adsorption capacity to remove Pb(II) ions from waste water for the first time. The effects of solution pH, initial metal ion concentration, adsorbent dosage, and temperature on Pb(II) adsorption were systematically investigated. Kinetic and thermodynamic studies were also carried out to examine the adsorption process. Moreover, the possible adsorption mechanisms at play were investigated with the use of Fourier-transform infrared spectroscopy (FTIR) data before and after Pb(II) adsorption. Finally, the efficiency and performance of the adsorbent was tested in a few different natural water samples.
Experimental
Materials
MIL-53(Al) was synthesized using aluminum(III) nitrate nonahydrate (Al(NO3)3·9H2O), terephthalic acid (H2BDC), and N,N-dimethylformamide (DMF). 99% sulfuric acid (H2SO4), graphite, potassium permanganate (KMnO4) and 30% hydrogen peroxide (H2O2) were used to prepare GO. All chemicals were purchased from Sigma-Aldrich (St Louis, MO), including lead nitrate (Pb(NO3)2) which was used to prepare the standard Pb(II) solution. All reagents and solvents were of analytical grade and used as received.Synthesis of GO-MIL-53(Al) nanocomposites with different GO contents
MIL-53(Al) and GO were prepared by hydrothermal and modified Hummers’ methods, respectively, as described in our previous work.28 The same hydrothermal procedure was adopted to synthesize the GO-MIL-53(Al) nanocomposite. A certain amount of GO powder was dispersed into 30 mL DMF solution along with Al(NO3)3·9H2O and H2BDC, followed by 10 minutes sonication to obtain a homogeneous suspension before putting it in a 150 mL stainless steel autoclave with a Teflon inset at 130 °C for 72 h. The obtained ash coloured gel was separated by centrifugation (8000 rpm, 10 min) and washed three times with 30 mL methanol followed by air drying at 100 °C overnight. The powder was then again immersed in methanol (30 mL) for 24 h, washed and centrifuged three times with methanol, and finally dried overnight under vacuum at 110 °C. The GO-MIL-53(Al) nanocomposite was denoted as n% GO-MIL-53(Al), where n is the weight percentage of GO in the GO-MIL-53(Al) nanocomposite. 1%, 2%, 3%, 5%, 10%, 15% and 25% GO-MIL-53(Al) nanocomposites were synthesized.Adsorption experiments
Removal of Pb(II) heavy metal ions from aqueous solutions was investigated by batch experiments. For all the experiments, the adsorbent was heated overnight under vacuum at 110 °C to remove any moisture. Adsorption experiments were performed in test tubes containing 20![[thin space (1/6-em)]](https://www.rsc.org/images/entities/char_2009.gif) mg of adsorbent in 50
mg of adsorbent in 50![[thin space (1/6-em)]](https://www.rsc.org/images/entities/char_2009.gif) mL of Pb(II) solution (50–450 mg L−1 Pb(II) concentration). The mixtures were sonicated in a water bath sonicator (Vevor Digital Ultrasonic Cleaner, PS-40A) for 10 minutes to obtain a homogeneous solution and then transferred into 250 mL polypropylene bottles to shake in a gyratory shaker (Orbital Shaker, VWR S-500) at 298 K and 175 rpm. After 24 hours of shaking, the adsorbent was separated from the reaction mixture by centrifugation (8000 rpm, 8 min) and filtration for atomic spectroscopy (microwave induced plasma interfaced atomic emission spectrophotometer, Agilent Technologies, 4200 MP-AES) to determine the concentration of Pb(II) ions that remained in the solution. The amount of Pb(II) ions adsorbed per unit mass of GO-MIL-53(Al) nanocomposites at equilibrium is termed as the equilibrium adsorption capacity, which was calculated using eqn (1).28
mL of Pb(II) solution (50–450 mg L−1 Pb(II) concentration). The mixtures were sonicated in a water bath sonicator (Vevor Digital Ultrasonic Cleaner, PS-40A) for 10 minutes to obtain a homogeneous solution and then transferred into 250 mL polypropylene bottles to shake in a gyratory shaker (Orbital Shaker, VWR S-500) at 298 K and 175 rpm. After 24 hours of shaking, the adsorbent was separated from the reaction mixture by centrifugation (8000 rpm, 8 min) and filtration for atomic spectroscopy (microwave induced plasma interfaced atomic emission spectrophotometer, Agilent Technologies, 4200 MP-AES) to determine the concentration of Pb(II) ions that remained in the solution. The amount of Pb(II) ions adsorbed per unit mass of GO-MIL-53(Al) nanocomposites at equilibrium is termed as the equilibrium adsorption capacity, which was calculated using eqn (1).28 | (1) |
 | (2) |
Results and discussion
Characterization
Characterization of GO, MIL-53(Al) and GO-MIL-53(Al) nanocomposites was discussed in detail in our previous work.28 The characteristic peaks in X-ray diffraction (XRD) and FTIR spectra confirmed their crystal structures and functional groups, and the scanning electron micrograph (SEM) images showed a sphere-shaped homogeneous assembly of GO-MIL-53(Al) particles. Surface areas of MIL-53(Al), GO, and GO-MIL-53(Al) were calculated using the Brunauer–Emmett–Teller (BET) model.28 As shown in Table 1, the BET surface area of GO-MIL-53(Al) nanocomposites increased as GO content increased due to the intersection of GO layers with MIL-53(Al) and the presence of the epoxy and hydroxyl functional groups of GO layers with MIL-53(Al). 2% GO-MIL-53(Al) showed the highest surface area, after which the surface area decreased due to the limited integration degree of MIL-53(Al) with the GO sheets.| Adsorbent | BET surface area (m2 g−1) | q e (mg g−1) |
|---|---|---|
| GO | 213 | 141.48 |
| MIL-53(Al) | 1079 | 127.61 |
| 1% GO-MIL-53(Al) | 1154 | 179.60 |
| 2% GO-MIL-53(Al) | 1273 | 183.63 |
| 3% GO-MIL-53(Al) | 1147 | 154.03 |
| 5% GO-MIL-53(Al) | 1050 | 205.45 |
| 10% GO-MIL-53(Al) | 817 | 151.37 |
| 15% GO-MIL-53(Al) | 775 | 133.13 |
| 25% GO-MIL-53(Al) | 365 | 44.76 |
Effect of GO content in GO-MIL-53(Al) composites on Pb(II) adsorption
All the as-synthesized composites (1%, 2%, 3%, 5%, 10%, 15% and 25% GO-MIL-53(Al)) were used in the adsorption experiments to investigate the effect of GO content in GO-MIL-53(Al) on Pb(II) adsorption. As illustrated in Table 1, when the GO content in GO-MIL-53(Al) was lower than 10%, the equilibrium adsorption capacity of Pb(II) ions increased with the increase in GO content. The 5% GO-MIL-53(Al) nanocomposite showed the maximum adsorption capacity, after which the adsorption capacity decreased as the GO content increased. As GO layers intersected into MIL-53(Al) cages and the epoxy and hydroxyl functional groups of GO layers were attached with MIL-53(Al), the surface area initially increased, and so did the Pb(II) adsorption capacity.29,30It is noted that all the GO-MIL-53(Al) composites exhibited a more enhanced adsorption capacity of Pb(II) than MIL-53(Al), except 25% GO-MIL-53(Al), due to its reduced surface area. Among the composites, 5% GO-MIL-53(Al) outperformed other composites, exhibiting 38% and 45% higher Pb(II) adsorption capacity than the bare MIL-53(Al) and GO, respectively. Thereby, 5% GO-MIL-53(Al) adsorbent was selected for the subsequent experiments.
Effect of pH on Pb(II) adsorption
One of the most influencing factors for heavy metal adsorption is the initial pH value of the metal solution. The effect of pH on Pb(II) adsorption by 5% GO-MIL-53(Al) is shown in Fig. 1.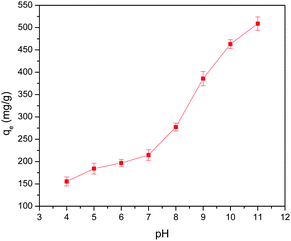 | ||
| Fig. 1 Effect of pH on Pb(II) adsorption by 5% GO-MIL-53(Al) nanocomposite (C0 = 150 mg L−1, M/V = 0.4 g L−1, and T = 298 K). | ||
The amount of Pb(II) adsorbed on 5% GO-MIL-53(Al) increased with increasing pH value. As reported in our previous work, the surface charge of the 5% GO-MIL-53(Al) nanocomposite is always positive in the pH range of 4 to 11, and it increases with decreasing pH.28 The highly positively charged surface of the 5% GO-MIL-53(Al) composite in the low pH range repulsed the cationic Pb(II) ions, and the electrostatic repulsion between Pb(II) ions and the GO-MIL-53(Al) surface increased with decreasing pH value, resulting in a decrease in Pb(II) adsorption.31,32
Effect of initial Pb(II) ion concentration on Pb(II) adsorption
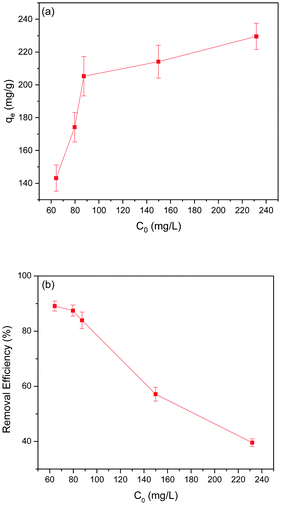
Adsorption experiments were carried out to examine the effect of initial Pb(II) ion concentration (50–250 mg L−1) on Pb(II) adsorption in the 5% GO-MIL-53(Al) nanocomposite. As shown in Fig. 2(a), Pb(II) adsorption increased as the initial Pb(II) concentration increased. Beyond 90 mg L−1, a fairly stable equilibrium adsorption capacity of Pb(II) adsorption was recorded. An increase in Pb(II) concentration facilitates mass transfer and increases the driving force for Pb(II) adsorption owing to the increased concentration differential. Above the Pb(II) concentration of 90 mg L−1, the active sites required for Pb(II) adsorption fall short, thereby causing a steady adsorption capacity.33Conversely, the removal efficiency of Pb(II) ions decreased with increase in the initial concentration of Pb(II) ions as presented in Fig. 2(b). All adsorbents have a fixed number of active sites which tend to be filled by adsorbate ions. At higher concentrations of adsorbate, the active sites of adsorbent are prone to becoming saturated. Increasing Pb(II) concentration caused saturation of the active sites in 5% GO-MIL-53(Al), which eventually decreased Pb(II) removal efficiency.34
Effect of adsorbent dosage on Pb(II) adsorption
The effect of the dosage (0.4 to 2.4 g L−1) of 5% GO-MIL-53(Al) on the equilibrium adsorption capacity of Pb(II) ions is presented in Fig. 3(a), where a decrease in the adsorption capacity was noted with increasing adsorbent dosage. Since equilibrium adsorption capacity is normalized by adsorbent mass (mg g−1 units), the increase in the mass of adsorbent dosage did not correspond to a proportional increase in adsorbed mass. Another contributing factor could be the aggregation of the GO-MIL-53(Al) composite at high dosage causing the reduction in surface area available for metal ion adsorption.34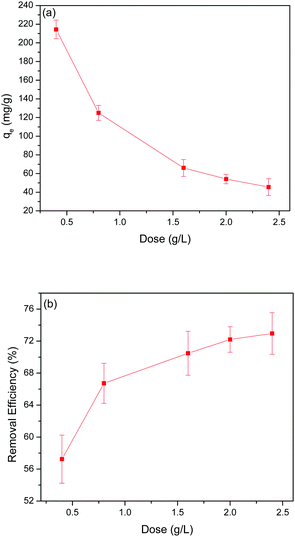 | ||
| Fig. 3 The effect of 5% GO-MIL-53(Al) dosage on (a) equilibrium adsorption capacity and (b) removal efficiency of Pb(II) ions (C0 = 150 mg L−1 and T = 298 K). | ||
In contrast, the Pb(II) removal efficiency increased with an increase in the adsorbent dosage, as shown in Fig. 3(b). This increase in removal efficiency may be due to the increased active sites at a higher dosage of 5% GO-MIL-53(Al) for Pb(II) adsorption. No significant change in removal efficiency was detected beyond an adsorbent dosage of 2 g L−1, which indicated that the adsorbent had reached its maximum capacity in the given conditions. From this point, both the amount of Pb(II) ions adsorbed by the adsorbent and the amount of free Pb(II) ions in the solution remained constant even after further increase in the dosage of adsorbent, indicating that other factors beyond the adsorbent/adsorbate ratio controlled the adsorption process.35
Adsorption kinetics
20 g of adsorbent was added to 50 mL of Pb(II) solution with a Pb(II) concentration of 150 mg L−1 to test the kinetics of Pb(II) adsorption. The supernatant was collected at different time intervals to measure the qt as a function of reaction time until reaching equilibrium. The adsorption rapidly increased in the first 15 min, after which adsorption slowly approached towards equilibrium (Fig. 4(a)). All the GO-MIL-53(Al) composites showed similar Pb(II) adsorption trends with reaction time.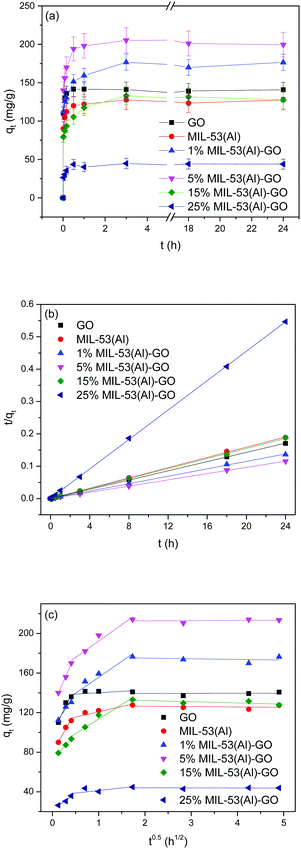 | ||
| Fig. 4 (a) Kinetic data for Pb(II) adsorption, (b) pseudo-second-order plots, and (c) intra-particle diffusion for Pb(II) adsorption. | ||
Pseudo-first-order and second-order models were used to explain the kinetics of Pb(II) adsorption using eqn (3) and (4).36
 | (3) |
 | (4) |
The pseudo-first-order and pseudo-second-order kinetic parameters of Pb(II) adsorption are summarized in Table 2. From the data, it is evident that the pseudo-second-order model better describes the kinetics as the correlation coefficient (R2) of the pseudo-second-order were much higher than that of the pseudo-first-order model. The calculated values (qe,cal) and experimental values (qe,exp) of the equilibrium adsorption capacity of Pb(II) ions in the pseudo-second-order kinetic model were also very close (maximum deviation was ±3%). Moreover, the trend lines of the pseudo-second-order were perfectly fitted (R2 = 0.999) for all the adsorbents as shown in Fig. 4(b).
| Kinetics | Parameters | GO | MIL-53(Al) | 1% GO-MIL-53(Al) | 5% GO-MIL-53(Al) | 15% GO-MIL-53(Al) | 25% GO-MIL-53(Al) |
|---|---|---|---|---|---|---|---|
| Pseudo-first-order | q e,exp (mg g−1) | 141.48 | 127.61 | 179.60 | 205.45 | 133.13 | 44.76 |
| k 1 (h−1) | 0.12 | 0.18 | 0.20 | 0.14 | 0.13 | 0.12 | |
| q e,cal (mg g−1) | 12.43 | 21.33 | 47.94 | 49.89 | 36.23 | 8.76 | |
| R 2 | 0.254 | 0.641 | 0.751 | 0.712 | 0.568 | 0.469 | |
| Pseudo-second-order | k 2 (g mg−1 h−1) | 0.39 | 0.28 | 0.11 | 0.32 | 0.45 | 0.67 |
| q e,cal (mg g−1) | 140.25 | 126.10 | 174.52 | 200.40 | 129.98 | 43.99 | |
| R 2 | 0.999 | 0.999 | 0.999 | 0.999 | 0.998 | 0.999 | |
| Intra-particle diffusion | K 1d (mg (g−1 h−1/2) | 94.89 | 79.64 | 66.03 | 107.08 | 51.15 | 33.71 |
| C 1 | 99.20 | 80.41 | 104.75 | 125.81 | 72.62 | 21.60 | |
| (R1)2 | 0.906 | 0.969 | 0.929 | 0.996 | 0.999 | 0.953 | |
| K 2d (mg (g−1 h−1/2) | 2.77 | 10.73 | 32.35 | 33.13 | 29.41 | 5.24 | |
| C 2 | 137.33 | 110.08 | 123.35 | 159.17 | 84.12 | 36.06 | |
| (R2)2 | 0.017 | 0.832 | 0.884 | 0.938 | 0.952 | 0.326 | |
| K 3d (mg (g−1 h−1/2) | 0.09 | −0.35 | −0.65 | 0.20 | 134.72 | 44.29 | |
| C 3 | 139.23 | 127.14 | 176.39 | 212.34 | −1.24 | −0.11 | |
| (R3)2 | 0.005 | 0.063 | 0.088 | 0.026 | 0.531 | 0.004 | |
The intra-particle diffusion model was tested using eqn (5) to better understand the diffusion rate controlling process in Pb(II) adsorption, where, i is the number of piecewise linearity, kid is the intra-particle diffusion rate constant (mg (g−1 h−1/2)), and Ci is the intercept related to the boundary layer thickness.36 The adsorption process will be dominated by intra-particle diffusion (i = 1 and C = 0) if there is one good linear fit in the adsorption data. Otherwise, the larger the intercept, the greater the degree of film diffusion adsorption involved in rate controlling.37
 | (5) |
From Fig. 4(c), it is clear that the entire Pb(II) adsorption process had three linear sections. This suggests that the adsorption here was a three-step process. Piecewise fitting parameters of the intra-particle diffusion model are listed in Table 2. Comparing the values of correlation coefficients, (R1)2, (R2)2 and (R3)2, it is evident that the intra-particle diffusion was not the only rate controlling step. At the beginning of adsorption (the first segment in Fig. 4(c)), the intra-particle diffusion controlled the movement of Pb(II) ions from the solution to the external surface of the 5% GO-MIL-53(Al) composite. Subsequently in the second part (the second slope section in Fig. 4(c)), film diffusion controlled the transfer of Pb(II) ions from the surface of the 5% GO-MIL-53(Al) into the pores of the adsorbent. The third slope indicated that the adsorption reached equilibrium and the Pb(II) transport was dominated by film diffusion.37
Adsorption isotherms and thermodynamics
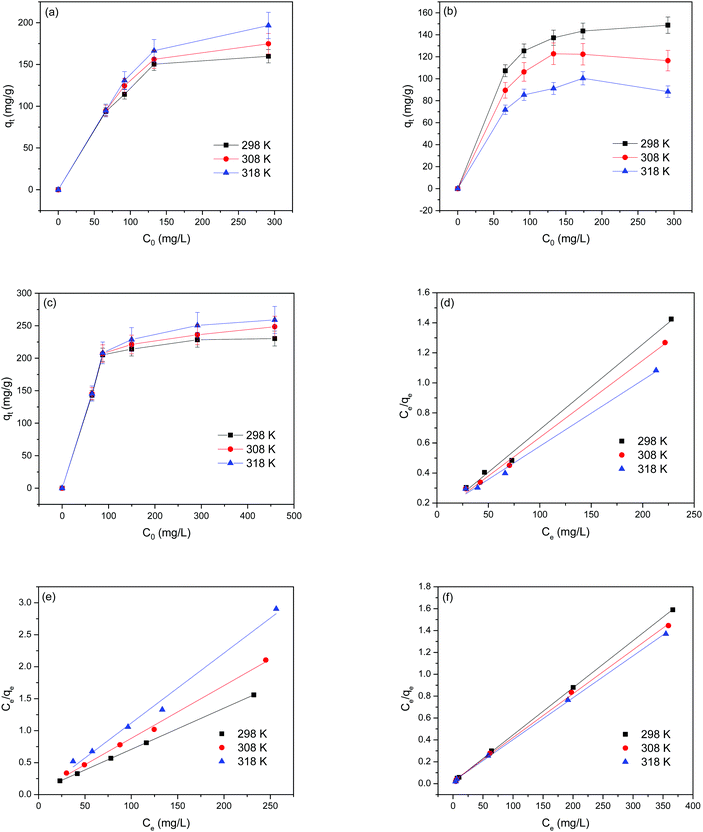
To explore the adsorption isotherms of GO, MIL-53(Al) and GO-MIL-53(Al) nanocomposites, adsorption experiments were carried out under different temperatures with various initial Pb(II) concentrations (50–450 mg L−1) as shown in Fig. 5(a–c). Langmuir and Freundlich isotherm models were used to fit the adsorption data using eqn (6) and (7), respectively.30 | (6) |
 | (7) |
Table 3 summarizes the isotherm parameters of the Langmuir and Freundlich models for Pb(II) adsorption. The values of R2 of the Langmuir model were higher than that of the Freundlich model, from which it is concluded that the Langmuir model is a better fit for the adsorption of Pb(II) ions. This indicates that Pb(II) adsorption is dominated by monolayer adsorption on a homogenous surface of the adsorbent. The linear relation between Ce/qe and Ce of the Langmuir model is plotted in Fig. 5(d–f). The maximum adsorption capacity (qmax) of the 5% GO-MIL-53(Al) composite was 232 mg g−1 at 298 K, higher than that of the bare MIL-53(Al) and GO (156 and 179 mg g−1, respectively). A list of other nanoadsorbents for Pb(II) adsorption and their adsorption capacities is shown in Table 4. In previously reported work,38–45 a high adsorption capacity came at the cost of higher adsorption time or adsorbent concentration. In this work, the adsorbent GO-MIL-53(Al) has high adsorption performance as well as short adsorption time. Moreover, synthesis of the GO-MIL-53(Al) nanocomposites was easier, making the adsorption process less complex.
| Adsorbent | Temperature (K) | Langmuir | Freundlich | |||||
|---|---|---|---|---|---|---|---|---|
| q max (mg g−1) | K L (L mg−1) | R L | R 2 | 1/n | K F ((mg g−1) (L mg−1)1/n) | R 2 | ||
| GO | 298 | 178.57 | 0.05 | 0.18 | 0.993 | 0.25 | 43.82 | 0.710 |
| 308 | 196.08 | 0.04 | 0.21 | 0.995 | 0.28 | 41.68 | 0.742 | |
| 318 | 227.27 | 0.03 | 0.27 | 0.992 | 0.33 | 36.96 | 0.752 | |
| MIL-53(Al) | 298 | 156.25 | 0.10 | 0.09 | 0.999 | 0.14 | 72.24 | 0.887 |
| 308 | 121.95 | 0.15 | 0.07 | 0.996 | 0.13 | 62.17 | 0.634 | |
| 318 | 91.74 | 0.44 | 0.02 | 0.986 | 0.11 | 51.93 | 0.305 | |
| 5% GO-MIL-53(Al) | 298 | 232.02 | 0.29 | 0.04 | 0.999 | 0.12 | 116.74 | 0.878 |
| 308 | 249.37 | 0.20 | 0.05 | 0.998 | 0.13 | 119.10 | 0.925 | |
| 318 | 261.10 | 0.20 | 0.05 | 0.999 | 0.14 | 116.74 | 0.919 | |
| Adsorbent | Heavy metal conc. (mg L−1) | Adsorbent conc. (mg L−1) | Adsorption time (min) | q max (mg g−1) | Ref. |
|---|---|---|---|---|---|
| SGO | 1–30 | 40 | 200 | 415 | 38 |
| MnO2/PDA/PAN | 20–500 | 100 | 1152 | 185 | 39 |
| UiO-66-NHC(S)NHMe | 100 | 1000 | 240 | 232 | 40 |
| Fe3O4–dithizone/Cu3(BTC)2 | 1–100 | 750 | 20 | 213 | 41 |
| Fe3O4–dipyridylamine/MIL-101(Fe) | 0.5–5 | 250 | 20 | 201 | 42 |
| Sulfonated polystyrene | 10–100 | 5 | 5 | 83.6 | 43 |
| Fe3O4–pyridine/Cu3(BTC)2 | 1–100 | 1000 | 30 | 198 | 44 |
| [Ag12 (MA)8(mal)6·18H2O]n | 2–15 | — | — | 120 | 45 |
| MIL-101(Fe)/GO | 10–400 | 1000 | 15 | 127 | 27 |
| 5% GO-MIL-53(Al) | 50–450 | 400 | 30 | 232 | This work |
Separation factor (RL) was also calculated using eqn (8) to gain insight into the essential feature of the Langmuir isotherm, where, KL (L mg−1) is the Langmuir constant and C0 (mg L−1) is the initial concentration of Pb(II) ions.30 The favorability of the Langmuir isotherm can be evaluated by the value of RL. RL![[thin space (1/6-em)]](https://www.rsc.org/images/entities/char_2009.gif) >
> ![[thin space (1/6-em)]](https://www.rsc.org/images/entities/char_2009.gif) 1, RL
1, RL![[thin space (1/6-em)]](https://www.rsc.org/images/entities/char_2009.gif) = 1, 0
= 1, 0![[thin space (1/6-em)]](https://www.rsc.org/images/entities/char_2009.gif) <
< ![[thin space (1/6-em)]](https://www.rsc.org/images/entities/char_2009.gif) RL
RL![[thin space (1/6-em)]](https://www.rsc.org/images/entities/char_2009.gif) <
< ![[thin space (1/6-em)]](https://www.rsc.org/images/entities/char_2009.gif) 1, and RL
1, and RL![[thin space (1/6-em)]](https://www.rsc.org/images/entities/char_2009.gif) =
= ![[thin space (1/6-em)]](https://www.rsc.org/images/entities/char_2009.gif) 0 indicate that the Langmuir isotherm is unfavorable, linear, favorable, and irreversible, respectively. The calculated RL values for GO, MIL-53(Al) and 5% GO-MIL-53(Al) ranged between 0 to 1 as illustrated in Table 3, indicating ‘favorable’ Langmuir isotherm adsorption. The lowest RL values were recorded for 5% GO-MIL-53(Al), indicating a more favorable adsorption process for Pb(II) adsorption onto the 5% GO-MIL-53(Al) composite.
0 indicate that the Langmuir isotherm is unfavorable, linear, favorable, and irreversible, respectively. The calculated RL values for GO, MIL-53(Al) and 5% GO-MIL-53(Al) ranged between 0 to 1 as illustrated in Table 3, indicating ‘favorable’ Langmuir isotherm adsorption. The lowest RL values were recorded for 5% GO-MIL-53(Al), indicating a more favorable adsorption process for Pb(II) adsorption onto the 5% GO-MIL-53(Al) composite.
 | (8) |
Thermodynamic parameters including Gibbs free energy change (ΔG0), enthalpy (ΔH0) and entropy (ΔS0) were evaluated for the Pb(II) adsorption process from eqn (9) and (10).46,47
 | (9) |
 | (10) |
The negative values of ΔG0 indicated that the adsorption of Pb(II) ions was spontaneous within the temperature range (298 to 318 K) as listed in Table 5. The positive value of ΔH0 suggested that Pb(II) adsorption on 5% GO-MIL-53(Al) and GO was endothermic in nature, whereas the negative value of ΔH0 indicated that Pb(II) adsorption on MIL-53(Al) was exothermic. This was in agreement with the result of temperature effects. The positive value of ΔS0 meant that the order at the solid/solution interface for GO-MIL-53(Al) and GO during the Pb(II) adsorption process was decreased.48
| Adsorbent | T (K) | K 0 | ΔG0 (kJ mol−1) | ΔS0 (J K−1 mol−1) | ΔH0 (kJ mol−1) | R 2 |
|---|---|---|---|---|---|---|
| GO | 298 | 2.47 | −2.24 | 46.0 | 11.44 | 0.980 |
| 308 | 2.96 | −2.78 | ||||
| 318 | 3.31 | −3.16 | ||||
| MIL-53(Al) | 298 | 3.00 | −3.35 | −115.5 | −37.69 | 0.970 |
| 308 | 2.14 | −1.95 | ||||
| 318 | 1.48 | −1.04 | ||||
| 5% GO-MIL-53(Al) | 298 | 3.33 | −2.98 | 31.5 | 6.41 | 0.998 |
| 308 | 3.60 | −3.28 | ||||
| 318 | 3.92 | −3.61 |
Proposed mechanism of Pb(II) adsorption on GO-MIL-53(Al) nanocomposites
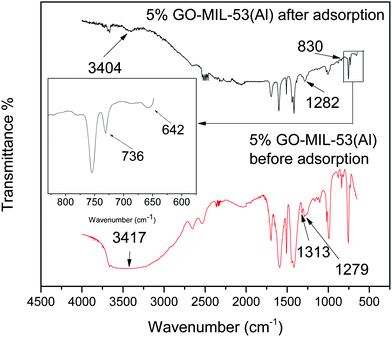
From the zeta potential data as reported in our previous work,28 it can be inferred that electrostatic attraction was not the dominant factor in adsorption here since both the adsorbent and adsorbate were positively charged after dissolving in water. To explore the possible adsorption mechanism, FTIR spectra of the 5% GO-MIL-53(Al) nanocomposite before and after Pb(II) adsorption were studied, as shown in Fig. 6. The peak at 3417 cm−1 shifted to 3404 cm−1 after adsorption, suggesting that the hydroxyl groups were involved in the adsorption process. A broad peak was located at 1282 cm−1 after Pb(II) adsorption, which was due to the overlapping of the adjacent peaks at 1313 cm−1 and 1279 cm−1 associated with the bending vibrations of the hydroxyl group in the trans corner-sharing octahedral AlO4(OH)2 and those in hydrogen bonds with the guest molecules, respectively.49 The new peaks at 736 and 642 cm−1, appearing in the spectrum of 5% GO-MIL-53(Al) after adsorption, were associated with the Pb(OH)2 bending vibration and PbO stretch, respectively.50 This indicated that Pb(II) ions may be transformed into hydroxides and oxides after adsorption by interaction with the oxygen and hydroxyl groups in the GO-MIL-53(Al) nanocomposite.27 The absence of a clear Pb(II)–O band at about 830 cm−1 was caused by the predominance of other intense peaks.51Pb(II) removal from natural water samples
To test the efficiency of Pb(II) adsorption on the 5% GO-MIL-53(Al) nanocomposite in practical application, adsorption experiments were carried out using three real-world water samples from the Chena river (Fairbanks, Alaska), tap water (Duckering building at UAF) supplied by Golden Heart Water Utility in Fairbanks, and snow melted water from University of Alaska Fairbanks (UAF) campus. All the water samples were filtered with microporous (4–7 μm) filter paper and 150 mg L−1 Pb(II) solutions were prepared from them. The rest of the procedures remained the same as the adsorption tests at room temperature. As shown in Table 6, it is clear that the GO-MIL-53(Al) composite performed consistently in Pb(II) adsorption in all the real-world water samples. The equilibrium adsorption capacity was maximum in tap water (217 mg g−1) and minimum in snow melted water (173 mg g−1).| Stock solution | q e (mg g−1) |
|---|---|
| DI water | 205.45 |
| Chena river water | 207.08 |
| Tap water | 217.10 |
| Snow melted water | 173.48 |
Conclusions
GO-MIL-53(Al) nanocomposites were synthesized using a one-step hydrothermal method. The surface area of the GO-MIL-53(Al) nanocomposites increased up to 500% and 18% compared to pristine GO and MIL-53(Al), respectively. 5% GO-MIL-53(Al) showed the maximum Pb(II) adsorption capacity (232 mg g−1 at room temperature), which was 49% and 30% higher than that of GO and MIL-53(Al), respectively. The effect of GO content in the GO-MIL-53(Al) nanocomposite, solution pH, metal ion concentration, as well as the dosage of adsorbent on Pb(II) adsorption were investigated. GO-MIL-53(Al) nanocomposites showed fast adsorption rates for Pb(II) adsorption; the equilibrium adsorption time was less than 30 min. Adsorption kinetics and isotherm studies illustrated that Pb(II) adsorption followed the pseudo-second-order model (R2 = 0.999) and Langmuir isotherm model (R2 = 0.998), respectively. FTIR data before and after Pb(II) adsorption demonstrated that Pb(II) ions may be transformed into hydroxides and oxides after adsorption. The Pb(II) adsorption capacity of 5% GO-MIL-53(Al) nanocomposite remained stable in different real water samples, demonstrating the promise of its application.In future, investigating the application of the MOF nanocomposite developed here in more complex matrices (e.g., dye industry or mining wastewater) under multi-adsorbate removal scenarios, as well as in continuous-flow column reactors would be useful toward moving the technology closer to application and wider adoption.
Conflicts of interest
There are no conflicts to declare.Acknowledgements
We thank the U.S. Geological Survey National Institutes for Water Resources (USGS NIWR) for financial support, Grant Number: G00010680. The authors gratefully acknowledge use of the UAF-AIL electron microprobe acquired with support from the National Science Foundation, Major Research Instrumentation Program Award Number 1126898. Authors also thank the Chemistry Department, Geology Department and WERC Lab at UAF for their instrumental support.References
- N. K. Srivastava and C. B. Majumder, J. Hazard. Mater., 2008, 151, 1–8 CrossRef CAS PubMed.
- G. S. Gunatilake, Journal of Multidisciplinary Engineering Science Studies, 2015, 1 Search PubMed.
- N. A. Khan, Z. Hasan and S. H. Jhung, J. Hazard. Mater., 2013, 244, 444–456 CrossRef PubMed.
- M. A. Barakat, Arabian J. Chem., 2011, 4, 361–377 CrossRef CAS.
- F. L. Fu and Q. Wang, J. Environ. Manage., 2011, 92, 407–418 CrossRef CAS PubMed.
- T. Chowdhury, MS thesis, University of Alaska Fairbanks, 2017.
- M. Naushad, Chem. Eng. J., 2014, 235, 100–108 CrossRef CAS.
- M. Naushad, Z. A. Alothman, M. R. Awual, M. M. Alam and G. E. Eldesoky, Ionics, 2015, 21, 2237–2245 CrossRef CAS.
- A. A. Baba and F. A. Adekola, J. King Saud Univ., Sci., 2013, 25, 297–305 CrossRef.
- M. Naushad and Z. A. Alothman, Desalin. Water Treat., 2015, 53, 2158–2166 CrossRef CAS.
- S. P. T. Fong, M. Pang, T. T. Teng and A. K. M. Omar, Water Qual. Res. J. Can., 2009, 44, 174–182 CrossRef.
- A. A. H. Faisal, S. F. A. Al-Wakel, H. A. Assi, L. A. Naji and M. Naushad, Journal of Water Process Engineering, 2020, 33, 101112 CrossRef.
- M. F. Abid, M. A. Zablouk and A. M. Abid-Alameer, Iran. J. Environ. Health Sci. Eng., 2012, 9, 17 CrossRef PubMed.
- R. Liang, F. Jing, L. Shen, N. Qin and L. Wu, J. Hazard. Mater., 2015, 287, 364–372 CrossRef CAS PubMed.
- R. Fazaeli, H. Aliyan and R. S. Banavandi, Russ. J. Appl. Chem., 2015, 88, 169–177 CrossRef CAS.
- G. Crini, Bioresour. Technol., 2006, 97, 1061–1085 CrossRef CAS PubMed.
- V. V. Butova, M. A. Soldatov, A. A. Guda, K. A. Lomachenko and C. Lamberti, Russ. Chem. Rev., 2016, 85, 280 CrossRef CAS.
- Y. H. Hu and L. Zhang, Adv. Mater., 2010, 22, E117–E130 CrossRef CAS PubMed.
- J. Liu, T.-Y. Bao, X.-Y. Yang, P.-P. Zhu, L.-H. Wu, J.-Q. Sha, L. Zhang, L.-Z. Dong, X.-L. Cao and Y.-Q. Lan, Chem. Commun., 2017, 53, 7804–7807 RSC.
- Y. Li, Y. Xu, W. Yang, W. Shen, H. Xue and H. Pang, Small, 2018, 14, 1704435 CrossRef PubMed.
- N. A. Khan, Z. Hasan and S. H. Jhung, J. Hazard. Mater., 2013, 244–245, 444–456 CrossRef CAS PubMed.
- A. Abbasi, T. Moradpour and K. Van Hecke, Inorg. Chim. Acta, 2015, 430, 261–267 CrossRef CAS.
- Y. Cao and X. Li, Adsorption, 2014, 20, 713–727 CrossRef CAS.
- H. Li, X. Cao, C. Zhang, Q. Yu, Z. Zhao, X. Niu, X. Sun, Y. Liu, L. Ma and Z. Li, RSC Adv., 2017, 7, 16273–16281 RSC.
- X. Lian and B. Yan, RSC Adv., 2016, 6, 11570–11576 RSC.
- I. Ahmed, N. A. Khan, Z. Hasan and S. H. Jhung, J. Hazard. Mater., 2013, 250–251, 37–44 CrossRef CAS PubMed.
- M. Lu, L. Li, S. Shen, D. Chen and W. Han, New J. Chem., 2019, 43, 1032–1037 RSC.
- T. Chowdhury, L. Zhang, J. Zhang and S. Aggarwal, Nanomaterials, 2018, 8, 1062 CrossRef PubMed.
- I. Ahmed and S. H. Jhung, J. Hazard. Mater., 2016, 314, 318–325 CrossRef CAS PubMed.
- X. Y. Z. Wu, H. Zhong, H. Wang, G. Zeng, X. Chen, H. Wang, L. Zhang and J. Shao, Sci. Rep., 2016, 6, 1–13 CrossRef PubMed.
- H. Lalhruaitluanga, K. Jayaram, M. N. V. Prasad and K. K. Kumar, J. Hazard. Mater., 2010, 175, 311–318 CrossRef CAS PubMed.
- S. K. Yadav, D. K. Singh and S. Sinha, Desalin. Water Treat., 2013, 51, 6798–6807 CrossRef CAS.
- D. Pathania, S. Sharma and P. Singh, Arabian J. Chem., 2017, 10(Suppl. 1), S1445–S1451 CrossRef CAS.
- F. A. Dawodu and K. G. Akpomie, J. Mater. Res. Technol., 2014, 3, 129–141 CrossRef CAS.
- D. K. V. Ramana, D. H. K. Reddy, B. N. Kumar, Y. Harinath and K. Seshaiah, Can. J. Chem. Eng., 2012, 90, 111–119 CrossRef CAS.
- M. T. Yagub, T. K. Sen, S. Afroze and H. M. Ang, Adv. Colloid Interface Sci., 2014, 209, 172–184 CrossRef CAS PubMed.
- S. Dawood and T. K. Sen, Water Res., 2012, 46, 1933–1946 CrossRef CAS PubMed.
- M. P. Wei, H. Chai, Y. L. Cao and D. Z. Jia, J. Colloid Interface Sci., 2018, 524, 297–305 CrossRef CAS PubMed.
- Y. Li, R. Zhao, S. Chao, B. Sun, C. Wang and X. Li, Chem. Eng. J., 2018, 344, 277–289 CrossRef CAS.
- H. Saleem, U. Rafique and R. P. Davies, Microporous Mesoporous Mater., 2016, 221, 238–244 CrossRef CAS.
- M. Taghizadeh, A. A. Asgharinezhad, M. Pooladi, M. Barzin, A. Abbaszadeh and A. Tadjarodi, Microchim. Acta, 2013, 180, 1073–1084 CrossRef CAS.
- M. Babazadeh, R. H. Khanmiri, J. Abolhasani, E. Ghorbani-Kalhor and A. Hassanpour, Bull. Chem. Soc. Jpn., 2015, 88, 871–879 CrossRef CAS.
- B. Gong, Y. Peng, Z. Pan, W. Chen, Y. Shen, K. Xiao and L. Zhang, Chem. Commun., 2017, 53, 12766–12769 RSC.
- M. R. Sohrabi, Z. Matbouie, A. A. Asgharinezhad and A. Dehghani, Microchim. Acta, 2013, 180, 589–597 CrossRef CAS.
- M. Salarian, A. Ghanbarpour, M. Behbahani, S. Bagheri and A. Bagheri, Microchim. Acta, 2014, 181, 999–1007 CrossRef CAS.
- G. Z. Kyzas, E. A. Deliyanni and K. A. Matis, J. Chem. Technol. Biotechnol., 2014, 89, 196–205 CrossRef CAS.
- L. You, Z. Wu, T. Kim and K. Lee, J. Colloid Interface Sci., 2006, 300, 526–535 CrossRef CAS PubMed.
- L. Leng, X. Yuan, H. Huang, J. Shao, H. Wang, X. Chen and G. Zeng, Appl. Surf. Sci., 2015, 346, 223–231 CrossRef CAS.
- C. Volkringer, T. Loiseau, N. Guillou, G. Ferey, E. Elkaim and A. Vimont, Dalton Trans., 2009, 2241–2249, 10.1039/B817563B.
- X. Wang and L. Andrews, J. Phys. Chem. A, 2005, 109, 9013–9020 CrossRef CAS PubMed.
- J. Li, Y.-N. Wu, Z. Li, M. Zhu and F. Li, Water Sci. Technol., 2014, 70, 1391 CrossRef CAS PubMed.
| This journal is © The Royal Society of Chemistry 2021 |

