 Open Access Article
Sustainable glycerol carbonate electrolytes for Li-ion supercapacitors: performance evaluation of butyl, benzyl, and ethyl glycerol carbonates†
Maryam
Salari
 a,
Jennifer Chapman
Varela
 a,
Heng
Zhang
a and
Mark W.
Grinstaff
 *ab
*ab
aDepartment of Chemistry, Boston University, 590 Commonwealth Avenue, Boston, MA 02215, USA. E-mail: mgrin@bu.edu
bDepartment of Biomedical Engineering, Boston University, 590 Commonwealth Ave, Boston, MA 02215, USA
First published on 11th August 2021
Abstract
Substitution of flammable, toxic solvents in electrolytes with alternative green options is of significant commercial and environmental interest. Here, we report the synthesis and physicochemical properties of glycerol carbonate (GlyC) based solvents as electrochemically stable electrolytes for lithium ion supercapacitors. Glycerol carbonates with pendent butyl, benzyl, and ethyl side chains are all thermally stable and exhibit compositional dependent properties. Of the three glycerol-based electrolytes, the butyl and ethyl GlyC analogs exhibit the highest conductivity and discharge capacitance at room and elevated temperatures. The new electrolytes allow for safe operation of a Li-ion supercapacitor at room temperature and 100 °C, with specific capacitances between 115 and 162 F g−1, and good electrochemical performance at 100 °C.
Introduction
Electrical energy storage (EES) systems are critical to a sustainable energy solution and include devices such as lithium ion batteries (LIBs) and supercapacitors (ECs). Due to the demand for both energy and power, a new EES device that combines the charging mechanisms of LIBs and ECs is emerging: lithium-ion supercapacitors (LICs).1,2 An essential component of sustainable energy is expanding the use of EES devices beyond 35 °C, as such, significant research efforts are dedicated to investigating key device components, such as the electrodes, separator, and electrolyte, to identify thermally stable materials for new high temperature stable EES devices.3–8 Our interest is in thermally stable electrolytes and, specifically, electrolytes that are also ecologically sustainable.In commercial devices, an organic solvent, such as acetonitrile (ACN), containing a lithium salt is the most common electrolyte due to their rapid ion transport and high conductivity (tens of mS cm−1).1,9–11 However, the major limitations of these electrolytes are their high volatility, flammability (due to the very low flash point of ACN (∼5 °C)), and toxicity. These limitations carry significant health and environmental risks and render them impractical for high temperature applications. To address the limitations of ACN, cyclic organic solvents such as propylene carbonate, linear ethylene carbonate, or dimethyl carbonate solvents, are utilized: but poor ion ordering and solvent degradation at elevated temperatures are substantial obstacles.12,13
As an alternative to these solvents, we are designing, synthesizing, and evaluating sustainable and environmentally friendly organic carbonate electrolytes based on glycerol. Fig. 1 shows the molecular structures of the glycerol carbonates with an ethyl, benzyl, or butyl side chain (i.e., 3-ethoxy-1,2-propylene carbonate, 3-benzyloxy-1,2-propylene carbonate, and 3-butoxy-1,2-propylene carbonate) compared to conventional cyclic carbonates ethylene carbonate (EC) and dimethyl carbonate (DMC). The building blocks and the degradation products for two of the glycerol carbonates are glycerol, CO2, and ethanol or butanol, which are natural, benign, and recyclable compounds. Moreover, the building blocks can be produced commercially from non-petroleum sources, making the glycerol compounds, from synthesis to degradation, environmentally sustainable. The third glycerol carbonate electrolyte, included for comparison, contains a benzyl group and is not as sustainable due to the benzyl group. Herein, we report the synthesis and characterization of three glycerol-based carbonate solvents possessing different pendant chains: ethyl, benzyl, and butyl (Fig. 1). Additionally, we describe the influence of the pendant chain composition on thermal stability, viscosity, and conductivity as a function of temperature. The performance of LICs equipped with the three glycerol-based carbonates and 1.0 M LiTFSI electrolyte is also reported at 20 °C and 100 °C.
Experimental procedures
Synthesis of glycerol carbonates
Benzyl glycidyl ether (5.0 mL, 32.9 mmol) was added into a pre-dried 50 mL round bottomed flask. Triphenylphosphine (1.29 g, 4.93 mmol, 0.15 eq.) and InBr3 (1.75 g, 4.93 mmol, 0.15 eq.) were added, and the mixture was stirred until all the InBr3 dissolved, and the liquid became homogenous. A balloon charged with CO2 with a long needle was punched into the rubber septum and the tip of the needle submerged in the reaction mixture. The reaction was left to stir for 24 hours, and then quenched by adding 0.5 mL of water. The mixture was separated by flash column chromatography to yield benzyl glycerol carbonate (Benzyl GlyC) (4.79 g, 70%). 1H NMR (500 MHz, CDCl3): δ 7.38–7.30 (m, 5H), 4.84–4.77 (m, 1H), 4.63–4.53 (m, 2H), 4.46 (dd, J = 8.4, 8.1 Hz, 1H), 4.36 (dd, J = 8.4, 8.4 Hz, 1H), 3.70 (dd, J = 11.1, 3.9 Hz, 1H), 3.60 (dd, J = 11.1, 3.9 Hz, 1H); 13C NMR (125 MHz, CDCl3): δ 154.9, 137.0, 128.5, 127.9, 127.6, 75.0, 73.5, 68.7, 66.2; m/z: calcd for C11H12O4![[thin space (1/6-em)]](https://www.rsc.org/images/entities/char_2009.gif) :
:![[thin space (1/6-em)]](https://www.rsc.org/images/entities/char_2009.gif) 208.0736, [M]+; found: 208.0738.
208.0736, [M]+; found: 208.0738.
Ethyl glycerol carbonate (Ethyl GlyC) was synthesized using the same procedure but with the starting material ethylglycidyl ether. 1H NMR (500 MHz, CDCl3): δ 4.84–7.76 (m, 1H), 4.49 (dd, J = 8.4, 8.1 Hz, 1H), 4.39 (dd, J = 8.4, 8.4 Hz, 1H), 3.69–3.57 (m, 2H), 3.50 (q, J = 6.6 Hz, 2H), 0.91 (dd, J = 7.5, 7.2 Hz, 3H); 13C NMR (125 MHz, CDCl3): δ 154.9, 75.1, 71.1, 69.2, 65.8, 13.3; m/z: calcd for C6H10O4: 146.0579, [M]+; found: 146.0578.
Butyl glycerol carbonate (Butyl GlyC) was synthesized using the same procedure but with the starting material butyl glycidyl ether. 1H NMR (500 MHz, CDCl3): δ 4.84–7.76 (m, 1H), 4.49 (dd, J = 8.4, 8.1 Hz, 1H), 4.39 (dd, J = 8.4, 8.4 Hz, 1H), 3.69–3.57 (m, 2H), 3.50 (t, J = 6.6 Hz, 2H), 1.65–1.50 (m, 2H), 1.35 (dt, J = 14.4, 7.2 Hz, 2H), 0.91 (dd, J = 7.5, 7.2 Hz, 3H); 13C NMR (125 MHz, CDCl3): δ 154.9, 75.1, 71.1, 69.2, 65.8, 31.0, 18.6, 13.3; m/z: calcd for C8H15O4![[thin space (1/6-em)]](https://www.rsc.org/images/entities/char_2009.gif) :
:![[thin space (1/6-em)]](https://www.rsc.org/images/entities/char_2009.gif) 175.0970, [M]+; found: 175.0968.
175.0970, [M]+; found: 175.0968.
Characterization of glycerol carbonate electrolytes
Thermal gravimetric analysis (TGA) was performed using a TGA Q50 while scanning from 20 to 500 °C at a heating rate of 20 °C min−1. Differential scanning calorimetry (DSC) was completed from −70 °C to 100 °C at a heating rate of 10 °C min−1 and cooling rate of 5 °C min−1, the third trace was analyzed. Thermal degradation was defined as three percent weight lost. The conductivity measurements were carried out with a Conductivity Meter Probe (K912, Consort) under an argon atmosphere, to prevent trace amounts of moisture. A heating block was used to homogeneously heat the sample vial from room temperature up to 105 °C. The samples were vacuum dried overnight before use. Viscosity was measured at 25 °C using an aluminum 2° cone geometry (40 mm diameter) (TA Instruments AR2000 series). Prior to testing, samples were pre-sheared for 60 sec at a shear rate of 2.5 s−1. A continuous flow shear rate sweep (1 to 100 s−1) was performed at temperatures ranging from 20–90 °C in ten degree increments and at 99.5 °C. Data acquisition intervals were logarithmic, with five even logarithmically-spaced acquisition points per decade.The electrochemical stability window was measured using a 3-electrode Split Test Cell (MTI Co.) by cyclic voltammetry at a scan rate of 20 mV s−1 and a potential window of −0.5 to 5.5 V at room temperature and 100 °C. The cell was assembled in an argon-filled glove box using a Li/Li/Pt configuration.
Supercapacitor measurements
Activated carbon (AC: Sigma Aldrich-100 mesh particle size) was used as the active material for the electrodes. Working electrodes were made following the conventional procedure; grinding 75 wt% AC, 15 wt% acetylene black and 10 wt% poly(vinylidene fluoride) (PVDF) binder in N-methyl pyrrolidinone (NMP) solvent in a mortar. Prior to assembly, AC and acetylene black were dried at 80 °C and 120 °C in a vacuum oven, respectively. The resulting slurry was subsequently deposited onto already punched and washed titanium disks (∼1.58 cm in diameter). A typical electrode had a weight of active material of 2.5 mg after drying under vacuum at 80 °C overnight. Electrochemical measurements were carried out on two identical electrodes (by weight and substrate) paired together to assemble a full device. Working electrodes were assembled into CR2032 coin cells (MTI Co.) separated by Celgard 480 membranes inside an argon-filled glove box. Lithium bis(trifluoro-methane-sulfonyl) imide (LiTFSI) was dissolved at 1.0 M in ethylene carbonate–dimethyl-carbonate (EC–DMC 1![[thin space (1/6-em)]](https://www.rsc.org/images/entities/char_2009.gif) :
:![[thin space (1/6-em)]](https://www.rsc.org/images/entities/char_2009.gif) 1 vol %), Benzyl GlyC, Ethyl GlyC, and Butyl GlyC and used as the electrolytes. Cyclic voltammetry (CV), charge–discharge (CD) and electrochemical impedance spectroscopy (EIS) measurements were performed using a Princeton Applied Research VersaStat battery tester. CV and CD tests were conducted over a voltage range of 0 to 2.5 V at various scan rates (from 1 to 1000 mV s−1) and different current densities (from 0.5 to 10 A g−1) at room temperature and 100 °C. EIS measurements were conducted over a frequency range of 10 kHz to 10 mHz under a bias potential of 0.8 V using a 5 mV rms sinusoidal modulation. All calculations were based on the total weight of active materials.
1 vol %), Benzyl GlyC, Ethyl GlyC, and Butyl GlyC and used as the electrolytes. Cyclic voltammetry (CV), charge–discharge (CD) and electrochemical impedance spectroscopy (EIS) measurements were performed using a Princeton Applied Research VersaStat battery tester. CV and CD tests were conducted over a voltage range of 0 to 2.5 V at various scan rates (from 1 to 1000 mV s−1) and different current densities (from 0.5 to 10 A g−1) at room temperature and 100 °C. EIS measurements were conducted over a frequency range of 10 kHz to 10 mHz under a bias potential of 0.8 V using a 5 mV rms sinusoidal modulation. All calculations were based on the total weight of active materials.
Results and discussion
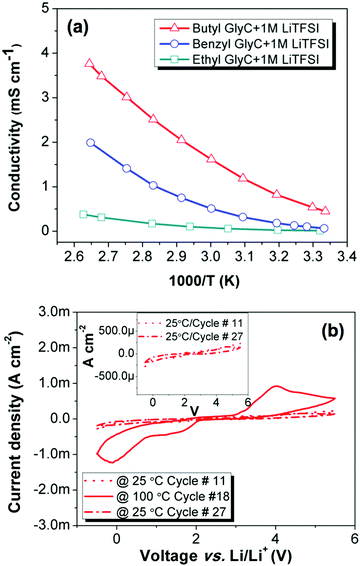
First, we measured the thermal stability of the novel glycerol carbonate using thermal gravimetric analysis (TGA) and all three glycerol carbonates are stable above 95 °C with thermal stability increasing with molecular weight; Benzyl GlyC exhibits the highest thermal stability to 190 °C while Ethyl GlyC displays the lowest thermal stability at 97 °C. Moreover, differential scanning calorimetry (DSC) of the neat glycerol carbonates found no Tm or Tc for Ethyl or Butyl GlyC from −70 to 100 °C, however, Benzyl GlyC did exhibit a Tm at −54.6 °C. We measured the viscosities of the glycerol carbonates at 25 and 100 °C. At 25 °C, Ethyl, Butyl, and Benzyl GlyC exhibit viscosities of 0.0094, 0.0096, and 0.076 Pa s, respectively. Butyl GlyC and Ethyl GlyC possess a similar viscosity value at 25 °C, while Benzyl GlyC has a slightly higher value. The increased viscosity for Benzyl GlyC is likely a result of the larger molecular weight and pi-stacking interactions present. At 100 °C the viscosities of Ethyl, Butyl, and Benzyl GlyC are 0.0014, 0.0029, and 0.0062 Pa.s, respectively. The viscosities of all three GlyCs decrease at 100 °C with the change being greatest for Butyl GlyC and Ethyl GlyC. The increase in temperature further reduces the weaker intermolecular interactions present within the Butyl GlyCs and Ethyl GlyCs affording a greater decrease in viscosity compared to the Benzyl GlyC.Next, we measured the ionic conductivity of the Ethyl, Butyl, and Benzyl GlyC solvents with 1.0 M LiTFSI as a function of temperature. As the temperature increases, the conductivity increases for all three electrolytes. Among the glycerol carbonate structures, the Butyl GlyC exhibits the highest ionic conductivity (0.45–3.76 mS cm−1) over the entire temperature range. At 25 °C, the conductivity of Butyl GlyC with 1.0 M LiTFSI is 0.5 mS cm−1 while Ethyl GlyC and Benzyl GlyC with 1.0 M LiTFSI exhibit similar values of less than 0.1 mS cm−1. At 110 °C, the conductivity value for Butyl GlyC with 1.0 M LiTFSI is ∼4 mS cm−1, and is 4× greater compared to ambient temperature, while the Ethyl and Benzyl GlyCs with 1.0 M LiTFSI are 0.2 and 2 mS cm−1, respectively (Fig. 2a).
As Butyl GlyC with 1.0 M LiTFSI possesses the highest conductivity, we performed additional characterization studies on this electrolyte. Fig. 2b displays the electrochemical stability of Butyl GlyC containing 1.0 M LiTFSI, obtained via cyclic voltammetry (CV) using a 3-electrode split cell Li/Li/Pt, as a function of temperature. No large redox reactions occur from −0.5 to 5.5 V at 25 °C and only a slight increase in the absolute current value is observed after 27 cycles, indicating the potential beginning of compound degradation. The effect is minimal. However, at 100 °C, an oxidation peak appears at 4 V indicating oxidation of the electrolyte, and at 1.5 V and 0 V in the cathodic direction two large reduction reactions are observed. At 100 °C, Butyl GlyC with 1.0 M LiTFSI exhibits a narrow electrochemical stability window. To further analyze the effects of high temperature on the electrolyte, we compared the CV curves obtained at 25 °C before and after heating at 100 °C (Fig. 2b). After heating and cycling at 100 °C and then cooling to room temperature, the electrolyte displays a similar electrochemical stability as the initial cycling. In order to extend the cycling life of the coin cells for future tests we chose a cut-off voltage of 2.5 V for further electrochemical analysis.
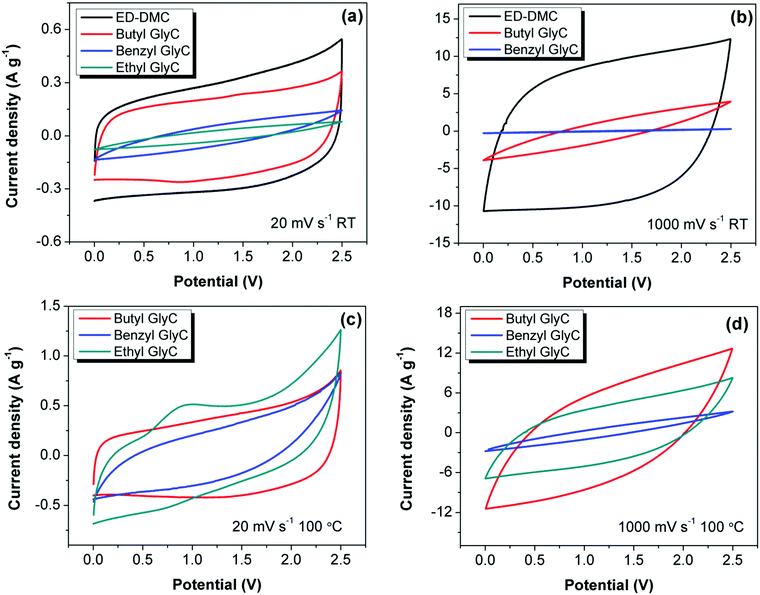
To explore the electrochemical stability of the glycerol carbonates, we prepared LIC coin cells with activated carbon-based electrodes and 1.0 M LiTFSI electrolyte solutions of Ethyl, Butyl, Benzyl GlyC and EC–DMC. CV curves of the cells at room temperature and scan rates of 20 mV s−1 and 1000 mV s−1 from 0 to 2.5 V, respectively, are shown in Fig. 3a and b. At a scan rate of 20 mV s−1, all cells are electrochemically stable but only the EC–DMC and Butyl GlyC exhibit ideal capacitive behavior. At the accelerated scan rate of 1000 mV s−1, only the cell containing Butyl GlyC affords a CV curve showing capacitive behavior; illustrating the high rate capability of Butyl GlyC at room temperature (Fig. 3b). The CV curve obtained for Ethyl GlyC is not shown as it is comparable to Benzyl GlyC.
We performed additional electrochemical experiments at higher temperatures with cells only configured with the synthesized electrolytes due to thermal stability limits of EC–DMC beyond 80 °C. The CV curve at 100 °C and a scan rate of 20 mV s−1 from 0 to 2.5 V, shows that Ethyl GlyC is not electrochemically stable with an oxidation reaction recorded at 0.75 V (Fig. 3c). The electrochemical instability of Ethyl GlyC at 100 °C originates at this slow scan rate primarily because the sample is heated at the onset of its thermal degradation temperature (95 °C). Butyl and Benzyl GlyC are thermally stable beyond this temperature, and, thus, no redox reactions are observed. At 1000 mV s−1, none of the glycerol carbonates display capacitive behavior, agreeing with our previous work that Li ion intercalation is promoted in viscous electrolytes at higher temperatures and lower scan rates, establishing a pseudocapacitance charge contribution (Fig. 3d).5,14–17
We calculated the specific capacitance of each LIC to quantify the stability and performance of the glycerol carbonate electrolytes, by integrating the area under the CV curve using the following equation:
| Cs = 2I/[(dv/dt)× m](F g−1) | (1) |
| Capacitance @ RT (F g−1) | Capacitance @ 100 °C (F g−1) | |||||
|---|---|---|---|---|---|---|
| 1 (mV s−1) | 20 (mV s−1) | 1000 (mV s−1) | 1 (mV s−1) | 20 (mV s−1) | 1000 (mV s−1) | |
| Butyl GlyC | 29 | 21 | 4 | 115 | 38 | 14 |
| Benzyl GlyC | 28 | 7.4 | 0.3 | 96 | 30 | 3 |
| Ethyl GlyC | 15 | 4.2 | 0.3 | 162 | 45 | 9 |
| EC–DMC | 51 | 29 | 17 | — | — | — |
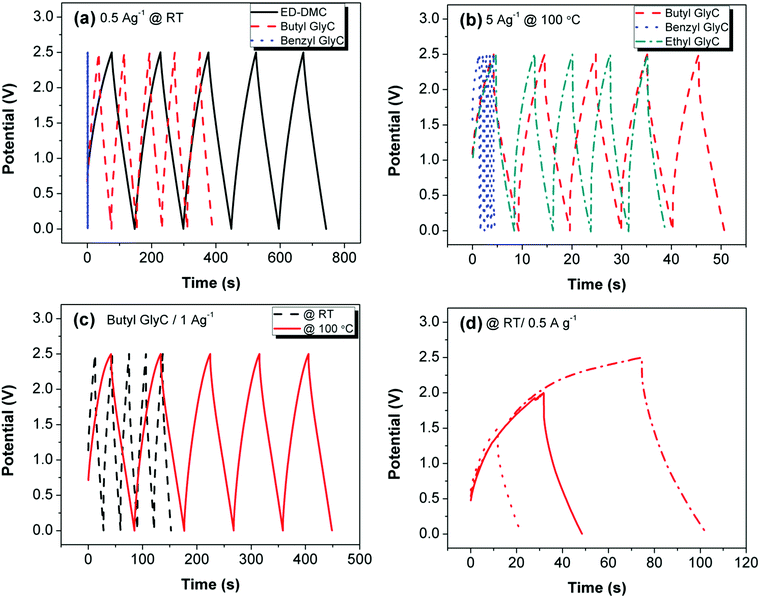
We next evaluated the LICs containing Butyl GlyC, Benzyl GlyC, Ethyl GlyC and EC–DMC with 1.0 M LiTFSI using galvanostatic charge–discharge (CD) cycling at room temperature and 100 °C with current densities of 0.5 A g−1 or 5 A g−1 (Fig. 4a–d). The CD curve obtained for Ethyl GlyC at ambient temperature is not shown as it is compared to Benzyl GlyC. The first five charge–discharge cycles of the LIC's with EC–DMC show the superior dynamic range of the standard carbonate electrolyte at 25 °C and 0.5 A g−1 current rate (Fig. 4a). At 100 °C and a current rate of 5 A g−1, the LIC with the Butyl GlyC electrolyte performs better than Benzyl GlyC and Ethyl GlyC with a long charge–discharge cycle (Fig. 4b). As the carbon chain length in the carbonate structure increases from ethyl to butyl, the LIC's capacitance improves.
The calculated specific capacitance and columbic efficiency (η) for the different LIC's equipped with the three synthesized solvents and EC–DMC with 1.0 M LiTFSI operated at various current densities and temperatures are given in Table 2. We calculated the specific capacitance of the LIC's from CD experiments using the following equation:
 | (2) |
| C (F g−1) with ηb (%) @RT | C (F g−1) with η (%) @100 °C | ||||
|---|---|---|---|---|---|
| 0.5 A g−1 | 1 A g−1 | 1 A g−1 | 5 A g−1 | 10 A g−1 | |
| a Discharge capacitance. b Columbic efficiency. | |||||
| Butyl GlyC | 15.5 with 97% | 12 with 98% | 34 with 90% | 20 with 97% | 13 with 99% |
| Benzyl GlyC | 0.02 with 38% | — | 25 with 71% | 1.1 with 60% | — |
| Ethyl GlyC | — | — | 23 with 85% | 15 with 95% | 6.4 with 93% |
| EC–DMC | 28 with 92% | 26 with 95% | — | — | — |
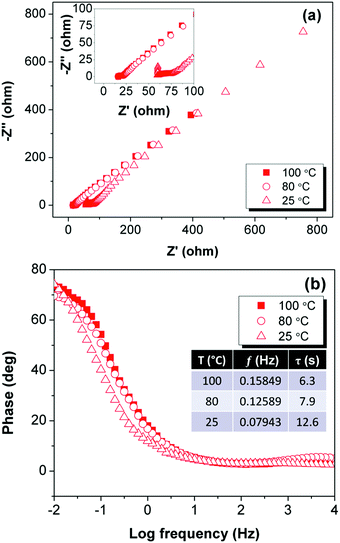
To garner a deeper understanding of the internal resistance of the electrode and the electrolyte, we conducted an electrochemical impedance spectroscopy (EIS) experiment with a LIC cell configured with 1.0 M LiTFSI in Butyl GlyC. We equilibrated the LIC cell at 25, 80 and 100 °C and obtained Nyquist and Bode plots of AC/Butyl GlyC/AC at a constant potential of 0.8 V (illustrated in Fig. 5a and b). The Nyquist plot is linear from low to high frequencies, but in the high frequency region a slight semi-circle is present from 50 to 75 ohms at 25 °C (Fig. 5a). At 80 °C and 100 °C the plot is nearly a horizontal line relative to Z′. Normally, a vertical line on the Nyquist plot at low frequencies and a 90° phase angle on the Bode plot indicate a pure supercapacitor system, therefore, the slight semi-circle and deviation from the 90° phase angle observed in the EIS measurement confirms the pseudocapacitive charge behavior of the Butyl GlyC electrolyte. Moving to intermediate and low frequencies, the data continue to form a linear line, indicating a diffusion mediated process at these frequencies. Thus, while the formation of an EDL is the main mechanism for energy generation, lithium ion intercalation into the electrode is present in the LICs. Additionally, as observed in the EIS experiments, charge transfer resistance reduces as the temperature of the experiment increases. This lower resistance is further corroborated by the increased capacitance at higher temperature. Together, the data demonstrate that the 1.0 M LiTFSI Butyl GlyC electrolyte exhibits low impedance and is easily able to transport the charge carriers, even at a high frequency. These findings are in line with the results observed in the CV and CD experiments.
The theoretical capacitance of the working electrode in a three-electrode configuration can be calculated from the EIS method using the following equation:
| Cs = −1/(2πƒZ′′m) | (3) |
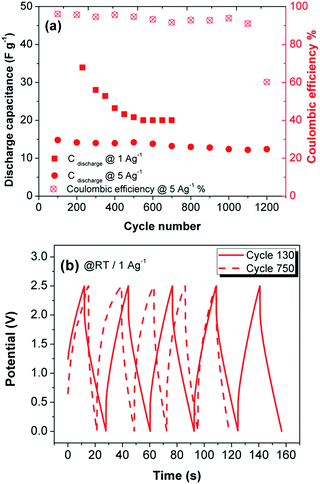
Next, we performed continuous galvanostatic charge–discharge cycling to evaluate the performance of the electrodes in contact with 1.0 M LiTFSI in Butyl GlyC at 100 °C. The specific discharge capacitance of the cells at applied current densities of 1 and 5 A g−1 are plotted in Fig. 6a. A steep decline in discharge capacitance occurs in the cell operated at lower current density while at a higher current density, the discharge capacitance remains steady up to the 1200th cycle. Higher applied current density affords a columbic efficiency of 96% at cycle 100 and 91% after the 1100th cycle (Fig. 6a). However, the columbic efficiency at the lower current density of 1 A g−1 was 90% at cycle 230 and significantly diminished to 62.5% at cycle 700 (data not shown). We attribute this behavior to the entrapment of Li ions in the interlayer of the AC electrode, which is promoted at higher temperatures and lower scan rates or current densities.22 Furthermore, the CD curve of the LIC cell with the Butyl GlyC electrolyte measured at 1 A g−1 and room temperature is comparable to the CD curve obtained after long term cycling at 100 °C (Fig. 6b). Continuous operation of the cell at elevated temperatures results in the shortening of the charge–discharge time and diminished capacitance of the cell.
We calculated the energy and power density of the LIC cells containing AC electrodes and the Butyl GlyC electrolyte following eqn (4) and (5) and the generated Ragone plot is illustrated in Fig. 7.
| E = 1/8 Cs(ΔV)2 (W h kg−1) | (4) |
| P = E/Δt (W kg−1) | (5) |
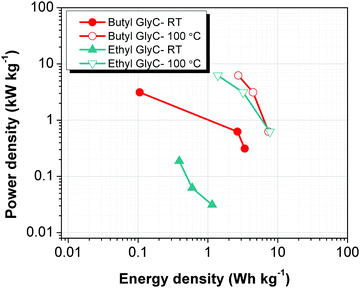 | ||
| Fig. 7 Ragone plot for AC LIC cells configured with Ethyl GlyC and Butyl GlyC electrolytes and tested at room temperature (RT) and 100 °C. | ||
In comparison with other studies utilizing AC as electrodes in supercapacitors, the glycerol carbonates performed with reduced discharge capacitance. For example, at ambient temperature a standard ACN electrolyte with 1.6 M Et4NBF4 (tetraethylammonium tetrafluoroborate), displayed a discharge capacitance of 26 F g−1.23 And room temperature ionic liquid (RTILs) electrolytes evaluated at various temperatures displayed discharge capacitance 3–4× larger than our glycol carbonate based LICs.24–28 For instance, Balducci et al. used 1-butyl-1-methylpyrrolidinium bis(trifluoro-methane-sulfonyl)imide in a microporous AC coin cell that exhibited a discharge capacitance of 90 F g−1 at 60 °C.5 While at first glance, RTIL systems seem to generate higher discharge capacitance compared to our system, on a deeper analysis it becomes clear that bare AC mixed with carbon black and a PVDF binder were not the only components used in the systems: more exotic and complex AC mixtures or electrodes have also been explored in high discharge systems.9,29 For example, KOH-activated microwave exfoliated graphite oxide electrodes,30D-glucose derived activated carbon powder,31 and lignin: PVA carbon fiber mats32 were used to develop systems with discharge capacitance of 130, 245 and 72 F g−1, respectively, at room temperature. Furthermore, mixtures of RTILs and traditional carbonate salts were combined to increase the discharge capacitance even while utilizing a simple AC electrode.33 For instance, tributyl-phosphine tetrafluoroborate was mixed with ACN, with a molar ratio of 0.86, to generate a supercapacitor with a discharge capacitance of 120 F g−1 at 50 °C34 (see Table S1 in the ESI† for a comprehensive list of all studies mentioned here). The above electrolyte systems have advantages, including high discharge capacitance, as well as weaknesses such as the need to include one or more of the following elements: complex electrodes, mixtures of flammable and toxic carbonate solvents, or the use of environmentally damaging reagents and work up processes. Given the stable electrochemical performance at ambient temperatures and 100 °C, straightforward electrode fabrication, and overall environmentally benign synthesis and degradation, the glycerol carbonate system is a promising electrolyte system.
Conclusions
In summary, we describe the physicochemical and performance characteristics of three potential environmentally friendly glycerol carbonate solvents as electrolytes for lithium ion supercapacitors. The glycerol carbonates possess an ethyl, benzyl, or butyl pendant chain. The conductivity of the glycerol carbonate-based electrolytes with 1.0 M LiTFSI increases significantly with elevated temperatures, and all three electrolytes are electrochemically stable with a stability window of 2.5 V vs Li/Li+. Lithium ion supercapacitors composed of activated carbon electrodes containing one of the glycerol carbonates or EC–DMC with 1.0 M LiTFSI exhibit temperature and current rate dependent performances. At room temperature, the devices with the glycerol carbonate exhibit lower discharge capacitance compared to EC–DMC cells with capacitances of 15, 28, and 29 F g−1, at a current rate of 1 A g−1, for the ethyl, benzyl, and butyl glycerol carbonate electrolytes, respectively. However at 100 °C the EC–DMC supercapacitors no longer function. At 100 °C, the supercapacitors containing the ethyl, benzyl, and butyl glycerol carbonate electrolytes perform well with discharge capacitances of 162, 96, and 115 F g−1 at a current rate of 1 A g−1, respectively. Lastly, supercapacitors containing Butyl GlyC exhibit long term stability with over 60% coulombic efficiency retention at a current of 5 A g−1 for over 1000 cycles at 100 °C. These findings demonstrate the promising features of glycerol carbonate based solvent electrolytes, particularly at high temperatures. Continued development and evaluation of sustainable electrolytes for EES will further our knowledge on the design space for optimal electrolytes that address the requirements for supercapacitors and Li-ion batteries to operate at both room and elevated temperatures.Conflicts of interest
The authors have no conflicts of interest.Acknowledgements
This article was supported in part by Boston University and the NSF (DMR-1507081).References
- R. Lin, P.-L. Taberna, S. Fantini, V. Presser, C. R. Pérez, F. Malbosc, N. L. Rupesinghe, K. B. K. Teo, Y. Gogotsi and P. Simon, J. Phys. Chem. Lett., 2011, 2, 2396–2401 CrossRef CAS.
- M.-T. F. Rodrigues, X. Lin, H. Gullapalli, M. W. Grinstaff and P. M. Ajayan, J. Power Sources, 2016, 330, 84–91 CrossRef CAS.
- X. Lin, M. Salari, L. M. R. Arava, P. M. Ajayan and M. W. Grinstaff, Chem. Soc. Rev., 2016, 45, 5848–5887 RSC.
- D. R. Wright, N. Garcia-Araez and J. R. Owen, Energy Procedia, 2018, 151, 174–181 CrossRef CAS.
- A. Balducci, R. Dugas, P. L. Taberna, P. Simon, D. Plee, M. Mastragostino and S. Passerini, J. Power Sources, 2007, 165, 922–927 CrossRef CAS.
- J. Chapman Varela, K. Sankar, A. Hino, X. Lin, W.-s. Chang, D. Coker and M. Grinstaff, Chem. Commun., 2018, 54, 5590–5593 RSC.
- H. Li, L. Peng, D. Wu, J. Wu, Y.-J. Zhu and X. Hu, Adv. Energy Mater., 2019, 9, 1802930 CrossRef.
- X. Wang, M. Salari, D.-e. Jiang, J. Chapman Varela, B. Anasori, D. J. Wesolowski, S. Dai, M. W. Grinstaff and Y. Gogotsi, Nat. Rev. Mater., 2020, 5, 787–808 CrossRef CAS.
- V. Ruiz, T. Huynh, S. R. Sivakkumar and A. G. Pandolfo, RSC Adv., 2012, 2, 5591–5598 RSC.
- O. N. Kalugin, V. V. Chaban, V. V. Loskutov and O. V. Prezhdo, Nano Lett., 2008, 8, 2126–2130 CrossRef CAS PubMed.
- M. D. Stoller, S. Park, Y. Zhu, J. An and R. S. Ruoff, Nano Lett., 2008, 8, 3498–3502 CrossRef CAS PubMed.
- D. Yaakov, Y. Gofer, D. Aurbach and I. C. Halalay, J. Electrochem. Soc., 2010, 157, A1383–A1391 CrossRef CAS.
- Y. Lai, B. Peng, Z. Zhang and J. Li, J. Electrochem. Soc., 2014, 161, A875–A879 CrossRef CAS.
- M. Salari and M. W. Grinstaff, Meeting Abstracts, 2016, MA2016-02, 955-955.
- C. Largeot, P. L. Taberna, Y. Gogotsi and P. Simon, Electrochem. Solid-State Lett., 2011, 14, A174–A176 CrossRef CAS.
- M. Salari, S. H. Aboutalebi, A. T. Chidembo, P. C. Innis, K. Konstantinov, H. K. Liu and P. Schmuki, Phys. Status Solidi A, 2014, 211, 938–945 CrossRef CAS.
- R. S. Borges, A. L. M. Reddy, M.-T. F. Rodrigues, H. Gullapalli, K. Balakrishnan, G. G. Silva and P. M. Ajayan, Sci. Rep., 2013, 3, 2572 CrossRef PubMed.
- J. L. Goldfarb, G. Dou, M. Salari and M. W. Grinstaff, ACS Sustainable Chem. Eng., 2017, 5, 3046–3054 CrossRef CAS.
- M. F. El-Kady, V. Strong, S. Dubin and R. B. Kaner, Science, 2012, 335, 1326–1330 CrossRef CAS PubMed.
- J. Zhang, J. Jiang, H. Li and X. S. Zhao, Energy Environ. Sci., 2011, 4, 4009–4015 RSC.
- Y. Zhu, S. Murali, M. D. Stoller, K. J. Ganesh, W. Cai, P. J. Ferreira, A. Pirkle, R. M. Wallace, K. A. Cychosz, M. Thommes, D. Su, E. A. Stach and R. S. Ruoff, Science, 2011, 332, 1537–1541 CrossRef CAS.
- M. Salari, B. G. Cooper, H. Zhang and M. W. Grinstaff, Adv. Sustainable Syst., 2017, 1, 1700067 CrossRef.
- X. Bu, L. Su, Q. Dou, S. Lei and X. Yan, J. Mater. Chem. A, 2019, 7, 7541–7547 RSC.
- L. Zhang, K. Tsay, C. Bock and J. Zhang, J. Power Sources, 2016, 324, 615–624 CrossRef CAS.
- R. Thangavel, A. G. Kannan, R. Ponraj, V. Thangavel, D.-W. Kim and Y.-S. Lee, J. Power Sources, 2018, 383, 102–109 CrossRef CAS.
- L. Timperman, F. Beguin, E. Frackowiak and M. Anouti, J. Electrochem. Soc., 2014, 161, A228–A238 CrossRef CAS.
- K. L. Van Aken, M. Beidaghi and Y. Gogotsi, Angew. Chem., Int. Ed., 2015, 54, 4806–4809 CrossRef CAS PubMed.
- K. K. Denshchikov, M. Y. Izmaylova, A. Z. Zhuk, Y. S. Vygodskii, V. T. Novikov and A. F. Gerasimov, Electrochim. Acta, 2010, 55, 7506–7510 CrossRef CAS.
- R. Zarrougui, R. Hachicha, R. Rjab and O. Ghodbane, J. Mol. Liq., 2018, 249, 795–804 CrossRef CAS.
- W.-Y. Tsai, R. Lin, S. Murali, L. L. Zhang, J. K. McDonough, R. S. Ruoff, P.-L. Taberna, Y. Gogotsi and P. Simon, Nano Energy, 2013, 2, 403–411 CrossRef CAS.
- T. Tooming, T. Thomberg, L. Siinor, K. Tonurist, A. Janes and E. Lust, J. Electrochem. Soc., 2014, 161, A222–A227 CrossRef CAS.
- R. A. Perera Jayawickramage and J. P. Ferraris, Nanotechnology, 2019, 30, 155402 CrossRef PubMed.
- J. Guo, M. Ye, K. Zhao, J. Cui, B. Yang, J. Meng and X. Yan, Colloids Surf., A, 2020, 598, 124858 CrossRef CAS.
- L. Timperman, H. Galiano, D. Lemordant and M. Anouti, Electrochem. Commun., 2011, 13, 1112–1115 CrossRef CAS.
Footnote |
| † Electronic supplementary information (ESI) available. See DOI: 10.1039/d1ma00547b |
| This journal is © The Royal Society of Chemistry 2021 |


