 Open Access Article
Polymerization-tailored polyimides as cathodes for lithium-ion batteries†
Sheng
Lei
a,
Yanying
Dong
b,
Yu
Dou
a,
Xiaofang
Zhang
 *b,
Qing
Zhang
 a and
Yingkui
Yang
 *ab
*ab
aKey Laboratory of Catalysis and Energy Materials Chemistry of Ministry of Education & Hubei Key Laboratory of Catalysis and Materials Science, South-Central University for Nationalities, Wuhan 430074, China. E-mail: ykyang@mail.scuec.edu.cn
bHubei Engineering Technology Research Centre of Energy Polymer Materials, School of Chemistry and Materials Science, South-Central University for Nationalities, Wuhan 430074, China. E-mail: xfzhang@scuec.edu.cn
First published on 3rd August 2021
Abstract
The sustainable development of lithium-ion batteries (LIBs) urges electrode materials to be low-cost, richly sourced, environmentally benign and to have recycling capability. Polyimides (PIs) as promising alternatives to transition-metal-based cathodes for LIBs have been a hot topic for researchers. However, the relationship between the structure and electrochemical performances of PIs should be further investigated. In this study, we prepared three types of PIs with the same molecular structure but different micro- and crystalline structures from 1,4,5,8-naphthalene-tetracarboxylic acid dianhydride and 1,3,5-tris(4aminophenyl)benzene via different methodologies. When these PI cathodes were assembled into LIBs, it turned out that the as-obtained polyimide framework (PI-COF) with a rich micro/mesoporous structure and high crystallinity demonstrated a higher capacity and better rate performance than that of amorphous PI with weak porosity. Importantly, PI-COF retained 80% of its initial capacity even after 10![[thin space (1/6-em)]](https://www.rsc.org/images/entities/char_2009.gif) 000 cycles at 1.5 A g−1, presenting an excellent cycling stability. This showed a great potential to mitigate stability issues that many organic electrodes typically suffer from.
000 cycles at 1.5 A g−1, presenting an excellent cycling stability. This showed a great potential to mitigate stability issues that many organic electrodes typically suffer from.
1. Introduction
Rechargeable lithium-ion batteries (LIBs), as one of the state-of-the-art energy-conversion and energy-storage systems, play an indispensable role and have gained extensive attention towards the development of smart grids and electric vehicles due to their high energy density, long cycle life and high efficiency.1,2 For now, the redox-active electrode materials used for LIBs are mainly based on inorganic materials, including lithium transition-metal oxides or phosphates.3 However, inorganic materials have their inherent limitations in specific capacities, mechanical fragileness, eco-sustainability and cost efficiency. Furthermore, inorganic materials are limited by their high cost, sustainability, and environmental impact. Additionally, the limited mineral resources further inflate the production cost of these key battery components. All of these make inorganic electrode materials fail to meet the demands in terms of safety and sustainability for LIB development.4In contrast, organic electrodes with multiple redox-active sites have been demonstrated as promising alternatives to inorganic electrodes owing to their lightweightness, high natural abundance, relatively low toxicity, and ease of disposal. Further, the high designability in their molecular structure enables the regulation of functionalities and redox properties for organic electrodes, thus giving rise to optimize the LIB electrochemical properties including capacity, reaction kinetics, energy storage capability and cycling stability.5,6 Currently, several redox-active organic materials, such as organic free radicals,7 organosulphurs,8 and carbonyl-containing compounds9,10 show the reversible reactivity with Li, which have been intensively used as electrodes for LIB application thus far. Nevertheless, several drawbacks, such as low thermal stability, low conductivity, and solubility in organic electrolytes, still hamper the further development of such organic electrodes in LIB applications. In this regard, the key to design organic LIB cathode materials with good performance, comparable to that of inorganic materials, is to construct a stable polymer structure with highly electroactive functionalities, good stability in the electrolyte as well as fast kinetic response.
The very special carbonyl group (C![[double bond, length as m-dash]](https://www.rsc.org/images/entities/char_e001.gif) O)-containing imide compounds stand out and have attracted wide interest as a result of their high theoretical capacity (two-electron redox process per imide center), high working voltage (≈2.5 V) and fast redox reaction.11 Polyimides (PIs) as a type of engineering plastic polymers with high mechanical strength and excellent thermal stability have been widely studied as active LIB electrode materials,11 beyond their typical applications as structural materials12 or as skeletons of functional groups.13 When PIs are applied as the cathodes for LIBs, the typical redox process is generalized as enolization and its reverse process of the carbonyl group, simultaneously accompanied by the association and disassociation of Li+ ions with oxygen.14 This reversible manner can be further facilitated by extending the conjugated structure of PIs.15 However, the deficient redox-active site (C
O)-containing imide compounds stand out and have attracted wide interest as a result of their high theoretical capacity (two-electron redox process per imide center), high working voltage (≈2.5 V) and fast redox reaction.11 Polyimides (PIs) as a type of engineering plastic polymers with high mechanical strength and excellent thermal stability have been widely studied as active LIB electrode materials,11 beyond their typical applications as structural materials12 or as skeletons of functional groups.13 When PIs are applied as the cathodes for LIBs, the typical redox process is generalized as enolization and its reverse process of the carbonyl group, simultaneously accompanied by the association and disassociation of Li+ ions with oxygen.14 This reversible manner can be further facilitated by extending the conjugated structure of PIs.15 However, the deficient redox-active site (C![[double bond, length as m-dash]](https://www.rsc.org/images/entities/char_e001.gif) O) utilization, particularly at high current rates and upon long-term cycling, is the main challenge of PIs as LIB cathodes. It is known that the utilization of C
O) utilization, particularly at high current rates and upon long-term cycling, is the main challenge of PIs as LIB cathodes. It is known that the utilization of C![[double bond, length as m-dash]](https://www.rsc.org/images/entities/char_e001.gif) O functionalities is directly affected by the microstructure or the crystalline structure, which are highly related to the synthesis procedures of PIs.16 However, there are a few studies on the influence of different synthesis methods on the electrochemical properties of PI cathodes thus far.
O functionalities is directly affected by the microstructure or the crystalline structure, which are highly related to the synthesis procedures of PIs.16 However, there are a few studies on the influence of different synthesis methods on the electrochemical properties of PI cathodes thus far.
In this study, we prepared three types of PIs from naphthalene-1,4,5,8-tetracarboxylic dianhydride (NTCDA) and 1,3,5-tris(4-aminophenyl)benzene (TAPB) via different synthesis methods, i.e., solvothermal polymerization, one-step polycondensation, and amorphous-to-crystalline transformation strategy, respectively. Different synthesis procedures rendered remarkable differences in the micro-architectures and crystalline structures for the resulting PI products. It demonstrated that the solvothermal polymerization and one-step polycondensation resulted in PIs with amorphous feature and weak porosity, while the amorphous-to-crystalline transformation strategy produced the PIs ordered framework with higher crystallinity and larger specific surface area. When all PI products were applied as cathodes to LIB electrodes, the PI framework turned out to have higher capacity and better rate performance than amorphous PIs. In particular, the PI framework demonstrated excellent cycling stability even at a high current density, presenting a great potential in LIB applications.
2. Experimental section
2.1 Materials
1,4,5,8-Naphthalene-tetracarboxylic acid dianhydride (NTCDA) was purchased from Sigma Aldrich. 1,3,5-Tris(4-aminophenyl)benzene (TAPB) was provided by Shanghai Yuanye Bio-technology Co Ltd, China. N-Methyl-2-pyrrolidone (NMP) and mesitylene were supplied by Sinopharm Chemical Reagent Beijing Co Ltd, China. Isoquinoline was purchased from Aladdin. All solvents, reagents and chemicals were used without further purification.2.2 Synthesis of the polyimide via solvothermal polymerization
First, an acid–base reaction was carried out to prepare monomer salt from NTCDA and TAPB. In a typical procedure, 0.402 g (1.5 mmol) of NTCDA was dispersed in 15.0 mL distilled water for stirring 1 h at 80 °C under Ar atmosphere. Next, 0.351 g (1.0 mmol) TAPB was added. After stirring for another 2 h, the obtained yellow powder was washed with distilled water and ethanol, respectively, followed by drying at 60 °C in vacuum for 12 h to obtain the monomer salt. The formation process of the monomer salt is illustrated in Fig. S1 (ESI†). Next, the obtained monomer salt was redissolved in 30 mL NMP, and then, subjected to a solvothermal treatment in a Teflon-lined autoclave at 200 °C for 12 h. After the reaction, the product was washed with distilled water and ethanol for several times, and then dried overnight in a vacuum oven at 80 °C. Finally, the polyimide powder was obtained with a yield of ca. 60%.2.3 Synthesis of the polyimide via one-step polycondensation
For a typical procedure, 0.402 g NTCDA was dissolved in 15.0 mL NMP, and then into it, 0.351 g TAPB was added. After reacting at 150 °C for 12 h under Ar atmosphere, the system was cooled down to room temperature. Next, the product was washed with ethanol for several times and then dried at 100 °C for 12 h. Finally, the product was heated at 300 °C for 8 h in a tube furnace under N2 atmosphere. The corresponding reaction process is shown in Fig. S2 (ESI†).2.4 Synthesis of the polyimide framework via the amorphous-to-crystalline transformation strategy
The polyimide framework was synthesized according to a reported procedure.17 Typically, a pyrex tube (120 mL) was charged with NTCDA (0.402 g, 1.5 mmol) and TAPB (0.351 g, 1.0 mmol) in NMP (5.0 mL)/mesitylene (5.0 mL)/isoquinoline (0.5 mL) mixed solution. The pyrex tube was subjected to freeze–pump–thaw for 3 cycles and then heated at 200 °C for 5 days. Next, the product was filtrated and washed with THF and ethanol for several times, and then re-immersed in anhydrous THF for 8 h, during which the activation solvent was decanted and replaced by ethanol several times. Finally, the resulting product was collected and dried at 80 °C under vacuum for 12 h to obtain the polyimide framework, and the yield was calculated to be ca. 75%.2.5 General characterization
Scanning electron microscopy (SEM) measurements were performed on a SU 8010 microscope, and transmission electron microscopy (TEM) tests were examined on a Tecnai G20 electron microscope. Fourier transform infrared (FT-IR) spectra were collected on a Thermo Nicolet Nexus 470 model. Powder X-ray diffraction (PXRD) was carried out on a PANayltical Empyrean powder X-ray diffractometer in the 2θ range of 2–40° with a step size of 0.02° and 2 s per step using monochromatic Cu Kα radiation. Nitrogen adsorption test (Quantachrome NovaWin instrument) was performed at 77 K and various relative vapor pressures (five points 0.01 < P/P0 < 0.3, nitrogen molecular cross-sectional area = 0.162 nm2) were used to analyze the porous structures of the polyimide products.2.6 Electrochemical measurements
All samples as LIB cathodes were assembled into a CR2032 coin type half cells in an Ar-filled glovebox for electrochemical measurements at room temperature. The cathodes were prepared by mixing the active material, conductive carbon black (Super P) and polyvinylidene fluoride (PVDF) in a weight ratio of 5![[thin space (1/6-em)]](https://www.rsc.org/images/entities/char_2009.gif) :
:![[thin space (1/6-em)]](https://www.rsc.org/images/entities/char_2009.gif) 4
4![[thin space (1/6-em)]](https://www.rsc.org/images/entities/char_2009.gif) :
:![[thin space (1/6-em)]](https://www.rsc.org/images/entities/char_2009.gif) 1 in N-methyl-2-pyrrolidone to form a slurry. Then, the slurry was coated onto Al foils and dried at 80 °C overnight in a vacuum oven. The cathodes were cut in round shapes with a diameter of 10 mm and then assembled with a lithium foil as the counter electrode and a Celgard 2400 membrane as the separator to construct cells. The 1 M lithium bis(trifluoromethanesulfonyl)imide (LiTFSi)-contained 1,3-dioxolane (DOL)/1,2-dimethoxyethane (DME) solution (vol/vol = 1
1 in N-methyl-2-pyrrolidone to form a slurry. Then, the slurry was coated onto Al foils and dried at 80 °C overnight in a vacuum oven. The cathodes were cut in round shapes with a diameter of 10 mm and then assembled with a lithium foil as the counter electrode and a Celgard 2400 membrane as the separator to construct cells. The 1 M lithium bis(trifluoromethanesulfonyl)imide (LiTFSi)-contained 1,3-dioxolane (DOL)/1,2-dimethoxyethane (DME) solution (vol/vol = 1![[thin space (1/6-em)]](https://www.rsc.org/images/entities/char_2009.gif) :
:![[thin space (1/6-em)]](https://www.rsc.org/images/entities/char_2009.gif) 1) was used as the electrolyte. For electrochemical tests, the galvanostatic charge–discharge (GCD) measurements were performed on a CT2001A (LANHE, Wuhan, China) battery tester at a voltage range of 1.5–3.5 V (vs. Li+/Li). Cyclic voltammetry (CV) at a scan rate of 1 mV s−1 and electrochemical impedance spectroscopy (EIS) tests were carried out at the frequency region from 105 Hz to 0.01 Hz on a CHI 760E electrochemical workstation (ChenHua, Shanghai, China). All measurements were performed at room temperature.
1) was used as the electrolyte. For electrochemical tests, the galvanostatic charge–discharge (GCD) measurements were performed on a CT2001A (LANHE, Wuhan, China) battery tester at a voltage range of 1.5–3.5 V (vs. Li+/Li). Cyclic voltammetry (CV) at a scan rate of 1 mV s−1 and electrochemical impedance spectroscopy (EIS) tests were carried out at the frequency region from 105 Hz to 0.01 Hz on a CHI 760E electrochemical workstation (ChenHua, Shanghai, China). All measurements were performed at room temperature.
3. Results and discussion
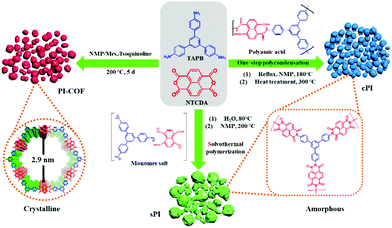
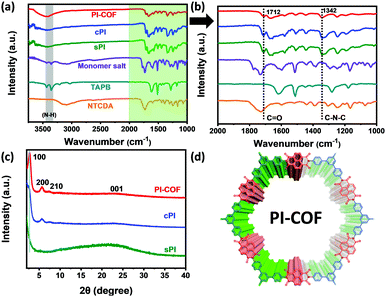
In this study, NTCDA and TAPB with conjugated molecular structures were chosen as building blocks to ensure the resultant PI products with an extended conjugated structure and good molecular stability. As shown in Scheme 1, we prepared three types of PIs via solvothermal polymerization, one-step polycondensation, and amorphous-to-crystalline transformation strategy, respectively. For the following discussion, the corresponding PI products were designated as sPI, cPI, and PI-COF, respectively.First, structural characterization by FT-IR spectroscopy was conducted to provide insight into the successful formation of the PI products. As shown in Fig. 1a, the resonances corresponding to the free amine between 3300 and 3500 cm−1 in TAPB, and the characteristic peak related to the free aldehyde stretch at 1685 cm−1 in NCDTA are absent after the reaction. All resultant PI products obtained via different preparation procedures have a nearly identical spectrum, which is a characteristic of the similarity in their molecular structures. In particular, zooming into the characteristic region of 1000–2000 cm−1 (Fig. 1b), sPI, cPI, and PI-COF present two new characteristic peaks at 1712 and 1342 cm−1 compared to TAPB and NCDTA, which are attributed to the carbonyl stretching frequencies and the C–N stretching bands, respectively.18 These observations indicate the formation of imide rings, and further confirm the successful synthesis of the target PI products. Powder X-ray diffraction (PXRD) measurements were carried out to analyze the crystalline structures of sPI, cPI and PI-COF. As demonstrated in Fig. 1c, the crystalline structure of all PI products is highly related to the synthesis procedures. For the sPI prepared via solvothermal polymerization, the PXRD pattern shows a broad peak indicating its amorphous feature.19 While cPI prepared via conventional polymerization displays a weak peak at 5.69° corresponding to the (200) plane, suggesting a low crystallinity with poor long-range periodicity.20 It is noteworthy to mention that PI-COF reveals the first and most intensive peak at 2.7° attributed to (100) along with minor peaks at 5.6° and 7.3° assigned to the (200) and (210) planes, respectively, demonstrating the formation of ordered domains with high crystallinity (as illustrated in Fig. 1d).21 In addition, the peak at a higher 2θ value of 22.7 signifies the π–π stacking between PI-COF layers arising from the (001) reflection planes. The interlayer distance is calculated to be ca. 0.38 nm, which is in well agreement with the stacking distance of ca 0.40 nm in the following HR-TEM image (Fig. 2f).
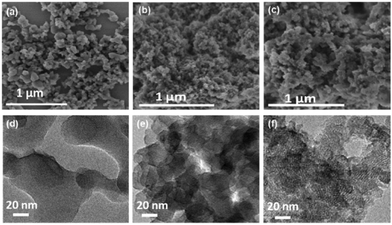 | ||
| Fig. 2 SEM images of (a) sPI, (b) cPI and (c) PI-COF. High-resolution TEM images of (d) sPI, (e) cPI and (f) PI-COF. | ||
The morphologies of all the PI products were analyzed by SEM and TEM observations. sPI exhibits a particle-like morphology and randomly aggregates into stacks with the size up to several micrometers (Fig. 2a and Fig. S3a, ESI†). cPI and PI-COF form much smaller, highly aggregated nanoparticles, with size distributions located at 10–60 and 10–40 nm, respectively (Fig. 2b, c and Fig. S3b, c, ESI†). TEM observation also demonstrates the particle-like structures of PI products (Fig. S3d–f, ESI†). Further, the high-resolution TEM images show that sPI and cPI display the amorphous feature (Fig. 2d and e), which is in good accordance with their XRD patterns (Fig. 1c). Quite differently, clear lattice fringes are commonly observed in numerous small domains for PI-COF (Fig. 2f), revealing high crystallinity with periodicities in PI-COF three dimensions and further demonstrating the successful formation of the ordered framework structure. This not only benefits the extension of the conjugated structure, but also results in rich micro/mesoporous structures in the PI-COF structure.
The porous structures of sPI, cPI, and PI-COF were probed by N2 adsorption/desorption measurements. As shown in Fig. 3a, sPI and cPI present a type-V isotherm, which is a characteristic of their weak porous structure. However, PI-COF gaves rise to a typical IV isotherm with a significant H2 type hysteresis loop in the desorption branch and a sharp increase in a relative pressure of P/P0 < 0.1, corroborating the coexistence of micro- and mesopores in PI-COF.22 In addition, all PI products show a nitrogen uptake at a high relative pressure of P/P0 > 0.8, suggesting the presence of macroporous structures, which are generated from the interparticulate porosity that exists within their three-dimensional (3D) aggregated particles, as demonstrated by SEM observations. Accordingly, the pore size distribution following the nonlinear density functional theory (DFT) demonstrates that PI-COF has apparent two peaks at the microporous and mesoporous regions, while very weak peaks are detected in those of sPI and cPI (Fig. 3b). This observation is in high consistence with their TEM images. In particular, PI-COF has a median pore width centered at 1.39 nm with the maximum pore volume (Vmax) of 0.215 cm3 g−1, much higher than the Vmax values of 0.010 cm3 g−1 for sPI and 0.034 cm3 g−1 for cPI. As a result, PI-COF turns out to have the highest BET surface area of 562 m2 g−1 and the highest pore volume of 0.835 cm3 g−1 compared to sPI with a BET surface area of 28 m2 g−1 and a pore volume of 0. 0.258 cm3 g−1 and cPI with a BET surface area of 76 m2 g−1 and with a pore volume of 0.378 cm3 g−1. The high specific surface area combined with a rich micro/mesoporous structure contribute the fast ion diffusion and transportation within PI-COF.
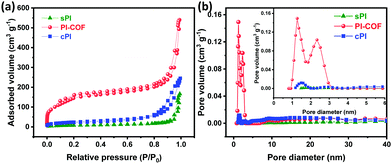 | ||
| Fig. 3 (a) Nitrogen adsorption–desorption isotherms, and (b) pore size distributions of sPI, cPI, and PI-COF. | ||
All PI products were used as cathodes and assembled into CR2032-type coin cells with Li foils as the counter electrode for LIB application. The electrochemical performance was evaluated in a potential window of 1.5–3.5 V (vs. Li+/Li) using 1.0 M LiTFSi as an electrolyte. Fig. 4a shows the CV curves of sPI, cPI, and PI-COF at the scan rate of 1 mV s−1 after three cycles (the first three cycles can be found in Fig. S4, ESI†). All PI products present one redox couple, centered at the potential values of 2.67/2.42 for sPI, 2.50/2.32 for cPI, and 2.52/2.41 for PI-COF, which is resulted from the highly reversible lithiation/de-lithiation process along with the reduction of C![[double bond, length as m-dash]](https://www.rsc.org/images/entities/char_e001.gif) O groups/re-oxidation of alkoxide groups.23,24 The corresponding redox reactions involve the reversible formation of radical anions and then dianions of two opposite C
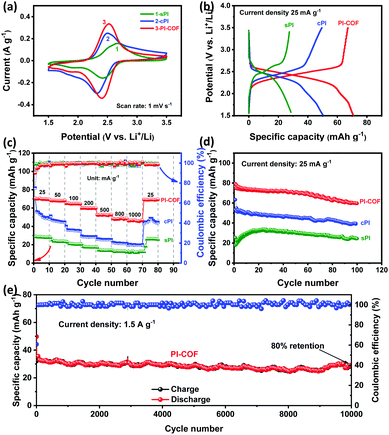
O groups/re-oxidation of alkoxide groups.23,24 The corresponding redox reactions involve the reversible formation of radical anions and then dianions of two opposite C![[double bond, length as m-dash]](https://www.rsc.org/images/entities/char_e001.gif) O groups, as illustrated in Fig. S5 (ESI†). In particular, the peak separation of PI-COF turns out to be 0.11 V, lower than 0.18 V for cPI and 0.25 V for sPI, which indicates a lower polarization and a faster electronic transmission occurred within PI-COF.25 In addition, PI-COF displays the CV curve having the largest enclosed area compared to sPI and cPI, clarifying its highest capacity. Galvanostatic charge–discharge (GCD) tests were carried out, and the results are shown in Fig. 4b and Fig. S6 (ESI†). According to the literature, the theoretical capacity of PI cathodes is 115 mA h g−1.24 From the GCD profiles at the current density of 25 mA g−1, all PIs exhibit a single charge/discharge plateau, in good line with the CV measurements. The midpoint discharge voltages for sPI, cPI, and PI-COF are all located at ∼2.4 V, agreeing well with those of other reported PI cathodes.26 Based on the GCD profiles at 25 mA g−1, the specific capacity of PI-COF is 70.6 mA h g−1, higher than those of sPI (28.5 mA h g−1) and cPI (50.4 mA h g−1). With the current density increased from 25 to 1000 mA g−1, the specific capacity of PI-COF decreases to 47.0 mA h g−1 at 1000 mA g−1, as a result of its ion-diffusion-controlled electrochemical process.27 Even so, PI-COF still exhibits 66% retention of its initial specific capacity superior to sPI with 39.7% retention and cPI with 37.4% retention (Fig. 4c and Fig. S7, ESI†). The higher specific capacity and better rate performance of PI-COF are attributable to the ordered crystalline structure with a high specific surface area benefited the ion/electron transportation and the exposure of active carbonyl groups.26Fig. 4d presents that all the PI products exhibit similar cyclic stability. The capacity retentions after 100 cycles at the current density of 25 mA g−1 are 72.4% for sPI, 72.7% for cPI and 78.2% for PI-COF, which can be explained by the good stability of the intrinsic molecular structures for PI polymers. As demonstrated in Fig. S8–S10 (ESI†), no obvious change in morphologies is observed for sPI, cPI and PI-COF cathodes before and after cycling. Furthermore, the cycling stability of PI-COF at a higher current density of 1.5 A g−1 was investigated. As shown in Fig. 4e, PI-COF still exhibits outstanding long-term cycling stability with ∼80% capacity retention and ∼100% coulomb efficiency after 10
O groups, as illustrated in Fig. S5 (ESI†). In particular, the peak separation of PI-COF turns out to be 0.11 V, lower than 0.18 V for cPI and 0.25 V for sPI, which indicates a lower polarization and a faster electronic transmission occurred within PI-COF.25 In addition, PI-COF displays the CV curve having the largest enclosed area compared to sPI and cPI, clarifying its highest capacity. Galvanostatic charge–discharge (GCD) tests were carried out, and the results are shown in Fig. 4b and Fig. S6 (ESI†). According to the literature, the theoretical capacity of PI cathodes is 115 mA h g−1.24 From the GCD profiles at the current density of 25 mA g−1, all PIs exhibit a single charge/discharge plateau, in good line with the CV measurements. The midpoint discharge voltages for sPI, cPI, and PI-COF are all located at ∼2.4 V, agreeing well with those of other reported PI cathodes.26 Based on the GCD profiles at 25 mA g−1, the specific capacity of PI-COF is 70.6 mA h g−1, higher than those of sPI (28.5 mA h g−1) and cPI (50.4 mA h g−1). With the current density increased from 25 to 1000 mA g−1, the specific capacity of PI-COF decreases to 47.0 mA h g−1 at 1000 mA g−1, as a result of its ion-diffusion-controlled electrochemical process.27 Even so, PI-COF still exhibits 66% retention of its initial specific capacity superior to sPI with 39.7% retention and cPI with 37.4% retention (Fig. 4c and Fig. S7, ESI†). The higher specific capacity and better rate performance of PI-COF are attributable to the ordered crystalline structure with a high specific surface area benefited the ion/electron transportation and the exposure of active carbonyl groups.26Fig. 4d presents that all the PI products exhibit similar cyclic stability. The capacity retentions after 100 cycles at the current density of 25 mA g−1 are 72.4% for sPI, 72.7% for cPI and 78.2% for PI-COF, which can be explained by the good stability of the intrinsic molecular structures for PI polymers. As demonstrated in Fig. S8–S10 (ESI†), no obvious change in morphologies is observed for sPI, cPI and PI-COF cathodes before and after cycling. Furthermore, the cycling stability of PI-COF at a higher current density of 1.5 A g−1 was investigated. As shown in Fig. 4e, PI-COF still exhibits outstanding long-term cycling stability with ∼80% capacity retention and ∼100% coulomb efficiency after 10![[thin space (1/6-em)]](https://www.rsc.org/images/entities/char_2009.gif) 000 cycles at 1.5 A g−1. Such excellent cycling stability is superior to numerous reported polymer cathodes materials for LIBs (Table S1, ESI†).26,28–33 Beyond that, the electrochemical properties of PI-COF as anodes for LIBs were also investigated. From the CV curves at 1 mV s−1 and the GCD profiles at 25 mA g−1 (Fig. S11, ESI†), it could be seen that PI-COF has an obvious redox response and the initial discharge capacity of PI-COF was up to 1100 mA h g−1.34 As shown in Fig. S12 (ESI†), the specific capacity of PI-COF increases as the number of cycles increases, which may be due to the continuous insertion of lithium ions into the C6 aromatic ring system.34 In addition, PI-COF exhibits a long-term cycling stability with ∼100% coulomb efficiency after 400 cycles at 100 mA g−1.
000 cycles at 1.5 A g−1. Such excellent cycling stability is superior to numerous reported polymer cathodes materials for LIBs (Table S1, ESI†).26,28–33 Beyond that, the electrochemical properties of PI-COF as anodes for LIBs were also investigated. From the CV curves at 1 mV s−1 and the GCD profiles at 25 mA g−1 (Fig. S11, ESI†), it could be seen that PI-COF has an obvious redox response and the initial discharge capacity of PI-COF was up to 1100 mA h g−1.34 As shown in Fig. S12 (ESI†), the specific capacity of PI-COF increases as the number of cycles increases, which may be due to the continuous insertion of lithium ions into the C6 aromatic ring system.34 In addition, PI-COF exhibits a long-term cycling stability with ∼100% coulomb efficiency after 400 cycles at 100 mA g−1.
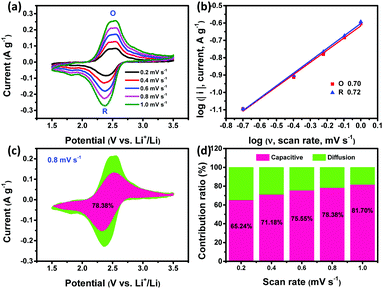
The electrochemical behaviors of all PI products were further investigated by the EIS test. Fig. S13 (ESI†) shows that all the PIs present a small semicircle at the high frequency region, suggesting a low charge-transfer resistance (Rct). Inferring from the straight line at the low frequency region, the ion diffusion within PI-COF is the fastest compared to that within sPI and cPI due to its micro/mesopore-dominated porous microstructure. The electrochemical reaction kinetics of all PIs was further analyzed based on CV measurements at low current densities from 0.2 to 1.0 mV s−1 (Fig. 5a and Fig. S14a, S15a, ESI†), obeying the power law:35
| I = avb |
In addition, the quantitative capacitive contribution (k1ν) and diffusion-controlled capacity contribution (k2ν1/2) were determined according to the following equation:36,37
| i = k1ν + k2ν1/2 |
4. Conclusion
In summary, three-types of conjugated polyimides with the same molecular structure but different nanoarchitectures and crystalline features were developed via different preparation procedures. The amorphous-to-crystalline transformation strategy resulted in the polyimide product with an ordered framework, in sharp contrast to the solvothermal polymerization and one-step polycondensation affording polyimides with amorphous characteristics. As a result, the polyimide framework (PI-COF) structure displayed huge enhancement in micro/mesoporous structures, specific surface area, and crystallinity. When serving as the cathode for LIBs, PI-COF displayed a discharge capacity of 70.6 mA h g−1 at 25 mA g−1 and a high 66% capacity retention at 1000 mA g−1, demonstrating better electrochemical properties superior to the amorphous polyimides. In particular, PI-COF maintained 80% retention of initial capacity even after 10![[thin space (1/6-em)]](https://www.rsc.org/images/entities/char_2009.gif) 000 cycles at 1.5 A g−1, indicating excellent cycling stability. These properties stem from the abundant micro/mesopores of the framework facilitating ion diffusion and the high crystallinity benefiting the extension of conjugate structures for the electron transfer. This PI-COF may provide further insights into the design of porous organic frameworks for high-performance energy storage electrode materials.
000 cycles at 1.5 A g−1, indicating excellent cycling stability. These properties stem from the abundant micro/mesopores of the framework facilitating ion diffusion and the high crystallinity benefiting the extension of conjugate structures for the electron transfer. This PI-COF may provide further insights into the design of porous organic frameworks for high-performance energy storage electrode materials.
Conflicts of interest
There are no conflicts to declare.Acknowledgements
This work was supported by the National Natural Science Foundation of China (51973235 and 21905308) and the Fundamental Research Funds for Central Universities (CZP19001).Notes and references
- Z. Yang, J. Zhang, M. C. Kintner-Meyer, X. Lu, D. Choi, J. P. Lemmon and J. Liu, Chem. Rev., 2011, 111, 3577–3613 CrossRef CAS PubMed
.
- B. Dunn, H. Kamath and J. M. Tarascon, Science, 2011, 334, 928–935 CrossRef CAS PubMed
.
- M. S. Whittingham, Chem. Rev., 2004, 104, 4271–4302 CrossRef CAS PubMed
.
- Z. Song and H. Zhou, Energy Environ. Sci., 2013, 6, 2280–2301 RSC
.
- T. Lei, W. Chen, J. Huang, C. Yan, H. Sun, C. Wang, W. Zhang, Y. Li and J. Xiong, Adv. Energy Mater., 2017, 7, 1601843 CrossRef
.
- T. Sun, Z.-J. Li, H.-G. Wang, D. Bao, F.-L. Meng and X.-B. Zhang, Angew. Chem., Int. Ed., 2016, 55, 10662–10666 CrossRef CAS PubMed
.
- Y. Morita, S. Nishida, T. Murata, M. Moriguchi, A. Ueda, M. Satoh, K. Arifuku, K. Sato and T. Takui, Nat. Mater., 2011, 10, 947–951 CrossRef CAS PubMed
.
- J. Fanous, M. Wegner, J. Grimminger, Ä. Andresen and M. R. Buchmeiser, Chem. Mater., 2011, 23, 5024–5028 CrossRef CAS
.
- W. Walker, S. Grugeon, H. Vezin, S. Laruelle, M. Armand, F. Wudl and J.-M. Tarascon, J. Mater. Chem., 2011, 21, 1615–1620 RSC
.
- K. Pirnat, R. Dominko, R. Cerc-Korosec, G. Mali, B. Genorio and M. Gaberscek, J. Power Sources, 2012, 199, 308–314 CrossRef CAS
.
- Z. Song, H. Zhan and Y. Zhou, Angew. Chem., Int. Ed., 2010, 49, 8444–8448 CrossRef CAS PubMed
.
- Z. Ahmad and J. E. Mark, Chem. Mater., 2001, 13, 3320–3330 CrossRef CAS
.
- N. Asano, M. Aoki, S. Suzuki, K. Miyatake, H. Uchida and M. Watanabe, J. Am. Chem. Soc., 2006, 128, 1762–1769 CrossRef CAS PubMed
.
- X. Han, C. Chang, L. Yuan, T. Sun and J. Sun, Adv. Mater., 2007, 19, 1616–1621 CrossRef CAS
.
- M. Armand, S. Grugeon, H. Vezin, S. Laruelle, P. Ribière, P. Poizot and J. M. Tarascon, Nat. Mater., 2009, 8, 120–125 CrossRef CAS PubMed
.
- F. Fu, Q. Wang, Y.-P. Deng, C.-H. Shen, X.-X. Peng, L. Huang and S.-G. Sun, J. Mater. Chem. A, 2015, 3, 5197–5203 RSC
.
- Q. Fang, Z. Zhuang, S. Gu, R. B. Kaspar, J. Zheng, J. Wang, S. Qiu and Y. Yan, Nat. Commun., 2014, 5, 4503–4510 CrossRef PubMed
.
- C. Chen, X. Zhao, H.-B. Li, F. Gan, J. Zhang, J. Dong and Q. Zhang, Electrochim. Acta, 2017, 229, 387–395 CrossRef CAS
.
- B. Shrimant, U. K. Kharul and P. P. Wadgaonkar, J. Polym. Sci., Part A: Polym. Chem., 2018, 56, 1721–1729 CrossRef CAS
.
- K. V. Rao, R. Haldar, C. Kulkarni, T. K. Maji and S. J. George, Chem. Mater., 2012, 24, 969–971 CrossRef CAS
.
- B. Gole, V. Stepanenko, S. Rager, M. Grune, D. D. Medina, T. Bein, F. Wurthner and F. Beuerle, Angew. Chem., Int. Ed., 2018, 57, 846–850 CrossRef CAS PubMed
.
- Y. Luo, B. Li, L. Liang and B. Tan, Chem. Commun., 2011, 47, 7704–7706 RSC
.
- D.-H. Yang, Z.-Q. Yao, D. Wu, Y.-H. Zhang, Z. Zhou and X.-H. Bu, J. Mater. Chem. A, 2016, 4, 18621–18627 RSC
.
- S. Lei, X. Cui, X. Liu, X. Zhang, X. Han and Y. Yang, Chem. Commun., 2020, 56, 1429–1432 RSC
.
- Y. Huang, K. Li, J. Liu, X. Zhong, X. Duan, I. Shakir and Y. Xu, J. Mater. Chem. A, 2017, 5, 2710–2716 RSC
.
- G. Wang, N. Chandrasekhar, B. P. Biswal, D. Becker, S. Paasch, E. Brunner, M. Addicoat, M. Yu, R. Berger and X. Feng, Adv. Mater., 2019, 31, 1901478–1901483 CrossRef PubMed
.
- S. Wang, Q. Wang, P. Shao, Y. Han, X. Gao, L. Ma, S. Yuan, X. Ma, J. Zhou, X. Feng and B. Wang, J. Am. Chem. Soc., 2017, 139, 4258–4261 CrossRef CAS PubMed
.
- D. J. Kim, K. R. Hermann, A. Prokofjevs, M. T. Otley, C. Pezzato, M. Owczarek and J. F. Stoddart, J. Am. Chem. Soc., 2017, 139, 6635–6643 CrossRef CAS PubMed
.
- Y. Meng, H. Wu, Y. Zhang and Z. Wei, J. Mater. Chem. A, 2014, 2, 10842–10846 RSC
.
- D. Tian, H. Z. Zhang, D. S. Zhang, Z. Chang, J. Han, X. P. Gao and X. H. Bu, RSC Adv., 2014, 4, 7506–7510 RSC
.
- T. B. Schon, A. J. Tilley, C. R. Bridges, M. B. Miltenburg and D. S. Seferos, Adv. Funct. Mater., 2016, 26, 6896–6903 CrossRef CAS
.
- T. B. Schon, A. J. Tilley, E. L. Kynaston and D. S. Seferos, ACS Appl. Mater. Interfaces, 2017, 9, 15631–15637 CrossRef CAS PubMed
.
- Y. Ding, Y. Li and G. Yu, Chem, 2016, 1, 790–801 CAS
.
- X. Han, G. Qing, J. Sun and T. Sun, Angew. Chem., Int. Ed., 2012, 51, 5147–5151 CrossRef CAS PubMed
.
- V. Augustyn, J. Come, M. A. Lowe, J. W. Kim, P.-L. Taberna, S. H. Tolbert, H. D. Abruña, P. Simon and B. Dunn, Nat. Mater., 2013, 12, 518–522 CrossRef CAS PubMed
.
- D. Chao, C. Zhu, P. Yang, X. Xia, J. Liu, J. Wang, X. Fan, S. V. Savilov, J. Lin, H. J. Fan and Z. X. Shen, Nat. Commun., 2016, 7, 12122–12129 CrossRef CAS PubMed
.
- Y. Song, S. Bai, L. Zhu, M. Zhao, D. Han, S. Jiang and Y.-N. Zhou, ACS Appl. Mater. Interfaces, 2018, 10, 13606–13613 CrossRef CAS PubMed
.
Footnote |
| † Electronic supplementary information (ESI) available: Experimental details and supplementary figures. See DOI: 10.1039/d1ma00554e |
| This journal is © The Royal Society of Chemistry 2021 |

