 Open Access Article
N-Doped hierarchical porous carbon nanoscrolls towards efficient oxygen reduction reaction in Zn–air batteries via interior and exterior modifications†
Binhong
He‡
,
Yangyang
Chen‡
,
Da
Hu
,
Ziyan
Wen
,
Minjie
Zhou
 * and
Wenyuan
Xu
*
Key Laboratory of Hunan Province for Advanced Carbon, based Functional Materials, School of Chemistry and Chemical Engineering, Hunan Institute of Science and Technology, Yueyang 414006, Hunan, China. E-mail: zmj0104@126.com; wenyuanxu@126.com
First published on 31st August 2021
Abstract
Rational design of oxygen reduction reaction (ORR) electrocatalysts is essential for promoting the development of clean energy conversion devices. Herein, we report an in situ sacrificial template strategy combined with external NH3 activation to controllably prepare etched N-doped hierarchical porous carbon nanoscrolls (EN-PCNS) with excellent ORR activity. Systematic investigation and analysis reveal that the interior and exterior modifications enhance the interaction between the inner and outer sides of EN-PCNS. Benefiting from the unique hierarchical porous structure, much higher number of structural defects, high specific surface area, and diverse N-doping configurations, the delicately designed catalyst shows superior ORR activity (the half potential moves positively to 0.82 V and the limiting current density is 5.15 mA cm−2) and Zn–air battery performance (the peak power density reaches 139 mW cm−2) than the commercial Pt/C catalyst. This work paves a new way towards the effective design of high-performance carbon-based catalysts for enhancing the ORR and developing clean energy conversion devices.
1 Introduction
Electrochemical oxygen reduction reaction (ORR) plays as a key role in many efficient energy storage and conversion systems, such as fuel cells and metal–air batteries.1,2 In general, ORR kinetics largely determines the working efficiency of the whole cell, thereby driving research on electrocatalysis with improved ORR performance. Among various candidates, N-doped carbon electrocatalysts are efficient non-metallic ORR electrode materials.3,4 Theoretical and experimental studies have shown that large specific surface area (SSA) and special morphology can provide many accessible active sites and are beneficial to the effective mass transport of a substrate in the catalyst, thereby significantly improving the electrochemical performance.5,6In recent years, the pyrolysis of C- and N-containing polymers (such as polypyrrole, polyaniline, polydopamine, etc.) to obtain N-doped carbon is a common method due to the facile doping procedure and uniform doping state. However, the N content is typically low due to the easy loss of N at high temperatures (depending on the precursor and temperature, 3–9 at%).7,8 Previous studies have shown that the template method is an effective method to adjust the morphology and structure of N-doped carbon materials. The introduction of a template can effectively increase SSA and is conducive to the formation of mesopores, which facilitates electrolyte infiltration, ion transfer and exposure of catalytic sites, thus boosting the ORR process.9,10 Despite their advances, the removal of the template involves the use of strong corrosive agents (for instance, SiO2 templates are removed by HF etching) or soaking in organic solvents for a long time, which is a hazardous, non-environmentally friendly and complicated process.11,12 Particularly, the morphology of the carbon material may be damaged during the template removal process.
In order to solve the above-mentioned problems and obtain electrode materials with a desired morphology, the sacrificial template method is regarded as an effective method. Recent studies have shown that the formation of a porous structure is carried out in parallel with the carbonization process of the precursor and no additional step is required to remove the sacrificial template.13,14 Kuang et al.15 demonstrated that Fe–N-doped carbon microspheres (Fe–N-DSC) with porous structures, high SSAs and high N contents can be obtained by the pyrolysis process using Fe3O4 nanospheres as the sacrificial template. Xu et al.16 prepared graphene nanoscrolls by the self-curling effect of a layered structure. The sublimation of ice and the free-standing nature of dispersive reduced graphene sheets are the main driving forces to induce the self-scrolling of reduced graphene sheets to form nanoscrolls. Furthermore, the modification of the template (such as heteroatom doping) can also increase its SSA and the number of structural defects, and adjust the pore structure, thereby changing the morphology, structure and composition of the carbon material.17–20
The etching strategy is regarded as an effective route to further modifying the external morphology, structure and composition of N-doped carbon. Several studies have shown that the etching of carbon materials mostly occurs in relatively active sites (such as intrinsic and non-intrinsic defects, etc.). Proper etching can increase the SSA and provide rich porosity for carbon materials.21,22 Moreover, the chemical composition of the surface/interface of the carbon material can also be adjusted. N-doped porous carbon was obtained by high-temperature pyrolysis of cellulose under an NH3 atmosphere; a possible etching mechanism was proposed as follows: 3C + 4NH3 → 2N2 + 3CH4. Meanwhile, NH3 etching could increase the SSA and alter the structure and composition of the obtained N-doped carbon products.23 Thus, by designing an appropriate process to obtain N-doped carbon materials with excellent morphology, structure and composition, high-performance ORR can be achieved.
Herein, we report the combination of an in situ sacrificial template method and NH3 etching to controllably synthesize etched N-doped hierarchical porous carbon nanoscrolls (EN-PCNS) by using pyrrole and N-doped g-C3N4-m (NCN-m, where m represents the mass of citric acid monohydrate) as the precursor and the template, respectively. We focused on the influence of the NCN sacrificial template and NH3 etching on the internal and external morphology, structure and composition of EN-PCNS. The results clearly indicate that accurate control of the amount of citric acid can achieve the controllable preparation of functional N-doped carbon products. Specifically, the use of NCN as a sacrificial template can prevent carbon nanosheets from agglomeration during high-temperature pyrolysis. Moreover, during the carbonization of PPY, the volatilization of NCN promotes the curling of carbon nanosheets, forms a porous structure of N-PCNS, and effectively increases the graphitic N content in N-PCNS. After NH3 etching, large numbers of micropores and structural defects are generated in the obtained EN-PCNS. In addition, the morphology and doping configuration are altered. As a result, the prepared EN-PCNS have a higher defect density, a unique hierarchical porous structure, a large SSA and N-doping configuration, thereby further improving the ORR performance. Importantly, EN-PCNS have superior ORR activity, excellent durability and methanol tolerance comparable to commercial Pt/C electrocatalysts. In addition, it also reveals a higher peak power density in Zn–air batteries. This work paves a new way towards the effective design of high-performance carbon-based catalysts for enhancing the ORR and developing clean energy conversion devices.
2 Experimental section
2.1 Synthesis of NCN-m
N-doped g-C3N4 (NCN) was synthesized according to a previously reported method.24 Briefly, 10 g of urea powder and 40 mg of citric acid monohydrate were dissolved in deionized water. After drying, the obtained compound was placed into an aluminum foil-wrapped crucible with a lid and then heated under static air at 550 °C for 2 h to obtain the sample (NCN-40) in a muffle furnace. Other NCN-m samples (m represents the mass of citric acid monohydrate) were synthesized in the same way with different masses of citric acid monohydrate (20, 60 and 80 mg, respectively). g-C3N4 (CN) was obtained by a similar method without the addition of citric acid monohydrate.2.2 Synthesis of N-PCNS-m and EN-PCNS
First, 240 mg of NCN-m was dispersed in 90 mL of deionized water and then 180 μL of pyrrole (PY) was added. After ultrasound stirring for ∼1.5 h, 6 mL of 12 M HCl was added slowly. Subsequently, 1.8 g of (NH4)2S2O8 was slowly added to the above suspension under ice bath conditions. After reacting for 12 h, the black product polypyrrole (PPY)/NCN-m compounds were separated by centrifugation. The obtained PPY/NCN-m compounds were annealed under N2 flow at 900 °C for 2 h to obtain N-doped hierarchical porous carbon nanoscrolls (N-PCNS-m). Finally, the N-PCNS-40 sample was etched at 900 °C to obtain EN-PCNS under an NH3 atmosphere. N-doped multi-hole carbon (NMC) was also prepared via a similar approach using CN as the template. Besides, N-doped carbon (NC) was synthesized by a preparation method similar to that of N-PCNS-m without adding NCN-m.3 Results and discussion
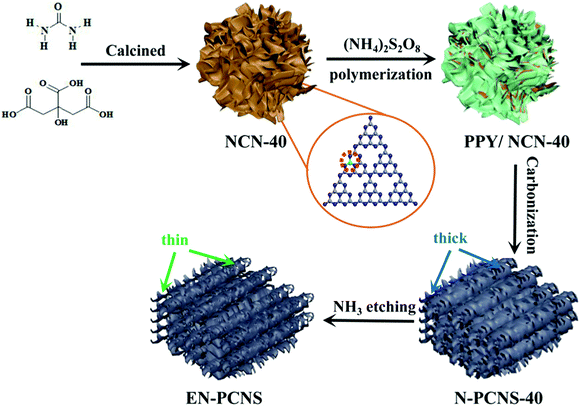
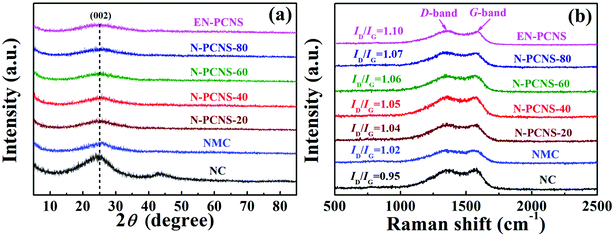
Fig. 1 shows the synthetic scheme of EN-PCNS via the sacrificial-template method and NH3 etching. First, the NCN-40 template was fabricated by thermal polymerization and decomposition of a urea/citric acid monohydrate mixture; N-doped hierarchical porous carbon nanoscrolls (N-PCNS-40) were prepared by the polymerization of PY in the presence of NCN-40, followed by the calcination of the PPY/NCN-40 hybrid at 900 °C under N2 flow. Finally, N-PCNS-40 was etched to obtain EN-PCNS under an NH3 atmosphere.Fig. 2a shows the XRD patterns of NC, NMC, N-PCNS-m and EN-PCNS. A representative (002) diffraction peak at 2θ = 24.8° emerges in the XRD pattern of NC. Regarding N-doped carbon materials obtained by using the CN template, the intensity of this peak for NMC becomes slightly weaker, which means that the crystallinity is reduced.25 When using NCN-m as templates, these peaks further weaken with the increase of citric acid content, implying that NCN can further reduce crystallinity. With regard to EN-PCNS, this peak almost disappears, confirming that NH3 etching reduces the degree of graphitization. More structural information was obtained by Raman spectroscopy. The Raman spectra of NC, NMC, N-PCNS-m and EN-PCNS (Fig. 2b) present two typical characteristic peaks at 1350 and 1580 cm−1, which correspond to D and G bands, respectively. In addition, ID/IG signifies the defect density of the carbon sample. Defects within the carbon framework play a key role as active sites in electrocatalytic ORR and determine the catalytic activity.26,27 The ID/IG intensity ratio of NC is 0.95, while for NMC this intensity ratio is increased to 1.02, indicating that the addition of CN is beneficial to the exposure of structural defects and increase of carbon porosity. Furthermore, when using NCN-m as templates, the ID/IG values of the obtained N-PCNS-20, N-PCNS-40, N-PCNS-60 and N-PCNS-80 further increase to 1.04, 1.05, 1.06 and 1.07, respectively. After NH3 etching, the ID/IG value of the obtained EN-PCNS further increases to 1.10, substantiating that subsequent NH3 etching can lead to the formation of more structural defects in EN-PCNS. Clearly, the Raman result is consistent with the XRD analysis results.
Fig. 3a displays the SEM image of NC. It is apparent that the huge masses are stacked by carbon nanosheets. It is worth noting that NMC exhibits a crimped porous structure (Fig. 3b), which is attributed to the introduction of the CN template. When using NCN-m as templates, the curling phenomenon and porous structure for N-PCNS-m become clearer, as shown in Fig. 3c and Fig. S1 (ESI†). In particular, N-PCNS-40 was similar to nano-rolls (Fig. S2a, ESI†), and the morphology is clearly shown in Fig. 3e (marked with a white dotted region). Clearly, the formation of the crimped porous structure is conducive to the increase of SSA and exposure of more effective catalytic sites. After NH3 etching, EN-PCNS show a similar crimped porous structure (Fig. 3d). Compared with N-PCNS-40, the carbon layer of EN-PCNS appears thinner and curls more severely, as shown in Fig. 3f and Fig. S2b (ESI†). Fig. S2c and d (ESI†) show the HRTEM images of N-PCNS-40 and EN-PCNS, respectively. In contrast, EN-PCNS exhibit a structure with relatively abundant micropores (marked by red circles) and lower graphitized states.
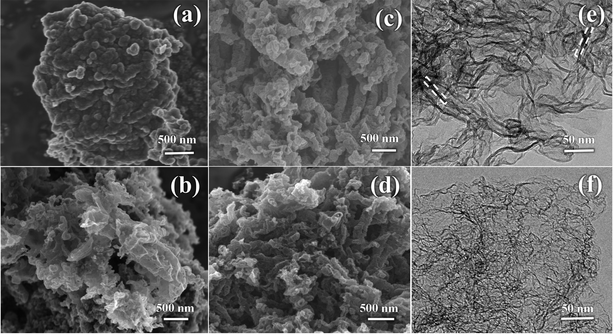 | ||
| Fig. 3 SEM images of NC (a), NMC (b), N-PCNS-40 (c) and EN-PCNS (d); TEM images of N-PCNS-40 (e) and EN-PCNS (f). | ||
N2 adsorption/desorption isotherms were measured to analyze the surface properties of the samples, as shown in Fig. 4a. Clearly, all the samples show a closed hysteresis loop, belonging to type-IV isothermal curves, indicating porous characteristics.28 As can be seen from Table S1 (ESI†), compared with NC (21.8 m2 g−1), the SSA of NMC increases sharply to 256.5 m2 g−1, clearly indicating that the introduction of the CN template reduces the accumulation of carbon blocks. When using NCN-40 as the template, the SSA of N-PCNS-40 is expanded to 497.3 m2 g−1. This result may be attributed to the fact that the high N content in NCN-40 leads to an increase of NH3, etc. produced during the pyrolysis process and promotes the formation of more pore structures, thereby improving the SSA of N-PCNS-40. Clearly, the above results are consistent with those of the SEM analysis. In addition, the SSA of EN-PCNS is significantly improved to 945.3 m2 g−1 after NH3 etching, indicating that appropriate NH3 etching can cause rich porosity and notably increase the SSA. Fig. 4b shows the corresponding pore size distribution curves. Compared with NC and NMC, N-PCNS-40 is confirmed to show obvious peaks positioned at ∼3.8 nm and ∼13.4 nm, confirming abundant mesoporous properties. After NH3 etching, EN-PCNS shows a distinct hierarchical pore structure; micropores are concentrated at ∼1.2 nm and mesopores are concentrated at ∼7.0 nm, again proving that NH3 etching can produce abundant micropores and further increase the SSA. This result is also very consistent with those of the TEM analysis.
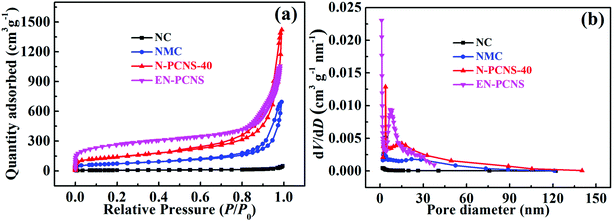 | ||
| Fig. 4 (a) N2 adsorption/desorption isothermal curves and (b) pore size distribution curves of the NC, NMC, N-PCNS-40, and EN-PCNS samples. | ||
XPS survey was performed to analyze the elemental compositions and element states of NMC, N-PCNS-m and EN-PCNS. As shown in Fig. 5a, the C 1s, O 1s and N 1s peaks appear in all the samples. Table S2 (ESI†) shows specific XPS results. As for NMC (11.1 at%), the N content of N-PCNS-20 (11.5 at%) is slightly increased, which may be caused by the increased N content in N-doped CN. The N contents of N-PCNS-40 (11.1 at%), N-PCNS-60 (9.1 at%) and N-PCNS-80 (8.5 at%) decrease with the increase of citric acid content. This result also coincides with the results of the N2 adsorption/desorption isothermal curve analysis. After NH3 etching, the N content in EN-PCNS (5.5 at%) decreases rapidly, which is mainly due to the removal of some unstable structures (such as N- or O-containing groups) by NH3 etching at high temperatures.29,30 To further confirm the influence of NCN-m templates and NH3 etching on N-doping configuration, the N 1s spectra of all the samples were fitted into four types of N-doping configurations: pyridinic N (398.1 eV), pyrrolic N (399.8 eV), graphitic N (401.0 eV) and oxygenated N (403.0 eV).31,32Fig. 5b–d and Fig. S3 (ESI†) show the high-resolution N 1s spectra of NMC, N-PCNS-40, EN-PCNS, N-PCNS-20, N-PCNS-60 and N-PCNS-80, respectively. Table S3 (ESI†) shows specific fitting results. The sum of the percentages of pyridinic N and graphitic N in N-PCNS-40 (70.3%) is higher than that of NMC (61.9%), N-PCNS-20 (64.4%), N-PCNS-60 (67.6%) and N-PCNS-80 (65.1%). Previous studies demonstrated that pyridinic N facilitates the adsorption of oxygen molecules and promotes the breaking of O–O bonds, while graphitic N can improve the conductivity and boost the transport of electrons and ions.33–35 Interestingly, with NH3 etching, the relative amount of graphitic N increased from 46.5% for N-PCNS-40 to 54.5% for EN-PCNS. Although the influence of NCN on the internal structure of carbon materials and the surface chemical details that occur during NH3 etching are still elusive, these results clearly show that the modification of the internal structure of carbon materials by NCN not only increases the SSA, but also drives the carbon materials to form the curling morphology. Meanwhile, the modification of the external structure of carbon materials by NH3 etching improves the pore structure and restructures the surface functionalities, which are essential for enhancing the ORR activity.
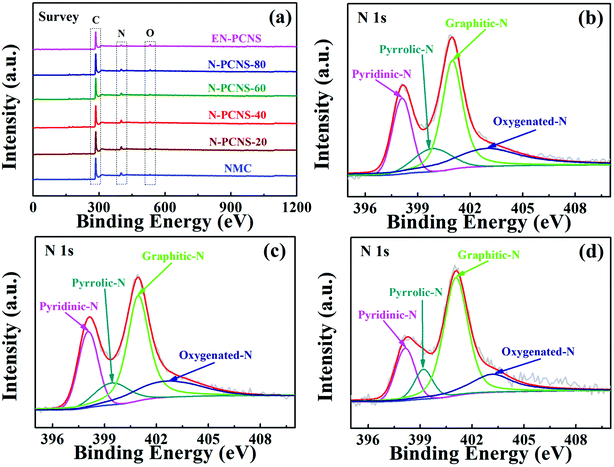 | ||
| Fig. 5 (a) XPS survey spectra of the NMC, N-PCNS-m and EN-PCNS samples; high-resolution N 1s spectra of NMC (b), N-PCNS-40 (c) and EN-PCNS (d). | ||
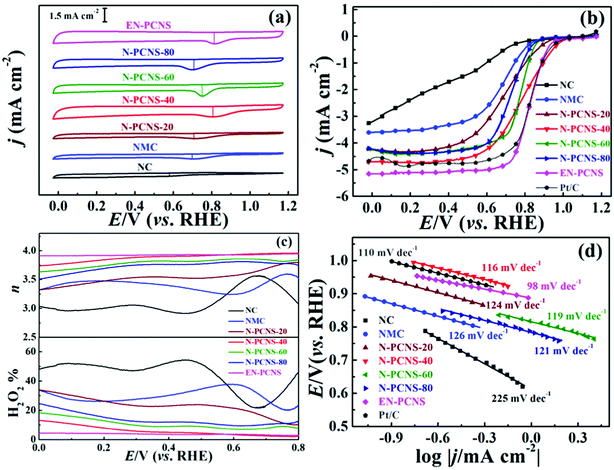
To detect the effects of different CN templates and NH3 etching on the ORR performance of the samples, the RDE and RRDE techniques are used in our test. Fig. 6a shows the CV curves on NC, NMC, N-PCNS-m, EN-PCNS and commercialized Pt/C electrodes in N2 and O2 saturated 0.1 M KOH electrolytes. All the samples tested in the N2 saturated electrolyte display a quasi-rectangular voltammogram, whereas, when O2 is introduced into the electrolyte, a cathodic reduction peak is observed in all the CV curves, demonstrating that the samples possess oxygen reduction activity. The reduction peak for the N-PCNS-40 electrode (0.80 V) is clearly more positive than those for NC (0.58 V), NMC (0.69 V), N-PCNS-20 (0.70 V), N-PCNS-60 (0.75 V) and N-PCNS-80 (0.71 V) electrodes. After NH3 etching, the reduction peak of EN-PCNS increases to 0.81 V, which is comparable to commercial Pt/C catalysts (0.83 V). Fig. 6b shows the linear scan voltammogram (LSV) curves on NC, NMC, N-PCNS-m, EN-PCNS and commercialized Pt/C electrodes at a rotational speed of 1600 rpm. The limiting current density of N-PCNS-40 is as high as 4.70 mA cm−2 and the onset potential is 1.04 V. Clearly, these performances are better than those of the other counterparts. The half potential for the N-PCNS-40 electrode (0.79 V) is visibly more positive than those for NC (0.42 V), NMC (0.68 V), N-PCNS-20 (0.70 V), N-PCNS-60 (0.78 V) and N-PCNS-80 (0.73 V) electrodes. Surprisingly, after NH3 etching, EN-PCNS exhibit the best ORR performance, with a similar half potential (0.82 V) and an excellent limiting current density (5.15 mA cm−2). Meanwhile, compared with the Pt/C electrodes (0.83 V and 5.97 mA cm−2), it displays comparable ORR performance. To further verify the ORR process of different N-doped carbon catalysts, the hydrogen peroxide production and the n values of NC, NMC, N-PCNS-m, EN-PCNS and commercialized Pt/C electrodes were detected using RRDE technology (Fig. S4, ESI† and Fig. 6c). To further verify the ORR process of the sample, the H2O2 yield and electron transfer number (n) value are also important reference values. The H2O2% value of N-PCNS-40 is around ∼4.4% at 0.5 V, while this value clearly increases to ∼51.6% for NC, ∼34.6% for NMC, ∼24.0% for N-PCNS-20, ∼9.0% for N-PCNS-60 and ∼11.6% for N-PCNS-80. Simultaneously, the calculated n values for N-PCNS-40 are about 3.8–3.5 in the potential range from 0.7 to 0![[thin space (1/6-em)]](https://www.rsc.org/images/entities/char_2009.gif) V. In addition, the H2O2% yield value of EN–PCNS is further reduced to 2.2%, and the n in the potential range of 0.7–0 V is 3.8–4.0. These results display that the electrocatalytic process of EN-PCNS is an improved 4e− pathway for the ORR.
V. In addition, the H2O2% yield value of EN–PCNS is further reduced to 2.2%, and the n in the potential range of 0.7–0 V is 3.8–4.0. These results display that the electrocatalytic process of EN-PCNS is an improved 4e− pathway for the ORR.
To evaluate the ORR kinetics, the LSV curves of these samples at different speeds were tested, as shown in Fig. S5 and Fig. S6a–c (ESI†). According to the K–L equation, the n values for all samples were calculated at 0.2 V (vs. RHE) (Fig. S6d, ESI†). The n values of NC (3.10), NMC (3.40), N-PCNS-20 (3.47), N-PCNS-40 (3.82), N-PCNS-60 (3.63), N-PCNS-80 (3.52) and EN-PCNS (4.00) reflect the high reaction selectivity of EN-PCNS. In addition, Fig. S7 (ESI†) shows the K–L plots of the EN-PCNS electrode at different potentials from 0.1 to 0.4 V. The value of n fluctuates in the range of 3.9–4.0, indicating that it is close to the four-electron transfer path. Fig. 6d shows that the Tafel slopes for the NC, NMC, N-PCNS-20, N-PCNS-40, N-PCNS-60, N-PCNS-80, EN-PCNS and commercial Pt/C catalysts were 255, 126, 124, 116, 119, 121, 98 and 100 mV dec−1, respectively. Apparently, the EN-PCNS catalyst possesses a faster electron transfer rate. Furthermore, to demonstrate the excellent ORR performance of EN-PCNS, the performance of other reported carbon-based catalysts are also shown in Table S4 (ESI†).
Cycling stability and resistance to methanol poisoning are important parameters for evaluating the performance of ORR electrocatalysts. After 4500 cycles of the EN-PCNS electrode, the shape of the CV curve is not significantly weakened, suggesting outstanding cycling stability as shown in Fig. S8a (ESI†). Fig. S8b (ESI†) displays the i–t curves on EN-PCNS and Pt/C electrodes. After 40000 s testing, the current loss of the EN-PCNS electrode (∼6%) is clearly lower than that of the Pt/C electrode (∼19%), again showing excellent stability. Fig. S9 (ESI†) shows the i–t curves on EN-PCNS and Pt/C electrodes at 0.67 V (vs. RHE). After adding 3 M methanol at 450 s, no noticeable change was observed in the current of the EN-PCNS electrode, manifesting excellent resistance to methanol poisoning. In contrast, Pt/C exhibits an instantaneous current transition after methanol is added, implying the start of the methanol oxidation reaction.
Based on the above-mentioned analysis, the improved ORR performance for EN-PCNS can be attributed to the following: (1) the NCN template not only produces a large number of structural defects for NC, but also drives the self-curling of NC; (2) subsequent NH3 etching controls the external morphology and structure of EN-PCNS and endows the product with a unique hierarchical porous structure, a high defect density, and a large SSA. Moreover, the inherent activity from EN-PCNS and fully exposed efficient catalytic sites further enhance the ORR performance.
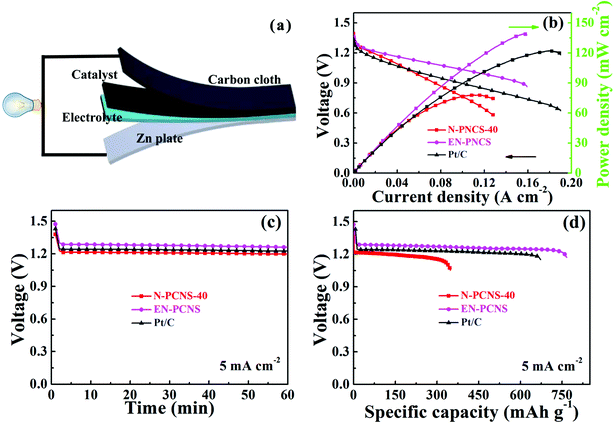
Finally, EN-PCNS were utilized to assemble Zn–air batteries (ZABs) to investigate their practical application (Fig. 7a). As shown in Fig. S10 (ESI†), the open circuit potential of the N-PCNS-40 catalyst remains at ∼1.35 V after 10 hours. The open circuit voltage of EN-PCNS remains constant at ∼1.47 V, which is better than that of commercialized Pt/C (1.39 V after 10 h). In addition, Fig. S11 (ESI†) shows the charging/discharging cycling curves of EN-PCNS and commercialized Pt/C at 0.5 mA cm−2 for ZABs. The EN-PCNS catalyst exhibits excellent stability, and the potential changed slightly after more than 600 min (32 cycles), which is also superior to the commercial Pt/C catalyst because it can be operated for only less than 450 min. Fig. 7b shows the discharge polarization curves and the corresponding power density curves. The ZABs driven by EN-PCNS display a peak power density of 139 mW cm−2, which far exceeds that of the ZABs driven by N-PCNS-40 (73 mW cm−2). Surprisingly, this peak power density is also slightly higher than that of commercial Pt/C (122 mW cm−2). Fig. 7c shows the galvanostatic discharge curves of N-PCNS-40, EN-PCNS and Pt/C electrocatalysts. It can be observed that the EN-PCNS electrocatalyst displays a better ZAB performance. According to Fig. 7d, long-term galvanostatic discharge curves at 5 mA cm−2 with the three different catalysts were also recorded. Normalized to the mass of consumed Zn, the specific capacity of the EN-PCNS electrocatalyst (766 mA h gZn−1) exceeds those of the N-PCNS-40 (348 mA h gZn−1) and Pt/C (673 mA h gZn−1) electrocatalysts. Apparently, the above results show that the EN-PCNS catalyst designed in this work is a very competitive substitute for commercial Pt/C and can be used in the practical application of metal–air batteries.
4 Conclusion
In summary, etched N-doped hierarchical porous carbon nanoscrolls (EN-PCNS) are controllably synthesized by combining the internal template modification with external NH3 activation. The sacrificial template produces a large number of structural defects and drives the self-curling for NC. Meanwhile, the morphology, N-doping configuration, and doping content can be adjusted by increasing the amount of citric acid. Moreover, the external NH3 etching further increases the SSA and generates a large number of structural defects. The interior and exterior modifications enhance the interaction between inner and outer sides of EN-PCNS, synergistically contributing to the ORR performance. When assembled as the cathode catalyst for Zn–air batteries, it also demonstrates better performance than commercial Pt/C catalysts. This work offers a new strategy for the rational design of high-performance carbon-based ORR electrocatalysts and has great potential for the practical application of clean energy conversion devices.Conflicts of interest
The authors declare no conflicts of interest.Acknowledgements
This work was financially supported by the National Natural Science Foundation of China (No. 51972109 and 52072120), Hunan Provincial Natural Science Foundation of China (No. 2019JJ40102 and 2020JJ4336), and the Scientific Research Fund of Hunan Provincial Education Department, China (No. 19A203, 19A205, and 20A225).References
- M. M. Liu, L. L. Wang, K. N. Zhao, S. S. Shi, Q. S. Shao, L. Zhang, X. L. Sun, Y. F. Zhao and J. J. Zhang, Atomically dispersed metal catalysts for the oxygen reduction reaction: synthesis, characterization, reaction mechanisms and electrochemical energy applications, Energy Environ. Sci., 2019, 12, 2890–2923 RSC.
- Y. J. Xue, S. S. Sun, Q. Wang, Z. H. Dong and Z. P. Liu, Transition metal oxide–based oxygen reduction reaction electrocatalysts for energy conversion systems with aqueous electrolytes, J. Mater. Chem. A, 2018, 6, 10595–10626 RSC.
- Y. Y. Chen, C. X. Xu, Z. H. Hou, M. J. Zhou, B. H. He, W. Wang, W. Q. Ren, Y. P. Liu, L. Chen and W. Y. Xu, 3D N, S–co–doped carbon nanotubes/graphene/MnS ternary hybrid derived from Hummer’ method for highly efficient oxygen reduction reaction, Mater. Today Energy, 2020, 16, 100402 CrossRef.
- Z. Li, W. Wang, M. J. Zhou, B. H. He, W. Q. Ren, L. Chen, W. Y. Xu, Z. H. Hou and Y. Y. Chen, In situ self–templated preparation of porous core–shell Fe1−xS@N, S co–doped carbon architecture for highly efficient oxygen reduction reaction, J. Energy Chem., 2021, 54, 310–317 CrossRef.
- D. H. Guo, R. Shibuya, C. Akiba, S. Saji, T. Kondo and J. Nakamura, Active sites of nitrogen–doped carbon materials for oxygen reduction reaction clarified using model catalysts, Science, 2016, 351, 361–365 CrossRef CAS PubMed.
- S. K. Singh, K. Takeyasu and J. Nakamura, Active sites and mechanism of oxygen reduction reaction electrocatalysis on nitrogen–doped carbon materials, Adv. Mater., 2019, 31, 1804297 CrossRef PubMed.
- C. G. Hu, Y. Lin, J. W. Connell, H. M. Cheng, Y. Gogotsi, M. M. Titirici and L. M. Dai, Carbon–based metal–free catalysts for energy storage and environmental remediation, Adv. Mater., 2019, 31, 1806128 CrossRef PubMed.
- L. Chen, Y. Y. Chen, C. X. Xu, W. Wang, W. B. Fu, W. Q. Hu, M. J. Zhou, B. H. He, Q. Chen, Z. H. Hou and W. Y. Xu, Etching engineering on controllable synthesis of etched N–doped hierarchical porous carbon toward efficient oxygen reduction reaction in zinc–air batteries, Mater. Today Energy, 2021, 20, 100670 CrossRef CAS.
- H. W. Liang, X. D. Zhuang, S. Bruller, X. L. Feng and K. Mullen, Hierarchically porous carbons with optimized nitrogen doping as highly active electrocatalysts for oxygen reduction, Nat. Commun., 2014, 5, 1–7 Search PubMed.
- T. T. Guan, J. H. Zhao, G. L. Zhang, J. L. Wang, D. D. Zhang and K. X. Li, Template–free synthesis of honeycomblike porous carbon rich in specific 2–5 nm mesopores from a pitch–based polymer for a high–performance supercapacitor, ACS Sustainable Chem. Eng., 2018, 7, 2116–2126 CrossRef.
- W. Wei, H. W. Liang, K. Parvez, X. D. Zhuang, X. L. Feng and K. Müllen, Nitrogen–doped carbon nanosheets with size–defined mesopores as highly efficient metal–free catalyst for the oxygen reduction reaction, Angew. Chem., 2014, 126, 1596–1600 CrossRef.
- G. Wang, Y. H. Sun, D. B. Li, H. W. Liang, R. H. Dong, X. L. Feng and K. Müllen, Controlled synthesis of N–doped carbon nanospheres with tailored mesopores through self–assembly of colloidal silica, Angew. Chem., 2015, 127, 15406–15411 CrossRef.
- M. Oschatz, J. T. Lee, H. Kim, W. Nickel, L. Borchardt, W. I. Cho, C. Ziegler, S. Kaskel and G. Yushin, Micro– and mesoporous carbide–derived carbon prepared by a sacrificial template method in high performance lithium sulfur battery cathodes, J. Mater. Chem. A, 2014, 2, 17649–17654 RSC.
- Y. B. Zhao, Y. Yuan, Y. M. Xu, G. Y. Zheng, Q. Zhang, Y. Q. Jiang, Z. Y. Wang, N. S. Bu, L. X. Xia and Z. J. Yan, Fine–regulating ultramicropores in porous carbon via a self–sacrificial template route for high–performance supercapacitors, Nanoscale, 2021, 13, 1961–1969 RSC.
- Z. Huang, H. Y. Pan, W. J. Yang, H. H. Zhou, N. Gao, C. P. Fu, S. C. Li, H. X. Li and Y. F. Kuang, In situ self–template synthesis of Fe–N–doped double–shelled hollow carbon microspheres for oxygen reduction reaction, ACS Nano, 2018, 12, 208–216 CrossRef CAS PubMed.
- Z. Xu, B. N. Zheng, J. W. Chen and C. Gao, Highly efficient synthesis of neat graphene nanoscrolls from graphene oxide by well–controlled lyophilization, Chem. Mater., 2014, 26, 6811–6818 CrossRef CAS.
- Y. H. Qu, Z. A. Zhang, K. Du, W. Chen, Y. Q. Lai, Y. X. Liu and J. Li, Synthesis of nitrogen–containing hollow carbon microspheres by a modified template method as anodes for advanced sodium–ion batteries, Carbon, 2016, 105, 103–112 CrossRef CAS.
- Y. L. Yan, Y. Q. Wei, C. Zhao, M. M. Shi, L. P. Chen, C. J. Fan, M. J. Carnie, R. Yang and Y. H. Xu, A modified template-removal process to improve the specific surface area and hierarchical porosity of carbon materials, J. Solid State Chem., 2019, 269, 24–29 CrossRef CAS.
- S. F. Wang, Y. J. Sha, Y. L. Zhu, X. M. Xu and Z. P. Shao, Modified template synthesis and electrochemical performance of a Co3O4/mesoporous cathode for lithium–oxygen batteries, J. Mater. Chem. A, 2015, 3, 16132 RSC.
- M. R. Maschmann, A. D. Franklin, P. B. Amama, D. N. Zakharov, E. A. Stach, T. D. Sands and T. S. Fisher, Vertical single–and double–walled carbon nanotubes grown from modified porous anodic alumina templates, Nanotechnology, 2006, 17, 3925–3929 CrossRef CAS.
- Y. Dong, Q. J. Zhang, Z. Q. Tian, B. R. Li, W. S. Yan, S. Wang, K. M. Jiang, J. W. Su, C. W. Oloman, E. L. Gyenge, R. X. Ge, Z. Y. Lu, X. L. Ji and L. Chen, Ammonia thermal treatment toward topological defects in porous carbon for enhanced carbon dioxide electroreduction, Adv. Mater., 2020, 32, 2001300 CrossRef CAS PubMed.
- W. X. Yang, J. H. Zhou, S. Wang, W. Y. Zhang, Z. C. Wang, F. Lv, K. Wang, Q. Sun and S. J. Guo, Freestanding film made by necklace–like N–doped hollow carbon with hierarchical pores for high–performance potassium-ion storage, Energy Environ. Sci., 2019, 12, 1605–1612 RSC.
- W. Luo, B. Wang, C. G. Heron, M. J. Allen, J. Morre, C. S. Maier, W. F. Stickle and X. L. Ji, Pyrolysis of cellulose under ammonia leads to nitrogen–doped nanoporous carbon generated through methane formation, Nano Lett., 2014, 14, 2225–2229 CrossRef CAS PubMed.
- J. C. Wang, R. G. Ma, Y. Zhou and Q. Liu, A facile nanocasting strategy to nitrogen–doped porous carbon monolith by treatment with ammonia for efficient oxygen reduction, J. Mater. Chem. A, 2015, 3, 12836–12844 RSC.
- Y. J. Zhou, L. X. Zhang, W. M. Huang, Q. L. Kong, X. Q. Fan, M. Wang and J. L. Shi, N–doped graphitic carbon–incorporated g-C3N4 for remarkably enhanced photocatalytic H2 evolution under visible light, Carbon, 2016, 99, 111–117 CrossRef CAS.
- L. Chen, C. X. Xu, L. M. Yang, M. J. Zhou, B. H. He, Z. G. Chen, Z. Li, M. T. Shi, Z. H. Hou and Y. F. Kuang, Nitrogen–doped holey carbon nanotubes: dual polysulfides trapping effect towards enhanced lithium–sulfur battery performance, Appl. Surf. Sci., 2018, 454, 284–292 CrossRef CAS.
- W. Wang, L. Shang, G. J. Chang, C. Y. Yan, R. Shi, Y. X. Zhao, G. I. N. Waterhouse, D. J. Yang and T. R. Zhang, Intrinsic carbon–defect–driven electrocatalytic reduction of carbon dioxide, Adv. Mater., 2019, 31, 1808276 CrossRef PubMed.
- S. M. J. Rogge, A. Bavykina, J. Hajek, H. Garcia, A. I. Olivos–Suarez, A. Sepúlveda–Escribano, A. Vimont, G. Clet, P. Bazin, F. Kapteijn, M. Daturi, E. V. Ramos–Fernandez, F. X. Llabrés i Xamena, V. Van Speybroeck and J. Gascon, Metal–organic and covalent organic frameworks as single–site catalysts, Chem. Soc. Rev., 2017, 46, 3134–3184 RSC.
- X. Liang, C. Hart, Q. Pang, A. Garsuch, T. Weiss and L. F. Nazar, A highly efficient polysulfide mediator for lithium–sulfur batteries, Nat. Commun., 2015, 6, 1–8 Search PubMed.
- L. Xia, X. F. Wu, Y. Wang, Z. G. Niu, Q. Liu, T. S. Li, X. F. Shi, A. M. Asiri and X. P. Sun, S–doped carbon nanospheres: an efficient electrocatalyst toward artificial N2 fixation to NH3, Small Methods, 2019, 3, 1800251 CrossRef.
- P. Cai, R. Momen, M. Y. Li, Y. Tian, L. W. Yang, K. Y. Zou, X. L. Deng, B. W. Wang, H. S. Hou, G. Q. Zou and X. B. Ji, Functional carbon materials processed by NH3 plasma for advanced full–carbon sodium–ion capacitors, Chem. Eng. J., 2021, 15, 129647 CrossRef.
- S. Liu, J. Zhou and H. Song, Tailoring highly N–doped carbon materials from hexamine–based MOFs: superior performance and new insight into the roles of N configurations in Na–ion storage, Small, 2018, 14, 1703548 CrossRef PubMed.
- D. L. Yu, A. Kumar, T. A. Nguyen, M. T. Nazir and G. Yasin, High–voltage and ultrastable aqueous zinc–iodine battery enabled by N–doped carbon materials: revealing the contributions of nitrogen configurations, ACS Sustainable Chem. Eng., 2020, 8, 13769–13776 CrossRef CAS.
- S. J. Ye, G. M. Zeng, X. F. Tan, H. P. Wu, J. Liang, B. Song, N. Tang, P. Zhang, Y. Y. Yang, Q. Chen and X. P. Li, Nitrogen–doped biochar fiber with graphitization from Boehmeria nivea for promoted peroxymonosulfate activation and non–radical degradation pathways with enhancing electron transfer, Appl. Catal., B, 2020, 269, 118850 CrossRef CAS.
- H. J. Deng, Q. Li, J. J. Liu and F. Wang, Active sites for oxygen reduction reaction on nitrogen–doped carbon nanotubes derived from polyaniline, Carbon, 2017, 112, 219–229 CrossRef CAS.
Footnotes |
| † Electronic supplementary information (ESI) available. See DOI: 10.1039/d1ma00562f |
| ‡ These authors contributed equally to this work. |
| This journal is © The Royal Society of Chemistry 2021 |

