 Open Access Article
Tl0.6Mo3S5, an original large tunnel-like molybdenum sulfide with Mo zigzag chains and disordered Tl cations†
Patrick
Gougeon
 *a,
Philippe
Gall
a,
Sylvie
Migot
b,
Jaafar
Ghanbaja
b,
Maryvonne
Hervieu
c,
Petr
Levinský
d,
Jiří
Hejtmánek
 d,
Anne
Dauscher
b,
Bernard
Malaman
b,
Bertrand
Lenoir
b and
Christophe
Candolfi
 *b
*b
aSciences Chimiques de Rennes, UMR 6226 CNRS – INSA – Université de Rennes 1, Avenue du Général Leclerc, 35042 Rennes, France. E-mail: patrick.gougeon@univ-rennes1.fr
bInstitut Jean Lamour, UMR 7198 CNRS – Université de Lorraine, Campus ARTEM, 2 allée André Guinier, BP 50840, 54011 Nancy, France. E-mail: christophe.candolfi@univ-lorraine.fr
cCNRS, UMR 6508, Laboratoire CRISMAT, 6 Boulevard Marechal Juin, 14050 Caen, France
dInstitute of Physics, Czech Academy of Sciences, Cukrovarnická 10, 162 00, Praha 6, Czech Republic
First published on 17th August 2021
Abstract
We report on the crystal structure and physical properties of Tl0.6Mo3S5, which belongs to a novel family of materials with large tunnels, reminiscent of those observed in the romanechite structure type. Tl cations are partially filling these tunnels delimited by the Mo–S cluster framework in which the Mo atoms form infinite zigzag chains. Single-crystal X-ray diffraction data indicate that this compound crystallizes in the monoclinic, non-centrosymmetric space group P21 (no. 4; a = 9.344(2) Å, b = 3.234(2) Å, c = 11.669(2) Å and β = 113.09(2)° at 293 K). While electron diffraction performed on single crystals further evidences a commensurate modulation running solely along the b axis with a modulation wave vector  further experiments carried out on a polycrystalline sample suggest a compositional dependence of
 ![[q with combining right harpoon above (vector)]](https://www.rsc.org/images/entities/i_char_0071_20d1.gif) on the Tl content. Low-temperature transport properties measurements (5–300 K) reveal that Tl0.6Mo3S5 behaves as a narrow-band-gap n-type semiconductor. The strongly non-linear temperature dependence of the thermopower further suggests the presence of several electronic bands contributing to the electrical transport. Consistent with the extended electronic distribution in the tunnels that requires a description using two adjacent Tl sites, specific heat data measured down to 0.35 K evidence the presence of a Schottky-type anomaly that may be associated with the tunneling of the Tl cations between several equivalent, off-centered equilibrium sites. This inherent disorder contributes to suppression of the low-temperature Umklapp peak in the lattice thermal conductivity κL, the temperature dependence of which mimics that observed in strongly-disordered compounds. In spite of this characteristic, high κL values of up to 3.8 W m−1 K−1 are reached at 300 K, due to the covalent Mo–S network that contributes to maintaining high sound velocities.
on the Tl content. Low-temperature transport properties measurements (5–300 K) reveal that Tl0.6Mo3S5 behaves as a narrow-band-gap n-type semiconductor. The strongly non-linear temperature dependence of the thermopower further suggests the presence of several electronic bands contributing to the electrical transport. Consistent with the extended electronic distribution in the tunnels that requires a description using two adjacent Tl sites, specific heat data measured down to 0.35 K evidence the presence of a Schottky-type anomaly that may be associated with the tunneling of the Tl cations between several equivalent, off-centered equilibrium sites. This inherent disorder contributes to suppression of the low-temperature Umklapp peak in the lattice thermal conductivity κL, the temperature dependence of which mimics that observed in strongly-disordered compounds. In spite of this characteristic, high κL values of up to 3.8 W m−1 K−1 are reached at 300 K, due to the covalent Mo–S network that contributes to maintaining high sound velocities.
Introduction
Reduced molybdenum chalcogenides with a framework built up by Mo clusters have attracted significant interest since the discovery of the Chevrel phases.1,2 The size and geometry of the Mo–X cluster units (X = S, Se or Te) can vary substantially from Mo3 up to Mo36 depending on the nature of the X atoms, giving rise to remarkable transport properties with many phases exhibiting glass-like thermal transport, and to various types of lattice instabilities including superconductivity.2–23 More particularly, compounds composed of X = S and Se have been the subject of several recent investigations to assess their thermoelectric performance in a broad range of temperatures.10–23 In most of these compounds, alkali, alkaline-earth or transition metal cations can reside in the intercluster voids and often show large, anisotropic thermal displacement parameters that can be thought of as resulting from their tendency to be split over several equivalent equilibrium sites. The corresponding thermal motion can be described as tunneling between these equivalent positions, a property observed, for instance, in cage-like compounds such as inorganic type-I clathrates and in some chalcogenides.24–30 Because these tunneling states are strongly coupled to phonons, this key characteristic plays a prominent role in shaping the low-energy part of the phonon spectrum and hence, in determining the thermal transport in these materials.31Another interesting family of reduced molybdenum chalcogenides is MMo2S4 (M = V, Cr, Fe, and Co)32,33 in which the Mo atoms form zigzag chains. The crystal structure is characterized by rutile-type chains forming MoS2 layers of CdI2-type34 that are interconnected every two octahedra by a single MS6 octahedron. Rutile-type chains also form layers as observed in ReS235 for instance. In this context, an interesting compound is the binary Mo2S3 that can be described as MoS2 layers similar to those found in ReS2 (CdI2-type) that are interconnected through double-rutile-type chains.36 As a result, a framework containing empty quasi-rectangular-shaped tunnels, measuring one by two [1 × 2] octahedra, is observed.36
Here, we report on the synthesis of the novel pseudo-romanechite-type compound Tl0.6Mo3S5, in both single-crystalline and polycrystalline forms, which crystallizes with an average monoclinic structure described in the space group P21. This compound is closely related to Mo2S3 and exhibits [2 × 3] tunnels in which the Tl cations reside while the Mo atoms form infinite zigzag chains. The crystal structure is modulated along the b axis, as shown by electron diffraction, with experimental hints that the modulation wave vector varies with the Tl content. Low-temperature transport properties measurements suggest that this compound behaves as a narrow-band-gap n-type semiconductor. Despite the random distribution of Tl atoms in the tunnels of the crystal structure and their extended electronic density, Tl0.6Mo3S5 shows larger κL values (3.8 W m−1 K−1 at 300 K) than those usually observed in Mo-based cluster compounds (between 0.5 and 1.0 W m−1 K−1 at 300 K).10–23 The inherent disorder caused by the Tl atoms in the tunnels nevertheless likely explains the absence of low-temperature Umklapp peak in κL.
Experimental details
Synthesis of single-crystalline Tl0.58Mo3S5 and polycrystalline Tl0.6Mo3S5
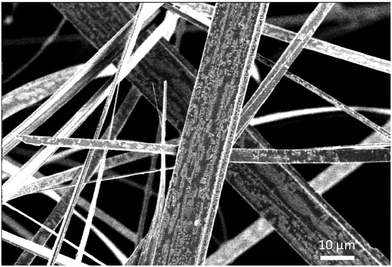
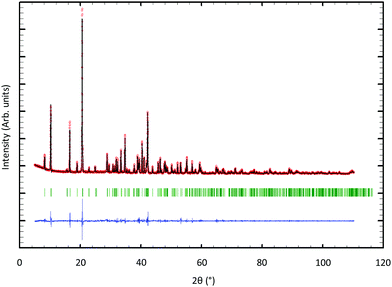
For the solid-state syntheses, MoS2, Tl2S and Mo precursor powders were used. In an initial step, Mo powder was reduced under flowing H2 gas at 1273 K during ten hours in order to eliminate oxygen traces. The binaries MoS2 and Tl2S were obtained by heating stoichiometric mixtures of the elements in sealed evacuated silica tubes during 48 h at 1073 and 723 K, respectively. All starting reagents were found monophasic on the basis of their powder X-ray diffraction (PXRD) pattern collected at 300 K on a D8 Bruker Advance diffractometer equipped with a LynxEye detector (CuKα1 radiation, λ = 1.5406 Å). All the starting reagents were kept and handled in a purified argon-filled glove box to avoid possible contamination by oxygen and moisture.Single crystals of Tl0.6Mo3S5 were first obtained from a mixture of MoS2, Tl2S and Mo with the nominal composition TlMo6S8. The initial mixture (ca. 5 g) was cold pressed and loaded into a molybdenum crucible, which was sealed under a low argon pressure using an arc welding system. The mixture was heated at the rate of 573 K h−1 up to 1573 K, held at this temperature for 48 h, then cooled down to 1273 K at 373 K h−1 and finally furnace cooled. The crystals grow in the form of very thin, whisker-like ribbons (Fig. 1). Subsequently, monophasic powders of composition Tl0.6Mo3S5 (Fig. 2) were prepared from cold-pressed pellets of stoichiometric mixtures of MoS2, Tl2S and Mo powders in silica tube sealed under a primary vacuum, heated at 1473 K for 48 h and finally cooled down to room temperature. The obtained ingot was ground into fine powders that were subsequently consolidated under vacuum by spark plasma sintering (SPS) in a graphite die of 10 mm in diameter at 1173 K for 120 min under a uniaxial pressure of 80 MPa.
Structural determination by single-crystal X-ray diffraction
Due to the morphology of the crystals, that have the shape of very thin flexible ribbons (see Fig. 1), finding a specimen diffracting sufficiently to make a recording was challenging. However, we could select a suitable single crystal with dimensions 0.33 × 0.10 × 0.004 mm3 for data collection. Intensity data were recorded up to 2θ = 35° with the θ–2θ scan method on a CAD4 Nonius diffractometer using a graphite-monochromatized MoKα radiation (λ = 0.71073 Å) at 300 K. The intensities of three standard reflections showed no significant variations over the data collection. The data set was corrected for Lorentz and polarization effects and for absorption by employing the Ψ scan method on six reflections.37 Analysis of the data revealed the systematic absence of the reflections (0k0) for k = 2n + 1 and (h0l), consistent with the monoclinic space groups P21 and P21/m. We first solved and refined the structure in the centrosymmetric space group P21/m. The initial positions of the Mo and S atoms were determined by the direct method using the SHELXS program.38 Least-squares refinements and Fourier analyses were performed with SHELXL.38 A subsequent difference Fourier 3D map39 reveals an electronic density with a bean shape in the tunnel that was attributed to Tl atoms (Fig. S1 in the ESI†). The cationic distribution of the thallium was modeled with two Tl atoms close to each other with partial occupancy factors (Fig. S2 in the ESI†). Except for the Tl2 atoms, all the other atoms are located in 2e position corresponding to the mirror planes y = ±1/4. Changing the space group from P21/m to P21 results in the loss of the mirror plane m. Thus, it was sufficient to keep the atomic positions obtained in the P21/m group, and to refine the y parameter of all the atoms, except that of Mo1 that fixes the origin.In order to compare the structural model obtained in the space groups P21/m (model a) and P21 (model b), we used the Hamilton R-factor ratio test.40 The value of the R-factor ratio is = 0.0654/0.0611 = 1.07. From the tables in ref. 40, we find that R27,1538,0.005 = 1.016. In the present case, the obtained inequality R27,1538,0.005 < Rexp, implies that the hypothesis a can be rejected in favor of b at a level of 0.005. Thus, the crystal structure is better described in the space group P21 at a probability level of 99.5%. Consequently, the last refinements were made in the space group P21. The final stoichiometry deduced from these refinements is Tl0.58(1)Mo3S5. The main crystallographic details, the atomic coordinates, anisotropic displacement parameters and selected bon lengths are listed in Tables S1–S4 in the ESI.† CCDC 2076408.† Hereafter, this refined composition will be used to label the single-crystalline sample while the polycrystalline sample will be labeled using its nominal composition Tl0.6Mo3S5.
Structural and chemical characterizations
The purity of the polycrystalline sample was checked at room temperature using PXRD using a Bruker D8 Advance (CuKα1 radiation) diffractometer. Profile-matching refinements against the PXRD data were performed using the FullProf software.41Scanning Electron Microscopy (SEM) analyses were carried out on polished surfaces of a small bulk, polycrystalline piece taken from the consolidated cylindrical pellet using a Quanta FEG 650 (FEI). Images in backscattering electron mode (BSE) and fracture images were taken on various areas to evidence the presence of secondary phases and to get insights into the grain size. Corresponding elemental X-ray maps were acquired to assess the chemical homogeneity. Additional images of the single-crystalline ribbons were collected in the BSE mode.
Two thin slices were prepared from ribbon-like shaped single crystals along and perpendicular to the growth direction (b axis of the crystal structure) by a dual ion beam (FIB) – scanning electron microscope system (Helios Nanolab 600i) using the in situ lift-out technique. Transmission electron microscopy (TEM) and aberration-corrected scanning transmission electron microscopy (STEM) experiments were carried out using a JEOL ARM200F – cold FEG microscope operating at 200 kV and equipped with a spherical aberration (Cs) probe and image correctors. The STEM experiments were conducted in high-angle annular dark-field (HAADF), annular bright-field (ABF) and high-resolution (HRTEM) modes. Electron Dispersive X-ray Spectroscopy (EDXS) was carried out on at least five different spots randomly chosen.
Additional electron diffraction experiments were carried out using a JEOL 200 CX microscope equipped with an eucentric goniometer, a tilt-rotation object holder and an energy dispersive spectroscopy (EDS) analyzer. A Tl0.6Mo3S5 powdered sample was ground in an agate mortar and deposited on a carbon membrane supported by a copper grid. Due to the highly anisotropic morphology of the grains, these micro-crystallized powders were deposited preferentially with the b axis parallel to the plane of the grid and hence, perpendicular to the axis of the incident electron beam. The reconstruction of the reciprocal lattice was performed by rotation around the crystallographic axes and the basic planes recorded for many crystallites.
Transport properties measurements
Measurements of the transport properties were performed on a bar-shaped sample cut from the consolidated polycrystalline pellet using a diamond-wire saw. At low temperatures (5–300 K), a Quantum Design Physical Property Measurement System (PPMS) was used to measure simultaneously the temperature dependence of the electrical resistivity, thermopower and thermal conductivity with the thermal transport option (TTO). For this measurement, four copper bars were mounted on the samples using a silver-containing conductive epoxy. Hall effect measurements were performed in the same temperature range on the same sample using the AC transport option of the PPMS. Ohmic contacts were realized by attaching five copper wires onto the sample with a minute amount of conductive silver paste. Specific heat Cp was measured between 2 and 300 K using the 4He specific heat option of the PPMS. A small polycrystalline piece of ∼20 mg was glued onto the platform of the sample holder using a minute amount of Apiezon N grease. Additional measurements were performed between 0.35 and 4 K on the same polycrystalline piece using the 3He specific heat option of the PPMS. Room-temperature longitudinal and transverse sound velocities were measured by a pulse-echo method using piezoelectric transducers on a consolidated piece of the polycrystalline sample.Results and discussion
Average crystal structure from single-crystal X-ray diffraction
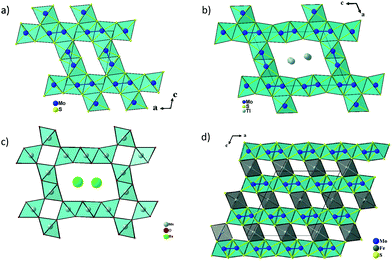
Fig. 3a and b show the crystal structures of Mo2S3 and Tl0.58Mo3S5 projected along the b axis of their monoclinic unit cell. Both crystal structures are characterized by MoS2 layers of CdI2-type separated by double-rutile-type chains. One of the main differences concern the spacing of the double-rutile-type chains, which corresponds to one octahedron in Mo2S3 leading to [1 × 2] channels and three octahedra in Tl0.58Mo3S5 creating [2 × 3] channels as observed, for instance, in the romanechite (Ba,H2O)2Mn5O10 (see Fig. 3c).42 However, in the latter, the [2 × 3] channels result from the corner sharing of double and triple chains of edge-sharing Mn–O octahedra. Consequently, Tl0.58Mo3S5 with channel sizes of about 6 by 8.5 Å can be classified in the category of microporous materials that notably include zeolites, metal–organic frameworks as well as layered silicates.43–45 Interest in these materials is related to their use as catalysts, cation exchange agents, molecular separation, via size-dependent filtration or sieving, as well as high-performance cathode for ion batteries, as recently observed in the romanechite Na0.31MnO1.9.46In Mo2S3 and Tl0.58Mo3S5, the Mo atoms within the double-rutile-type chains and the MoS2 layers form zigzag chains with Mo–Mo distances ranging between 2.78 and 2.86 Å. These crystal structures also bear some resemblance with the MMo2S4 (M = V, Cr, Fe, and Co) compounds in which the MoS2 layers are separated by rutile MS6 chains leading to [1 × 1] channels (Fig. 3d).25,26 In the MMo2S4 compounds, the Mo atoms form chains of triangular or diamond-shape clusters with Mo–Mo distances ranging between 2.75 and 3.01 Å.32,33 This clustering is also observed in the reduced molybdenum oxides, which crystallize with a hollandite-type structure such as K2Mo8O16,47 Ba1.14Mo8O16,48,49 La1.16Mo8O1650 or RMo6O12 (R = Nd, Pr).51,52 In these compounds, the Mo atoms form Mo–Mo bonds yielding to Mo3 triangles either isolated or forming infinite chains, planar rhomboidal Mo4 clusters as well as mixtures of Mo3 triangles and planar rhomboidal Mo4 clusters in equal proportion.
In the average crystal structure of Tl0.58Mo3S5, the three crystallographically independent Mo atoms form three different regular zigzag chains with transversal Mo–Mo distances of 2.7757(10), 2.8614(11) and 2.8289(10) Å for the chains formed by the Mo1, Mo2 and Mo3 atoms, respectively, while the Mo–Mo distances along the chain direction are equal to 3.234(2) Å (Fig. 4a and b). The shortest Mo–Mo inter-chain distance is 3.1754(11) Å and occurs between the zigzag chains formed by the Mo2 and Mo3 atoms along the a direction while, in the c direction, the shortest distances are around 3.9 Å between the Mo1 and Mo3 chains. The Mo–S bonds vary from to 2.338(6) to 2.639(2) Å. The two positions that are required to model adequately the electron distribution of the Tl atoms in the tunnels are significantly off-centered by 1.38 Å. The Tl1 and Tl2 atoms are thus surrounded by 8 sulphur atoms forming a distorted bicapped trigonal prism (Fig. 4c) with Tl–S distances ranging from 3.087(6) to 4.019(6) Å and 3.116(11) to 3.950(6), respectively. The mean values of 3.38 and 3.43 Å, respectively, are close to the value of 3.44 Å calculated from the sum of the ionic radii of S2− and Tl+ according to Shannon and Prewitt.53 The bond-valence sums (BVS) of the Tl atoms were deduced using BV coefficients as given by Brown and Altermatt.54,55 Atoms within a maximal distance of 4.1 Å of the central atom were included in the calculation. The calculated BVS are close to the ideal value of +1 with values of 1.05 and 0.94 for Tl1 and Tl2, respectively. BVS calculations for Mo atoms were also performed and led to an average value of +2.98 instead of +3.14. The discrepancy may result from the influence of the relatively strong metal–metal bonding.
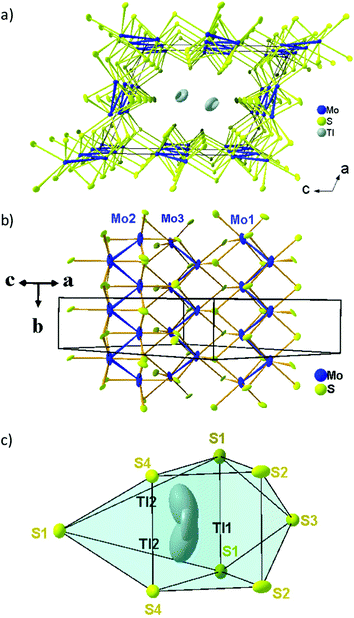 | ||
| Fig. 4 (a) View of the crystal structure of Tl0.58Mo3S5 projected along the b axis, (b) the three independent Mo–Mo zigzag chains and (c) the sulfur environment of the Tl cations. | ||
Modulated crystal structure
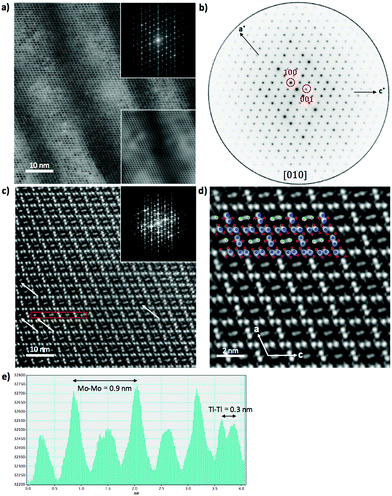
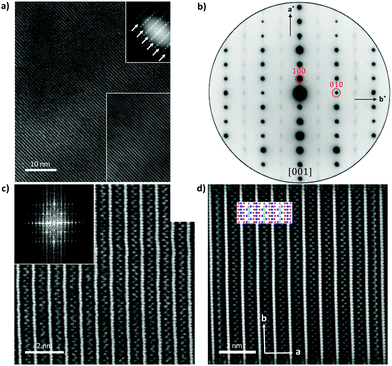
Fig. 5 shows HAADF-STEM images taken along the [010] zone axis at different magnifications. The large-scale images (Fig. 5a) is consistent with the tunnel-like crystal structure of Tl0.58Mo3S5 determined by single-crystal X-ray diffraction. The corresponding electron diffraction pattern, shown in Fig. 5b, can be fully indexed based on the monoclinic crystal structure of Tl0.58Mo3S5. While most of the areas of the thin slice show similar intensity profiles, with only weak fluctuations of the intensity from one Tl column to another, some columns exhibit significantly reduced contrast and, in some cases, only one bright spot instead of the elongated bright ellipsoid mostly found in other tunnels (Fig. 5c and d), suggestive of a larger amount of vacancies compared to other tunnels. Intensity line profiles (Fig. 5e) indeed indicate a random distribution of Tl atoms in the tunnels in agreement with the partial occupancy on the Tl sites used to model the single-crystal X-ray diffraction data.The diffraction patterns of the images taken along the [001] zone axis (Fig. 6a and b) evidence the presence of superstructure reflections in addition to those corresponding to the monoclinic crystal structure. The main reflections respect the systematic extinction conditions (0k0 with k = 2n + 1) compatible with the space group P21 determined by single-crystal X-ray diffraction. These satellite reflections are observed on either side of the main reflections solely along the b* axis. The wave vector determined on these patterns  further suggests that the modulation is commensurate with the crystal lattice along the b axis and implies a doubling of the unit cell along this direction. These diffraction patterns further evidence that these satellite reflections form streaks spreading along the a* direction (see inset in Fig. 6a). Streaks extending along a specific direction are usually indicative of short-range ordering of either structural fragments or defects. In the present case, a short-range ordering might be related to the extended distribution of Tl atoms in the tunnels (Fig. 6c and d). Interestingly, electron diffraction patterns measured on ground powders (Fig. S3 in ESI†) evidence similar results with the notable difference that all the satellite reflections are split, leading to an incommensurate modulation with a wave vector
  . These two distinct results thus point to a possible dependence of the wave vector
 ![[q with combining right harpoon above (vector)]](https://www.rsc.org/images/entities/i_char_0071_20d1.gif) on the Tl content. A possible explanation may be related to local fluctuations of the Tl content and/or in differences in the Tl concentration between single-crystalline and polycrystalline samples, as often observed in Mo-based cluster compounds.10–23 The variations in the Tl content may lead to local inhomogeneities giving rise to fluctuations from commensurate to incommensurate modulations. In an attempt to evidence possible differences between both types of samples, EDXS analyses were performed on the FIB slice using the TEM apparatus and on a bulk piece of the polycrystalline sample by SEM. The analyses performed on the FIB slice indicate an average Tl content of 0.55, in good agreement with single-crystal X-ray diffraction data. However, results based on similar analyses on bulk polycrystalline pieces could not be reliably obtained due to the strong overlap between the Tl Mα line with the Mo Lα and S Kα lines and the weak Tl Lα line signal that must be used to quantify the Tl content. Further TEM analyses on ground powders would be necessary to determine whether a single modulation can be observed throughout the sample or if it shows a more local character.
on the Tl content. A possible explanation may be related to local fluctuations of the Tl content and/or in differences in the Tl concentration between single-crystalline and polycrystalline samples, as often observed in Mo-based cluster compounds.10–23 The variations in the Tl content may lead to local inhomogeneities giving rise to fluctuations from commensurate to incommensurate modulations. In an attempt to evidence possible differences between both types of samples, EDXS analyses were performed on the FIB slice using the TEM apparatus and on a bulk piece of the polycrystalline sample by SEM. The analyses performed on the FIB slice indicate an average Tl content of 0.55, in good agreement with single-crystal X-ray diffraction data. However, results based on similar analyses on bulk polycrystalline pieces could not be reliably obtained due to the strong overlap between the Tl Mα line with the Mo Lα and S Kα lines and the weak Tl Lα line signal that must be used to quantify the Tl content. Further TEM analyses on ground powders would be necessary to determine whether a single modulation can be observed throughout the sample or if it shows a more local character.
Phase purity and microstructure of the polycrystalline sample
The profile matching of the PXRD pattern collected on the polycrystalline sample (see Fig. 2) confirms that all the peaks can be indexed based on the structural model inferred from the single-crystal X-ray diffraction data. While no evident secondary phases are observed within the resolution of this technique, additional SEM analyses (Fig. S4 in ESI†) indicate the presence of traces of the binary MoS2 used as a precursor in the solid-state synthesis. Fracture images further reveal the presence of micron-sized particles decorated by nanoparticles, suggesting a bi-modal distribution of grain size in the polycrystalline sample. Elemental X-ray maps nevertheless evidence a homogeneous spatial distribution of Tl, Mo and S in the sample.Transport properties
Tl0.6Mo3S5 exhibits semiconducting-like electronic properties with a room-temperature electrical resistivity ρ of 290 μΩ m (Fig. 7a). Upon cooling, ρ(T) rapidly rises by three orders of magnitude. Using an Arrhenius-like law , where Eg is the band gap and kB is the Boltzmann constant, the fit of the data in the 220–350 K temperature range yields a very narrow band gap of 20 meV. Of note, an apparent semiconducting-like behavior in ρ(T) can also emerge in semimetals due to strongly temperature-dependent hole and electron concentrations and mobilities.52–54 Thus, these data may be consistent with either a narrow-band-gap semiconductor or a semimetal with an overlap of the conduction and valence bands.
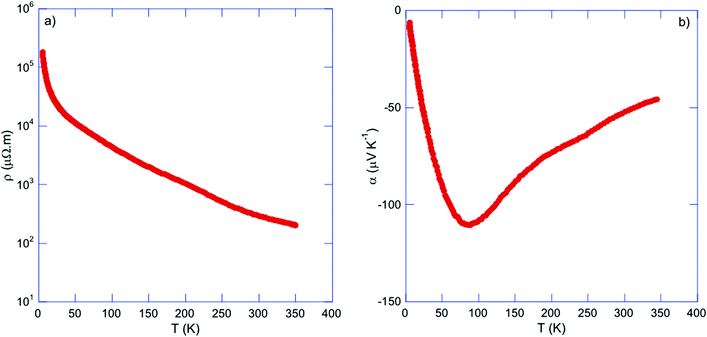 | ||
| Fig. 7 Temperature dependence of the (a) electrical resistivity ρ and (b) thermopower α for Tl0.6Mo3S5. | ||
The thermopower values α (Fig. 7b) are negative in the whole temperature range indicating that electron-like carriers dominate the transport in Tl0.6Mo3S5. However, the temperature dependence of α(T) differs from that expected for non-degenerate semiconductors for which α should exhibit a non-linear, monotonic increase with increasing temperature. In contrast, α(T) increases upon warming to reach −110 μV K−1 at 85 K, peaks at this temperature before decreasing in absolute values to −45 μV K−1 at 350 K. The fact that no particular signature of this maximum is observed in ρ(T) indicates that this upturn is not due to a structural phase transition. Intriguingly, the temperature dependence of α(T) parallels those observed in the n-type Bi1−xSbx alloys in the semiconducting regime for x ∼ 10%.56–58 In these alloys, the small band gaps of less than 100 meV result in thermal excitation of electrons near 25 K and hence, in a rapidly increasing concentration of holes. When both types of carriers are present, α can be described by a two-carrier expression with partial contributions of each type of carriers weighed by their electrical conductivity. Because of their opposite sign, their simultaneous presence tends to decrease the α values (in absolute values). Thus, the two distinct regions observed in α(T) suggest that the thermal excitation of holes starts to have a detrimental influence above 85 K while the electron contribution dominates α(T) below this temperature. Using the Goldsmid–Sharp relation Eg = 2eαmaxTmax, which relates the maximum α value αmax reached at Tmax to Eg, yields an estimate of 18 meV, consistent with that estimated from the ρ(T) data.
The temperature dependence of the Hall coefficient RH, inferred from the slope of the Hall resistivity ρH as a function of the applied magnetic field μ0H, is negative from 300 down to 75 K, indicating a dominant electron-like contribution in this temperature range in agreement with the sign of α(T). Below 75 K, the possible contribution of both hole-like and electron-like carriers to the Hall signal did not enable us to measure the ρH(μ0H) dependences. As a first approximation, using the single-carrier, free-electron formula RH = −1/nHe, where e is the elementary charge, results in electron concentrations nH varying from 2.6 × 1018 cm−3 at 75 K to 9.2 × 1019 cm−3 at 300 K (Fig. 8). The rapid increase in nH is consistent with thermal excitations of electron-like carriers and with the upturn observed in α(T). The Hall mobilities (Fig. S5 in ESI†) μH = RH/ρ are found to be very low, on the order of few cm2 V−1 s−1, and nearly temperature independent in the 75–300 K temperature range. These low μH values might reflect the peculiar microstructure observed on the fracture SEM images, revealing the presence of nano-particles surrounding micron-sized particles that might contribute to significantly limit the charge carrier mobility. Another ingredient explaining such low mobilities is the strong local disorder induced by the Tl atoms in the tunnels, a characteristic shared by other complex materials in which local disordering of cations has been observed.30,59,60
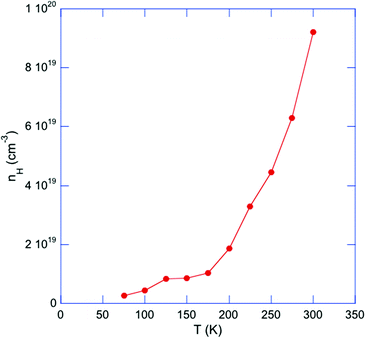 | ||
| Fig. 8 Temperature dependence of the electron concentration nH for Tl0.6Mo3S5. The solid line is a guide to the eye. | ||
Fig. 9a shows the temperature dependence of the specific heat Cp. Near room temperature, the Dulong–Petit limit of Cp = 3NR is not yet reached, suggesting a Debye temperature θD higher than 300 K. The Cp(T) data plotted as Cp/T versus T2 (Fig. 9b) do not obey the free-electron formula Cp = γT + βT3 where γ is the Sommerfeld coefficient reflecting the contribution of free charge carriers and βT3 is the phonon contribution. Below ∼2 K, the Cp values rapidly rise resulting in a significant upturn upon cooling to 0.35 K. This characteristic gives rise to significant deviations from the Debye-like linearity expected in this representation. This behavior is reminiscent of Schottky-type anomalies observed in rare-earth metals due to the magnetic hyperfine interaction between unpaired 4f electrons and the magnetic moment of the nucleus that splits the nuclear spin states, and in dipolar glasses or alkali halides where it originates from tunneling states associated with the presence of rotational degrees of freedom.61–64 Such an additional contribution to the specific heat has also been observed in type-I clathrates and has been attributed to the tunneling motion of the entrapped cations between the fourfold-split, equivalent positions located away from the cage center.24–29 In Tl0.6Mo3S5, the anomaly observed below 2 K may have a similar origin and be connected to the tunneling motion of the Tl cations between several equilibrium positions in the tunnels. This off-center position is consistent with the two adjacent Tl sites necessary to correctly describe the electronic density measured by X-ray diffraction and imaged by STEM analyses. Attempts at fitting the Cp data using a two-level Schottky model,65 as recently considered for the complex chalcogenide compound Cu6Te3S,66 could reproduce the observed peak, albeit with an unrealistic degeneracy ratio between the ground and excited states. This failure suggests a more complex situation possibly tied to a multilevel spectrum, in the spirit of those developed for alkali halides compounds such as KCl:Li for instance or in dipolar glasses.67,68 In this regard, incoherent inelastic neutron scattering experiments would be worthwhile to probe the sub-meV energy range and determine the distribution of tunneling energies.
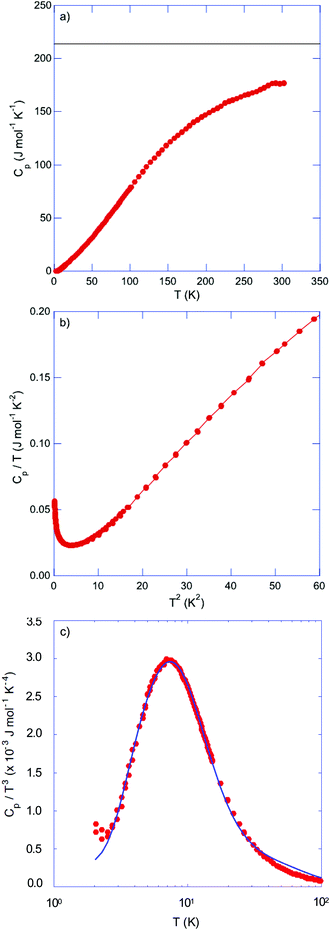 | ||
| Fig. 9 (a) Temperature dependence of the specific heat Cp of Tl0.6Mo3S5. The horizontal solid black line stands for the Dulong–Petit limit of 3NR where N is the number of atoms per formula unit and R is the ideal gas constant. (b) Cp/T versus T2 highlighting the deviations from the expected linearity below 2 K. (c) Cp/T3 as a function of T highlighting the pronounced maximum centered at 7 K. The solid black curve stands for the best fit to the data according to eqn (1). | ||
Because of the presence of this low-temperature upturn, an accurate estimate of the γ and β values cannot be reliably inferred from a fit of the data according to the above-mentioned free-electron formula. A fit restricted to the temperature range 3–4 K, that is, above the onset of the upturn, yields a finite γ value, which is however very close to zero. Thus, determining whether the ground state of Tl0.6Mo3S5 is semi-metallic or semiconducting with a narrow band gap from specific heat data would require measurements at temperatures below 0.35 K. Likewise, an estimate of the Debye temperature θD from the parameter β according to the relation  , where N is the number of atoms per formula unit and R is the ideal gas constant, yields a value of 170 K, which appears inconsistent with the fit of Cp(T) discussed in the next paragraph.
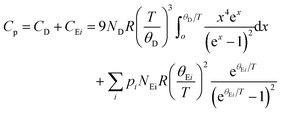
In cage- or tunnel-like compounds,56,69–75 the larger thermal displacement parameters of the entrapped atoms can usually be associated with low-energy, non-dispersive optical modes that shape the low-energy phonon spectrum and govern Cp at low temperatures. The resulting departure of Cp(T) from a Debye-like behavior manifests as a pronounced hump upon plotting the data as Cp/T3versus T. In Tl0.6Mo3S5, the disorder related to the off-centered positions of the Tl atoms is expected to induce a broadening of the optical modes, which might then evade direct detection by inelastic neutron scattering, as recently observed in the chalcogenide InTe.30 In such a case, the nature of the contribution of these broadened modes cannot be strictly associated with well-defined optical modes. Nevertheless, the existence of broad distributions of low-energy optical modes in Tl0.6Mo3S5 associated with the thermal motion of the Tl atoms is likely the origin of the pronounced maximum in the Cp(T)/T3 data centered at 7 K (Fig. 9c). Within these considerations, we tried to describe the variations in Cp(T)/T3 by a model that combines a Debye-like contribution used as a background over which Einstein-like contributions are superimposed. As a typically-used approximation,60,69–75 we considered the sum of one Debye and two Einstein contributions giving rise to the following relation
 | (1) |
The temperature dependence of the total thermal conductivity κ is shown in Fig. 10. The high ρ values in this compound give rise to a negligible electronic contribution making the non-distinction between κ and the lattice contribution κL reasonable in the present case. A first important observation is the temperature dependence that contrasts with that expected for dielectric solids where an Umklapp peak is usually observed at low temperatures. In the present case, κL(T) monotonically increases with increasing temperature up to about 150 K where κL(T) reaches a value of 3.8 W m−1 K−1 that remains nearly constant up to room temperature. In addition, the temperature dependence of κL mimics that of the specific heat. Although this behavior is analogous to that observed in glass-like cluster compounds,10–23 the measured κL values in Tl0.58Mo3S5 are one order of magnitude higher than those typically observed in these systems. The disorder induced by the random distribution of Tl atoms in the tunnels is an important ingredient that likely contributes to suppress the low-temperature Umklapp peak. However, although the analysis of the low-temperature Cp data suggests that the acoustic dispersions should extend over a narrow energy window, the κL values remain significantly larger than those measured in other Mo-based cluster compounds, which usually remain well below 1 W m−1 K−1 up to very high temperatures.10–23 This difference is possibly related to a stronger covalent character of the Mo–S network in Tl0.6Mo3S5 compared to other Mo–X (X = S, Se) cluster compounds,10–23 as observed in several boron-cluster compounds for which the covalent framework formed by boron atoms can maintain high κL values.76–78 The κL values measured in Tl0.6Mo3S5 are significantly higher than the minimum thermal conductivity κmin of 0.63 W m−1 K−1, estimated using the model developed by Cahill and Pohl79 and the longitudinal vL and transverse vT sound velocities of 3714 and 2180 m s−1, respectively, measured at 300 K. This large difference shows that the inherent disorder induced by the Tl atoms does not limit the heat transport to its minimum value.
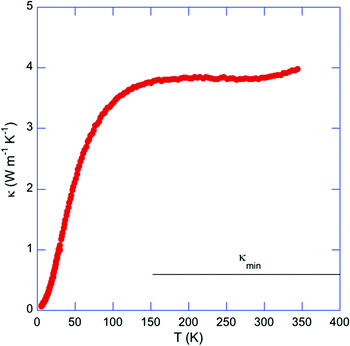 | ||
| Fig. 10 Temperature dependence of the total thermal conductivity κ for Tl0.6Mo3S5. Due to the large ρ values, κ can be considered as corresponding to the lattice contribution κL. The horizontal solid black line stands for the high-temperature limit of the theoretical minimum of the thermal conductivity κmin estimated using the model of Cahill and Pohl (ref. 71). | ||
Conclusion
The novel pseudo-romanechite-type compound Tl0.6Mo3S5 with [2 × 3] tunnels has been successfully synthesized via high-temperature, solid-state reactions in both single-crystalline and polycrystalline forms. The crystal structure, described in the monoclinic space group P21, features large tunnels in which Tl cations reside in off-centered positions, likely being the origin of the Schottky-type anomaly observed below 2 K in the specific heat data. Electron diffraction performed on single crystals evidenced a commensurate modulation that doubles the b axis of the crystal structure. In contrast, the incommensurate modulation observed in polycrystalline samples suggests that the modulation wave vector is sensitive to the Tl content. Low-temperature measurements of the transport properties indicate that Tl0.6Mo3S5 behaves as a narrow-band-gap n-type semiconductor. The partial filling and off-centered positions of the Tl atoms concur to suppress the Umklapp peak in the lattice thermal conductivity κL, which nevertheless gives rise to rather high values of up to 3.8 W m−1 K−1 at 300 K possibly due to the Mo–S covalent network. This crystallographic characteristic may provide further insights into the role played by off-centered atoms on the lattice dynamics of cluster compounds, an issue particularly relevant to designing materials with low κL. In this regard, other atoms such as alkaline elements may be inserted in the large tunnels to tune both the electronic and thermal transports, thereby expanding the number of members of this novel family of tunneled molybdenum sulfides. In particular, the existence of [3 × 3] channels in todorokite suggests the possible existence of such channels in these molybdenum sulphides with larger cations such as rubidium or cesium. In the future, it would also be worthwhile to studying the microporous characteristics of these novel class of tunnel-like compounds.Funding
P. G., P. G., A. D. B. L. and C. C. acknowledge the financial support of the French Agence Nationale de la Recherche (ANR), through the program Energy Challenge for Secure, Clean and Efficient Energy (Challenge 2, 2015, project MASSCOTE, ANR-15-CE05-0027). P. L. and J. H. acknowledge the financial support of the Czech Science Foundation (project 18-12761S). Experiments were performed in MGML (mgml.eu), which is supported within the program of Czech Research Infrastructures (project no. LM2018096).Conflicts of interest
Authors declare no conflict of interest.References
- R. Chevrel, M. Sergent and J. Prigent, J. Solid State Chem., 1971, 3, 515–519 CrossRef CAS.
- Ø. Fischer, Appl. Phys., 1978, 16, 1–28 Search PubMed.
- O. Peña, Physica C, 2015, 514, 95–112 CrossRef.
- M. Giroud, J.-L. Genicon, R. Tournier, C. Geantet, O. Peña, R. Horyn and M. Sergent, J. Low Temp. Phys., 1987, 69, 419–450 CrossRef CAS.
- W. Thomlinson, G. Shirane, D. E. Moncton, M. Ishikawa and Ø. Fischer, Phys. Rev. B: Condens. Matter Mater. Phys., 1981, 23, 4455 CrossRef CAS.
- A. P. Petrovic, D. Ansermet, D. Chernyshov, M. Hoesch, D. Salloum, P. Gougeon, M. Potel, L. Boeri and C. A. Panagopoulos, Nat. Commun., 2016, 7, 12262 CrossRef CAS PubMed.
- A. P. Petrovic, R. Lortz, G. Santi, C. Berthod, C. Dubois, M. Decroux, A. Demuer, A. B. Antunes, A. Paré, D. Salloum, P. Gougeon, M. Potel and Ø. Fischer, Phys. Rev. Lett., 2011, 106, 017003 CrossRef CAS PubMed.
- P. Gougeon and P. Gall, Inorg. Chem., 2017, 56, 3440–3446 CrossRef CAS PubMed.
- C. Candolfi, M. Míšek, P. Gougeon, R. Al Rahal Al Orabi, P. Gall, R. Gautier, S. Migot, J. Ghanbaja, J. Kaštil, P. Levinsky, J. Hejtmánek, A. Dauscher, B. Malaman and B. Lenoir, Phys. Rev. B: Condens. Matter Mater. Phys., 2020, 101, 134521 CrossRef CAS.
- C. Candolfi, P. Gougeon, P. Gall, M. Potel, A. Dauscher and B. Lenoir, Ligated Transition Metal Clusters in Solid-state Chemistry, in Thermoelectric Properties of Ternary and Quaternary Mo6 and Mo9 Cluster Selenides, ed. J.-F. Halet, Springer, 2019, vol. 180, pp. 125–141 Search PubMed.
- T. Zhou, B. Lenoir, M. Colin, A. Dauscher, R. Al Rahal Al Orabi, P. Gougeon, M. Potel and E. Guilmeau, Appl. Phys. Lett., 2011, 98, 162106 CrossRef.
- T. Zhou, M. Colin, C. Candolfi, C. Boulanger, A. Dauscher, E. Santava, J. Hejtmanek, P. Baranek, R. Al Rahal Al Orabi, M. Potel, B. Fontaine, P. Gougeon, R. Gautier and B. Lenoir, Chem. Mater., 2014, 26, 4765–4775 CrossRef CAS.
- R. Al Rahal Al Orabi, P. Gougeon, P. Gall, B. Fontaine, R. Gautier, M. Colin, C. Candolfi, A. Dauscher, J. Hejtmanek, B. Malaman and B. Lenoir, Inorg. Chem., 2014, 53, 11699–11709 CrossRef CAS PubMed.
- P. Gougeon, P. Gall, R. Al Rahal Al Orabi, B. Fontaine, R. Gautier, M. Potel, T. Zhou, B. Lenoir, M. Colin, C. Candolfi and A. Dauscher, Chem. Mater., 2012, 24, 2899–2908 CrossRef CAS.
- R. Al Rahal Al Orabi, B. Fontaine, R. Gautier, P. Gougeon, P. Gall, Y. Bouyrie, A. Dauscher, C. Candolfi and B. Lenoir, Inorg. Chem., 2016, 55, 6616–6624 CrossRef CAS PubMed.
- G. Daigre, P. Gougeon, P. Gall, R. Gautier, O. Guillou, J.-B. Vaney, C. Candolfi, A. Dauscher and B. Lenoir, J. Solid State Chem., 2016, 237, 1–6 CrossRef CAS.
- P. Masschelein, C. Candolfi, A. Dauscher, C. Gendarme, R. Al Rahal Al Orabi, P. Gougeon, M. Potel, P. Gall, R. Gautier and B. Lenoir, J. Alloys Compd., 2018, 739, 360–367 CrossRef CAS.
- M. Colin, T. Zhou, B. Lenoir, A. Dauscher, R. Al Rahal Al Orabi, P. Gougeon, M. Potel, P. Baranek and C. Semprimoschnig, J. Electron. Mater., 2012, 41, 1360–1364 CrossRef CAS.
- P. Gougeon, P. Gall, O. Merdrignac-Conanec, L. Aranda, A. Dauscher, C. Candolfi and B. Lenoir, Inorg. Chem., 2017, 56, 9684–9692 CrossRef CAS PubMed.
- P. Gougeon, P. Gall, R. Al Rahal Al Orabi, B. Boucher, B. Fontaine, R. Gautier, A. Dauscher, C. Candolfi and B. Lenoir, Inorg. Chem., 2019, 58, 5533–5542 CrossRef CAS PubMed.
- G. Daigre, P. Gougeon, P. Gall, O. Merdrignac-Conanec, R. Al Rahal Al Orabi, R. Gautier, A. Dauscher, C. Candolfi and B. Lenoir, ACS Appl. Energy Mater., 2020, 3, 2846–2855 CrossRef CAS.
- S. M. Butorin, K. O. Kvashnina, M. Klintenberg, M. Kavcic, M. Zitnik, K. Bucar, P. Gougeon, P. Gall, C. Candolfi and B. Lenoir, ACS Appl. Energy Mater., 2018, 1, 4032–4039 CrossRef CAS.
- R. Al Rahal Al Orabi, B. Boucher, B. Fontaine, P. Gall, C. Candolfi, B. Lenoir, P. Gougeon, J.-F. Halet and R. Gautier, J. Mater. Chem. C, 2017, 5, 12097–12104 RSC.
- G. S. Nolas, T. J. R. Weakley, J. L. Cohn and R. Sharma, Phys. Rev. B: Condens. Matter Mater. Phys., 2000, 61, 3845–3850 CrossRef CAS.
- F. Bridges and L. Downward, Phys. Rev. B: Condens. Matter Mater. Phys., 2004, 70, 140201 CrossRef.
- R. Baumbach, F. Bridges, L. Downward, D. Cao, P. Chesler and B. C. Sales, Phys. Rev. B: Condens. Matter Mater. Phys., 2005, 71, 024202 CrossRef.
- R. P. Hermann, W. Schweika, O. Leupold, R. Rüffer, G. S. Nolas, F. Grandjean and G. J. Long, Phys. Rev. B: Condens. Matter Mater. Phys., 2005, 72, 174301 CrossRef.
- K. Suekuni, M. A. Avila, K. Umeo and T. Takabatake, Phys. Rev. B: Condens. Matter Mater. Phys., 2007, 75, 195210 CrossRef.
- R. P. Hermann, V. Keppens, P. Bonville, G. S. Nolas, F. Grandjean, G. J. Long, H. M. Christen, B. C. Chakoumakos, B. C. Sales and D. G. Mandrus, Phys. Rev. Lett., 2006, 97, 017401 CrossRef PubMed.
- S. Misra, C. Barreteau, J.-C. Crivello, V. M. Giordano, J.-P. Castellan, Y. Sidis, P. Levinsky, J. Hejtmanek, B. Malaman, A. Dauscher, B. Lenoir, C. Candolfi and S. Pailhès, Phys. Rev. Res., 2020, 2, 043471 Search PubMed.
- L. Gannon, L. Boeri, C. A. Howard, P. Gougeon, P. Gall, M. Potel, D. Salloum, A. P. Petrovic and M. Hoesch, Phys. Rev. B: Condens. Matter Mater. Phys., 2018, 98, 014104 CrossRef CAS.
- J. Guillevic, J. Y. Le Marouille and D. Grandjean, Acta Crystallogr., Sect. B: Struct. Crystallogr. Cryst. Chem., 1974, 30, 111–117 CrossRef CAS.
- P. Vaqueiro, M. L. Kosidowski and A. V. Powell, Chem. Mater., 2002, 14, 1201–1209 CrossRef CAS.
- R. M. Bozorth, J. Am. Chem. Soc., 1922, 44, 2232–2236 CrossRef CAS.
- H. J. Lamfers, A. Meetsma, G. A. Wiegers and J. L. de Boer, J. Alloys Compd., 1996, 241, 34–39 CrossRef CAS.
- W. J. Schutte, F. Disselborg and J. L. de Boer, Acta Crystallogr., Sect. B: Struct. Sci., 1993, B49, 787–794 CrossRef CAS.
- J. de Meulenaer and H. Tompa, Acta Crystallogr., 1965, 19, 1014–1018 CrossRef CAS.
- G. M. Sheldrick, Acta Crystallogr., Sect. A: Found. Crystallogr., 2008, 64, 112–122 CrossRef CAS PubMed.
- K. Momma and F. Izumi, J. Appl. Crystallogr., 2011, 44, 1272–1276 CrossRef CAS.
- W. C. Hamilton, Acta Crystallogr., 1965, 18, 502–510 CrossRef CAS.
- J. Rodriguez-Carvajal, Physica B, 1993, 192, 55–69 CrossRef CAS.
- S. Turner and J. E. Post, Am. Mineral., 1988, 73, 1155–1161 CAS.
- D. H. Everett, Definitions, terminology and symbols in colloid and surface chemistry: part I. In/WAC Manual of Symbols and Terminology for Physiochemical Ouantities and Units: Appendix II, Butterworths, London, 1972, vol. 31, pp. 578–638 Search PubMed.
- C. J. Brinker, Curr. Opin. Solid State Mater. Sci., 1996, 1(6), 798–805 CrossRef CAS.
- E. Doustkhah and Y. Ide, New J. Chem., 2020, 44, 9957–9968 RSC.
- J. Y. Li, X. L. Wu, X. H. Zhang, H. Y. Lu, G. Wang, J. Z. Guo, F. Wan and R. S. Wang, Chem. Commun., 2015, 51, 14848–14851 RSC.
- C. C. Torardi and J. C. Calabrese, Inorg. Chem., 1984, 23, 3281–3284 CrossRef CAS.
- C. C. Torardi and R. E. McCarley, J. Solid State Chem., 1981, 37, 393–397 CrossRef CAS.
- H. Leligny, P. Labbé, M. Ledésert, B. Raveau, C. Valdez and W. H. McCarroll, Acta Crystallogr., Sect. B: Struct. Sci., 1992, 48, 134 CrossRef.
- N. Barrier, P. Gougeon and R. Retoux, J. Alloys Compd., 2001, 317, 120–126 CrossRef.
- J. Tortelier, W. H. McCarroll and P. Gougeon, J. Solid State Chem., 1998, 136, 87–92 CrossRef CAS.
- N. Barrier, J. Tortelier and P. Gougeon, Acta Crystallogr., Sect. E: Struct. Rep. Online, 2001, 57, 1 CrossRef PubMed.
- R. D. Shannon, Acta Crystallogr., Sect. A: Cryst. Phys., Diffr., Theor. Gen. Crystallogr., 1976, 32, 751–767 CrossRef.
- D. Altermatt and I. D. Brown, Acta Crystallogr., Sect. B: Struct. Sci., 1985, 41, 240–244 CrossRef.
- I. D. Brown and D. Altermatt, Acta Crystallogr., Sect. B: Struct. Sci., 1985, 41, 244–247 CrossRef.
- B. Lenoir, H. Scherrer and T. Caillat, Semiconductors and semimetals, Academic Press, 2001, ch. 4, pp. 101–137 Search PubMed.
- B. Lenoir, O. Selme, A. Demouge, H. Scherrer, Yu. V. Ivanov and Yu. I. Ravich, Phys. Rev. B: Condens. Matter Mater. Phys., 1998, 57, 11242–11250 CrossRef CAS.
- B. Lenoir, M. Cassart, J.-P. Michenaud, H. Scherrer and S. Scherrer, J. Phys. Chem. Solids, 1996, 57, 89–99 CrossRef CAS.
- H. Lin, G. Tan, J.-N. Shen, S. Hao, L.-M. Wu, N. Calta, C. Malliakas, S. Wang, C. Uher, C. Wolverton and M. G. Kanatzidis, Angew. Chem., 2016, 55, 11431–11436 CrossRef CAS PubMed.
- D. J. Safarik, T. Klimczuk, A. Llobet, D. D. Byler, J. C. Lashley, J. R. O’Brien and N. R. Diley, Phys. Rev. B: Condens. Matter Mater. Phys., 2012, 85, 014103 CrossRef.
- O. V. Lounasmaa and R. A. Guenther, Phys. Rev., 1962, 126, 1357–1363 CrossRef CAS.
- O. V. Lounasmaa and P. R. Roach, Phys. Rev., 1962, 128, 622–626 CrossRef CAS.
- J. P. Sethna and K. S. Chow, Phase Transitions, 1985, 5, 317–339 CrossRef CAS.
- D. Smith, Chem. Rev., 1994, 94, 1567–1584 CrossRef CAS.
- E. S. R. Gopal, Specific Heats at low temperatures, Plenum Press, New York, 1966 Search PubMed.
- Z. Liu, W. Zhang, W. Gao and T. Mori, Energy Environ. Sci., 2021, 14, 3579–3587 RSC.
- J.-P. Harrison, P. P. Peressini and R. O. Pohl, Phys. Rev., 1968, 171, 1037–1046 CrossRef CAS.
- F. C. Baumann, J. P. Harrison, R. O. Pohl and W. D. Seward, Phys. Rev., 1967, 159, 691–699 CrossRef CAS.
- H. J. Goldsmid and J. W. Sharp, J. Electron. Mater., 1999, 28, 869–872 CrossRef CAS.
- K. Suekuni, M. A. Avila, K. Umeo and T. Takabatake, Phys. Rev. B: Condens. Matter Mater. Phys., 2007, 75, 195210 CrossRef.
- U. Aydemir, C. Candolfi, A. Ormeci, Y. Oztan, M. Baitinger, N. Oeschler, F. Steglich and Y. Grin, Phys. Rev. B: Condens. Matter Mater. Phys., 2011, 84, 195137 CrossRef.
- C. Candolfi, M. M. Koza, U. Aydemir, W. Carrillo-Cabrera, Y. Grin, F. Steglich and M. Baitinger, J. Appl. Phys., 2020, 127, 145104 CrossRef CAS.
- Z. Hiroi, A. Onosaka, Y. Okamoto, J.-I. Yamaura and H. Harima, J. Phys. Soc. Jpn., 2012, 81, 124707 CrossRef.
- M. J. Winiarski and T. Klimczuk, J. Solid State Chem., 2017, 245, 10–16 CrossRef CAS.
- Y. Nagao, J.-I. Yamaura, H. Ogusu, Y. Okamoto and Z. Hiroi, J. Phys. Soc. Jpn., 2009, 78, 064702 CrossRef.
- T. Mori, J. Solid State Chem., 2019, 275, 70–82 CrossRef CAS.
- T. Mori, J. Martin and G. Nolas, J. Appl. Phys., 2007, 102, 073510 CrossRef.
- D. G. Cahill, H. E. Fischer, S. K. Watson, R. O. Pohl and G. A. Slack, Phys. Rev. B: Condens. Matter Mater. Phys., 1989, 40, 3254–3260 CrossRef CAS PubMed.
- D. G. Cahill, S. K. Watson and R. O. Pohl, Phys. Rev. B: Condens. Matter Mater. Phys., 1992, 46, 6131–6140 CrossRef CAS.
Footnote |
| † Electronic supplementary information (ESI) available: Electron diffraction images collected on ground polycrystalline Tl0.6Mo3S5, SEM images along with corresponding elemental X-ray maps obtained on the polycrystalline sample. CCDC 2076408. For ESI and crystallographic data in CIF or other electronic format see DOI: 10.1039/d1ma00568e |
| This journal is © The Royal Society of Chemistry 2021 |

