 Open Access Article
Controlling the dispersion of ceria using nanoconfinement: application to CeO2/SBA-15 catalysts for NH3-SCR†
Jun
Shen
 and
Christian
Hess
 *
*
Eduard-Zintl-Institut für Anorganische und Physikalische Chemie, Technical University of Darmstadt, Alarich-Weiss-Str. 8, 64287 Darmstadt, Germany. E-mail: jun.shen@tu-darmstadt.de; christian.hess@tu-darmstadt.de
First published on 9th September 2021
Abstract
Mesoporous silicas, such as SBA-15, with their high and inert surface area, constitute promising support materials for catalytic applications. However, loading the active phase onto porous materials to give high dispersion and even distribution is still a great challenge. In the presence of the template P123, ceria crystal growth can be controlled by nanoconfinement effects. We have applied in situ Raman, DRIFT, and DR UV-vis spectroscopies to elucidate the mechanism of template-assisted synthesis of ceria/SBA-15 catalysts for NH3-SCR applications. The co-decomposition of P123 and cerium precursor shows a catalytic interaction, resulting in a change of ceria nucleation and growth behavior during the calcination process. Based on this knowledge, we have developed an improved catalyst synthesis by combining the nanoconfinement effects of P123 and the use of an inert atmosphere, resulting in an improved ceria dispersion on SBA-15 and superior NH3-SCR performance. Our results highlight the significance of the calcination process for defining catalyst properties and the use of in situ spectroscopy for rational synthesis of supported catalysts.
Introduction
In the past decade, mesoporous materials have attracted great attention due to their high specific surface area, large pore volume, and controllable pore sizes between 2 and 50 nm (according to the IUPAC definition) with extensive applications in gas adsorption, drug delivery, and catalysis.1 Since the first synthesis of mesoporous SBA-15 by Zhao et al.,2 the enlarged pore sizes (4.6–30 nm) have allowed larger molecules to enter the pore system, and have also decreased the mass transfer limitations compared to conventional zeolites and microporous molecular sieves.3,4 Due to their inert behaviour in most catalytic reactions, mesoporous silicates are promising support materials for the incorporation of various active compositions, metals or metal oxides, exhibiting a great potential for heterogeneous catalysis.5–8At present, synthetic approaches leading to catalytically active mesoporous silicates are divided into two classes, the “one-pot” strategy and the “loading” strategy.9 In the case of the “one-pot” strategy (or pre-synthesis method), the silicon source is mixed with the precursor of the active composition, which then both interact with the template to co-assemble into a porous framework.10–12 This method has the advantage of being a simple operation and the formation of an atomic-scale mixture of active sites in the porous materials, while the additional heteroatom in the framework may destroy the ordered mesoporous structure, leading to further collapses during calcination. The “loading” strategy (or post-synthesis method) mainly involves the preparation of a stable mesoporous silica matrix, followed by its loading with the active composition.13,14 The bottleneck of this method is the distribution of active species (e.g. nanoclusters of metals or metal oxides) inside the long pore channel, which may be susceptible to sintering effects at high-temperature calcination.15 However, one may envision an intermediate between the pre- and post-synthesis approaches, denoted med-synthesis, in which the template remains in the pore (see Scheme 1) and which, although largely ignored for a long time, has the potential to combine the advantages of the pre- and post-synthesis approaches, such as good active phase distribution and defined structure.
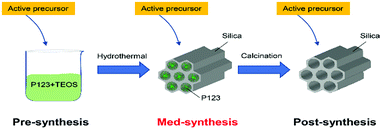 | ||
| Scheme 1 Synthesis approaches for mesoporous silicate materials (e.g. SBA-15) modified by the addition of an active component at different stages. | ||
Recently, the positive effect of surfactants on the loading of active components in mesoporous silicates has attracted considerable attention. To this end, previous studies have shown that 3 nm-sized ceria particles dispersed on SBA-15, as achieved with the assistance of H3Cit, caused an enhanced reducibility and defect concentration of the particles, influencing the catalytic performance.16 Besides, surfactant-assisted impregnation has been widely applied in the context of Ni/SBA-15 catalysts for CO2 reforming of CH4.17 These studies have revealed that the use of surfactant P123 yields a catalytic performance superior to that of other surfactants,17–20 which was explained by the coordination of Ni atoms by the OH groups of P123, thus preventing their aggregation.19 Considering that P123 is the template of SBA-15, a method was put forward that used as-made SBA-15 for wetness impregnation after partial removal of P123. This method was employed for the synthesis of Cu/SBA-15 materials, enabling a good dispersion of copper even at high loadings.21,22 Yin et al. suggested an improved method to use the P123-contained SBA-15 combined with solid-state impregnation methods to avoid the extra step of partial removal of P123, which was applied to the synthesis of CuO/SBA-15 for thiophene capture,23,24 CeO2/SBA-15 for sulphur capture,25,26 Pt/SBA-15 for hydrogen storage,27 Co/SBA-15 for the oxidation of organic pollutants,28 and Fe/SBA-15 for phenol degradation.29 Also composite catalysts, i.e., Ag-CeO2/SBA-15, were prepared by using P123-contained SBA-15, showing good dispersion and catalytic performance for room-temperature reduction of 4-nitrophenol.30 Summarizing, previous studies have demonstrated the great potential of the template P123-assisted synthesis of mesoporous catalysts containing highly dispersed metals or metal oxides.
Although the med-synthesis approach towards improved supported catalysts has received increasing attention, a detailed mechanistic understanding of the template P123-assisted synthesis is still lacking. One hypothesis is that P123 remaining in the pores of SBA-15 forms a confined space between the silica walls and residual P123 in the intra-wall pores,22,25–29 while another proposes an interaction between P123 and the metal precursors, influencing their decomposition behavior.19 However, due to lack of direct experimental evidence, particularly in situ analysis, none of the above hypotheses have been verified so far. Besides, it was found that the dispersion effect of P123 was limited to samples with high loadings.26 Thus, elucidating the mechanism of the template assistance will be of great importance to further improve its applicability to catalyst synthesis.
The selective catalytic reduction (SCR) of NO with NH3 is an essential process to reduce the emission of NOx gas, which is known to be harmful to the global environment and human health.31 Ceria-based materials have been considered as potential catalysts for the NH3-SCR reaction, due to their high oxygen storage capacity (OSC) and excellent redox properties.32 Since crystalline CeO2 cannot provide a sufficiently high specific surface area, especially after high-temperature aggregation, SBA-15 has been employed previously as a support material to disperse and stabilize CeO2 particles,33 but also other NH3-SCR-related materials.34
In this contribution, we report how CeO2/SBA-15 catalysts were prepared by solid-state impregnation methods starting from bare and template-containing SBA-15, aiming at a mechanistic understanding of the synthesis. To monitor the calcination process in detail, in situ Raman, DRIFT, and DR UV-vis spectroscopies were applied, revealing details of the transformation of the cerium precursor to the supported oxide. Additional thermogravimetric analysis (TGA) and exhaust gas analysis by FT-IR spectroscopy allowed the temperature-dependent decomposition of the P123 template and the cerium precursors to be monitored. The differently prepared samples were characterized with regard to their structural and surface properties and tested in NH3-SCR. Based on these combined results, a synthesis mechanism was proposed and used to develop a novel synthesis protocol to yield catalysts with improved ceria dispersion and superior NH3-SCR performance.
Results and discussion
1. Characterization of dispersed CeO2 on SBA-15
Three CeO2/SBA-15 samples were prepared by calcination of the cerium oxide precursor Ce(NO3)3·6H2O and the SBA-15 support following different routes, as detailed in Scheme 2. The sample tfSBA–CeO2–air was synthesized by grinding template-free SBA-15 (tfSBA-15) with cerium nitrate and subsequent calcination in air to obtain ceria crystallites grown inside SBA-15 pores. For the sample asSBA–CeO2–air, P123-containing SBA-15 (asSBA-15) was employed as support material. Using the same calcination step in air results in ceria dispersed inside the SBA-15 pores. Moreover, a third route was designed, which yields the sample asSBA–CeO2–N2, by starting from asSBA-15 but changing the gas atmosphere to inert N2.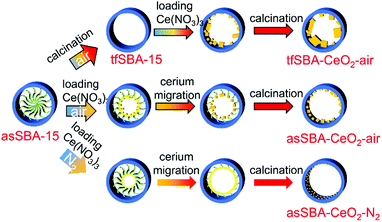 | ||
| Scheme 2 Different synthesis routes for CeO2/SBA-15 catalysts using the solid-state impregnation method. | ||
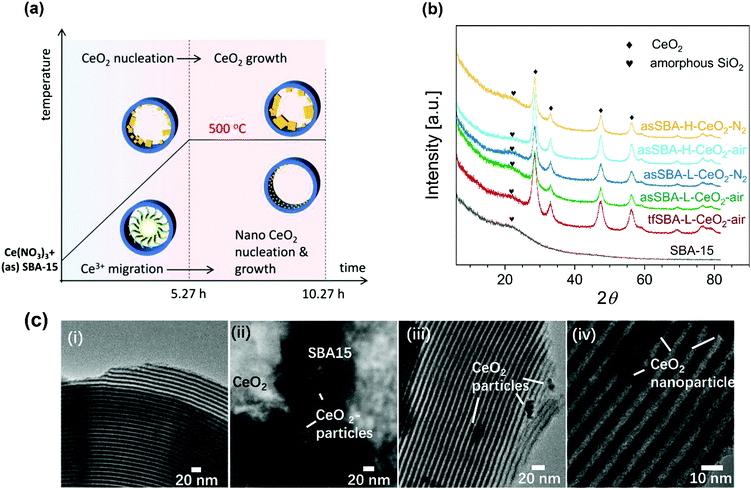
Fig. 1a summarizes the temperature program of the calcination process, which is characterized by two stages, i.e., heating from room temperature to 500 °C at a rate of 1.5 °C min−1 and keeping the temperature at 500 °C for 5 h.
Fig. 1b shows wide-angle XRD patterns of the calcined samples. Starting with bare SBA-15, the broad diffraction peak at 2θ = 23° is assigned to amorphous silica. For the samples with CeO2 loading, new peaks appear at 2θ values of 28.5°, 33.2°, 47.5°, and 56.3°, which can be attributed to different planes of crystalline CeO2, i.e., (111), (200), (220), and (311), respectively. Detailed analysis reveals that the peaks show a full width at half maximum (FWHM) in the order tfSBA–L-CeO2–air < asSBA–L-CeO2–air < asSBA–L-CeO2–N2. Based on a fit analysis of the ceria (111) diffraction peak and application of the Scherrer formula,35 the crystallite sizes are found to decrease as tfSBA–L-CeO2–air > asSBA–L-CeO2–air > asSBA–L-CeO2–N2 (see Table 1), reflecting the suppression of ceria crystal growth when the use of template P123 is combined with a N2 calcination atmosphere. Similarly, with increasing CeO2 loading, the crystallite sizes decreased as asSBA–H-CeO2–air > asSBA–H-CeO2–N2, indicating that an inert calcination atmosphere further improves the CeO2 dispersion compared to the effect of the surfactant template alone.
| Samples | CeO2 (wt%) | S total [m2 g−1] | D p [nm] | V micro [cm3 g−1] | V total [cm3 g−1] | d CeO2 [nm] |
|---|---|---|---|---|---|---|
| a Total BET surface area. b Pore diameter determined from the adsorption branch by NLDFT. c Micropore volume. d Total pore volume. e Calculated from XRD results using the Scherrer formula. | ||||||
| tfSBA-15 | 0 | 616 | 6.3 | 0.14 | 0.64 | — |
| tfSBA–L-CeO2–air | 39 | 414 | 6.3 | 0.06 | 0.43 | 7.8 |
| asSBA–L-CeO2–air | 39 | 359 | 6.3 | 0.03 | 0.39 | 6.4 |
| asSBA–L-CeO2–N2 | 39 | 280 | 5.8 | 0.02 | 0.32 | 5.4 |
Fig. 1c shows TEM bright field images of the calcined samples. The SBA-15 sample (i) has a regular morphology and ordered structure. For the samples tfSBA–L-CeO2–air (ii), asSBA–L-CeO2–air (iii), and asSBA–L-CeO2–N2 (iv) CeO2 nanoparticles with decreasing size are observed outside the SBA-15 matrix, showing that similar to XRD TEM detects larger particles but not the highly dispersed ceria inside the pores.
Table 1 summarizes some physical properties of the CeO2/SBA-15 samples as determined on the basis of N2 adsorption isotherms, including the specific surface areas, the micropore and total pore volumes, and the pore sizes. The CeO2-containing samples exhibit smaller specific surface areas than bare template-free SBA-15 (tfSBA-15), decreasing in the order tfSBA–L-CeO2–air > asSBA–L-CeO2–air > asSBA–L-CeO2–N2, owing to micropore blocking and, in the case of asSBA–L-CeO2–N2, also the reduction of mesopore diameter by ceria loading onto the inner surface of the porous matrix.
The N2 adsorption/desorption isotherms of the SBA-15 and CeO2/SBA-15 samples all show profiles typical for mesoporous materials (see Fig. 2a), but with variations in the shape of the hysteresis loop. Bare SBA-15 powder shows the typical shape of a mesoporous material with an H1 hysteresis loop at the relative pressure p/p° of 0.55–0.75, reflecting uniform hexagonal pores with a narrow pore size distribution centred around 6.3 nm diameter. For samples loaded with CeO2, a decrease in the micropore area compared to bare SBA-15 is observed. Also, the closing point of the hysteresis loop shifts to lower relative pressure values of about 0.45, which implies that CeO2 is formed inside the pores, resulting in open and narrowed mesopores.36 The desorption branch of the hysteresis loop of tf-SBA-L-CeO2-air shows two steps, representing open mesopores (p/p° of 0.53–0.70) and narrowed mesopores (p/p° of 0.45–0.53), respectively. For asSBA–L-CeO2–air, a weak feature from open mesopores and a forced closure of the hysteresis loop at p/p° = 0.46 is observed, which is attributed to ink-bottle type pores. In contrast, the desorption branch of asSBA–L-CeO2–N2 is characterized by a smoother decrease, which is somewhat similar to that of SBA-15, representing a more uniform pore size along the channels, while the shift of the curve to lower relative pressure values compared to bare SBA-15 results from the decreased pore size after the coating with CeO2.
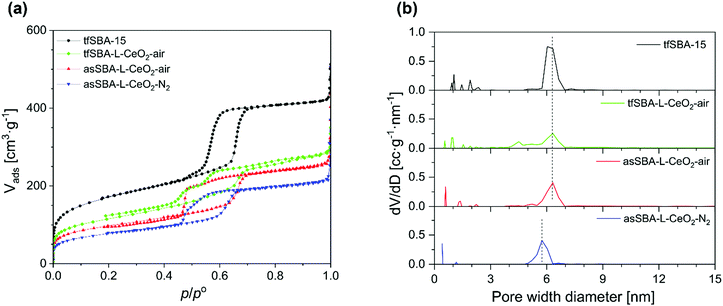 | ||
| Fig. 2 (a) N2 adsorption/desorption isotherms, and (b) NLDFT pore size distributions of template-free SBA-15 and CeO2/SBA-15 materials prepared by different synthesis routes. | ||
Fig. 2b shows the pore size distributions calculated from the adsorption branches of the isotherms. The samples treated in air, tfSBA–L-CeO2–air and asSBA–L-CeO2–air, exhibit a maximum at a pore size of around 6.3 nm, i.e., at the same diameter as the original SBA-15, implying that a considerable amount of surface area inside the pores is uncoated. Especially the pore sizes of tfSBA–L-CeO2–air are distributed over a wider range towards lower values, suggesting the presence of CeO2 crystallites inside the pores. In contrast, asSBA–L-CeO2–N2 shows a maximum at a decreased pore diameter of 5.8 nm, as a result of a more even coating of the pores with nano-scale CeO2. For illustration, Fig. S1 in the ESI† provides schematic diagrams of the pore structures of these three samples, as proposed on the basis of the above analysis. In summary, for tfSBA–L-CeO2–air, the growth of crystalline ceria results in the presence of narrowed pores, while in the case of asSBA–L-CeO2–air the limited diffusion of the cerium precursor leads to the formation of ink-bottle pores. By contrast, for asSBA–L-CeO2–N2, extensive diffusion of cerium ions results in an evenly coated porous matrix.
2. Mechanism of CeO2 dispersion during calcination
Previously, the good dispersion on asSBA-15 has been proposed to be due to the existence of template P123, resulting in confined spaces for CeO2 crystal growth, however, without providing direct evidence. To elucidate the interaction between the SBA-15 support and the ceria species during calcination, TG analysis and online gas-phase FTIR spectroscopy, as well as in situ Raman, DR UV-vis, and DRIFT spectroscopies were applied.First, we applied TG analysis to gain detailed insight into the decomposition of the template-containing SBA-15 during calcination, compared to bare asSBA-15 and the cerium precursor Ce(NO3)3·6H2O as reference (see Fig. 3a), following the temperature program given in Fig. 1a. The observed thermal decomposition of bare as-made SBA-15 shows a single weight loss of 47 wt% at about 120 °C, which is associated with the decomposition of triblock copolymer P123 slightly embedded in the siliceous pore walls.37 Previous studies have addressed the decomposition mechanism of bare cerium nitrate Ce(NO3)3·6H2O in air by TGA, as summarized in Fig. S2 (ESI†).38,39 Here, by combining TG and DTG analysis (see Fig. 3a and Fig. S3, ESI†), we identified 221 °C as a critical temperature point, attributed to the onset of cerium nitrate decomposition. Weight losses observed below 221 °C are assigned to the release of surface water and structural water, while at temperatures above 221 °C the decomposition of nitrate resulted in the release of NOx gas (see below, Fig. 3b) and a further substantial weight loss of 35 wt%. Sample tfSBA–L-CeO2 calcined in air shows a substantial decrease in weight below 200 °C due to lower onset temperatures for the release of water and cerium nitrate decomposition compared to bare cerium nitrate.
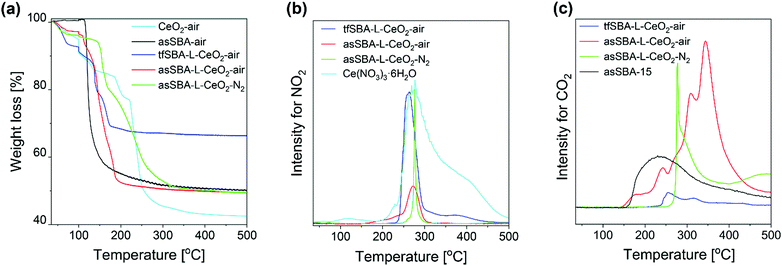 | ||
| Fig. 3 TGA profiles (a), and IR intensities of exhaust NO2 (b), and CO2 (c) during calcination of bare asSBA-15, bare cerium nitrate, and cerium nitrate/SBA-15 mixtures, following the protocol given in Fig. 1a. | ||
However, because, for the mixed samples (cerium nitrate/SBA-15), the weight loss reflects a more complex interplay of different processes, the exhaust was continuously monitored by gas-phase FTIR spectroscopy. To this end, Fig. 3b depicts the temperature-programmed evolution of NO2 gas (at 1629 cm−1)40 resulting from cerium nitrate decomposition. As a reference, the NO2 evolution of bare Ce(NO3)3·6H2O salt is shown (see light-blue curve), which is characterized by a sharp increase at 240 °C and a slower decline up to ∼500 °C, in agreement with the literature.39 There is an additional small peak at about 120 °C, indicating the evaporation of aqueous acid azeotrope, as discussed in the context of Fig. S2 (ESI†). Compared to the bare cerium salt, the NO2 signal of tfSBA–L-CeO2–air appears within a much narrower temperature range, suggesting the influence of SBA-15 on the decomposition of cerium nitrate. The lack of NO2 features at lower temperatures, i.e., at around 120 °C and at 190–230 °C, suggests the inhibition of azeotrope formation by dry SBA-15. In contrast, the sample asSBA–L-CeO2–air shows an increasing signal at 160–250 °C, which is attributed to template P123 decomposition, producing water to form the HNO3 azeotrope, as well as a stronger nitrate decomposition peak with an onset at ∼250 °C. For asSBA–L-CeO2–N2, the cerium nitrate precursor is observed to decompose within a very narrow temperature window (250 °C–300 °C), indicating differences in the interaction between precursor and template as a function of the calcination conditions.
Fig. 3c depicts the temperature-programmed evolution of exhaust CO2 gas (at 2350 cm−1)40 resulting from the decomposition of template P123. For bare as-made SBA-15, the decomposition starts at around 155 °C and extends up to 500 °C. Sample tfSBA15–L-CeO2–air shows a small feature at 240–350 °C, originating from residual P123 after calcination. By comparison of Fig. 3b and c, it can be seen that the temperature range of the CO2-related band overlaps with that of the NO2 band, possibly leading to synergetic effects in the decomposition and oxide formation processes. The sample asSBA–L-CeO2–air exhibits several CO2-related peaks. Compared to the single broad CO2 band detected for bare asSBA-15, these more discrete features indicate the presence of different intermediate states during P123 decomposition. In contrast, when the calcination is performed in N2, a significant amount of CO2 is released within a very narrow temperature window (270–275 °C), strongly overlapping with that of the NO2 release (see Fig. 3b), reflecting an interaction between the decomposition of P123 and that of cerium nitrate, while the CO2 emission at higher temperatures can be ascribed to the decomposition of oxygen-containing fragments of the template.
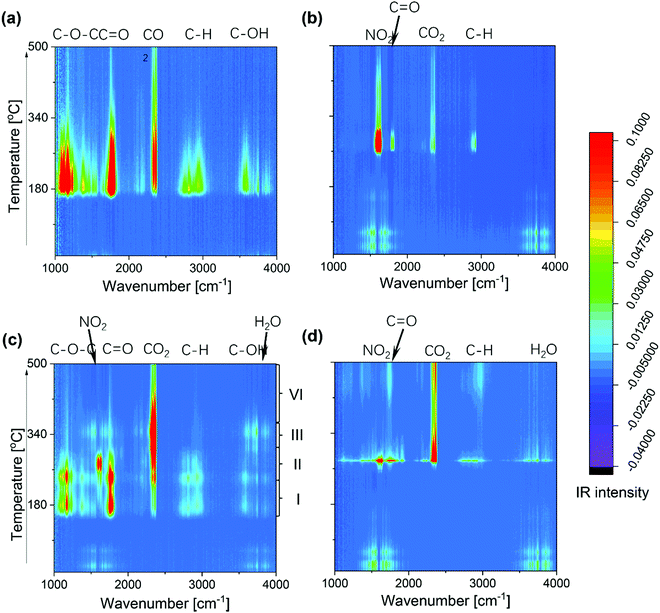
To gain more detailed insight into the decomposition processes, Fig. 4 shows the temporal evolution of all exhaust gases during calcination, as detected by online gas-phase IR analysis. Features at around 1150–1250 cm−1 are assigned to C–O–C stretching modes,41 those at 1350 cm−1 and 2800–3000 cm−1 to C–H bending and stretching modes, respectively.41 and those at 1750 and 3638 cm−1 to C![[double bond, length as m-dash]](https://www.rsc.org/images/entities/char_e001.gif) O and O–H stretching modes, respectively.40
O and O–H stretching modes, respectively.40
For bare asSBA-15, the P123 decomposes directly to gaseous CO2 as well as C1 or C2 fragments, starting at around 170 °C. In the case of tfSBA–L-CeO2–air, the decomposition of cerium nitrate, leading to NO2 formation, and small amounts of CO2 and Cn ketone are observed from 260 °C onwards. The exhaust gas evolution of asSBA–L-CeO2–air is characterized by four stages, beginning at about 160 (I), 240 (II), 300 (III), and 350 °C (IV), respectively, consistent with the discrete CO2 peaks in Fig. 3c: In stage I, Cn fragments (including ketone, alcohol, and ether) are formed, while NO2 shows a gradual increase, indicating that P123 fragments may affect the decomposition of cerium nitrate, considering the higher onset temperature for decomposition observed for tfSBA–L-CeO2–air. In stage II, which corresponds to the temperature range of the original cerium nitrate decomposition, a facilitated decomposition of P123 compared to bare asSBA-15 is observed, which may be attributed to a catalytic effect by the formed ceria (see below). In stage III, most of the residual P123 is catalytically converted by ceria to CO2 and H2O, while in stage IV more stable fragments are decomposed.
Summarizing, from the above in situ gas-phase results we conclude that P123 fragments facilitate the decomposition of cerium nitrate, while in turn the formed ceria catalyses the decomposition of P123. Interestingly, for sample asSBA–L-CeO2–N2, P123 and cerium nitrate decompose almost simultaneously within a narrow temperature window at about 280 °C, which equals the decomposition temperature of cerium nitrate, according to the tfSBA–L-CeO2–air and asSBA–L-CeO2–air results. Thus, we can conclude that the inert atmosphere inhibits the decomposition of P123 at low temperatures (see also Fig. S4, ESI†), allowing an increased catalytic interaction between cerium nitrate and P123 at elevated temperature, boosting the nucleation of nano ceria.
The in situ Raman spectra of tfSBA–L-CeO2–air, asSBA–L-CeO2–air, and asSBA–L-CeO2–N2 during calcination are mainly characterized by Raman features at 457, 745, and 1046 cm−1 (see Fig. S5, ESI†). The band at about 460 cm−1 is assigned to the triply degenerate symmetrical stretching mode (F2g) of ceria,42,43 and its position and shape are known to depend on the detailed ceria lattice structure.44–46 The Raman features at 745 cm−1 and 1046 cm−1 originate from bending and stretching vibrations of free nitrate, respectively.47Fig. 5 compares the temperature-dependent transformation of cerium nitrate into ceria for the three samples, focusing on the nitrate stretching mode at 1046 cm−1 to monitor the precursor decomposition (a) and the F2g mode at 457 cm−1 to describe formation of crystalline ceria (b). For tfSBA–L-CeO2–air, the cerium nitrate features disappear at 300 °C, while those for ceria start to appear at 250 °C, implying simultaneous cerium nitrate decomposition and ceria formation. Initially, a broad F2g-related band is detected at about 450 cm−1, which undergoes a narrowing and red-shift to 457 cm−1 with increasing temperature, thus indicating the growth of ceria crystallites (see Fig. S5a, ESI†). The additional smaller features at about 250 and 279 cm−1 are attributed to nitro- and ceria-related vibrations and discussed in the context of Fig. S5 (ESI†). In the case of the asSBA–L-CeO2 samples, temperature windows of about 250–300 °C (in air) and 250–450 °C (in N2) were detected. Sample asSBA–L-CeO2–air shows the F2g band only at about 300 °C, suggesting an inhibited ceria growth process. In contrast, in the case of asSBA–L-CeO2–N2, a F2g band is only indicated, consistent with the presence of amorphous ceria and/or very small ceria crystallites.
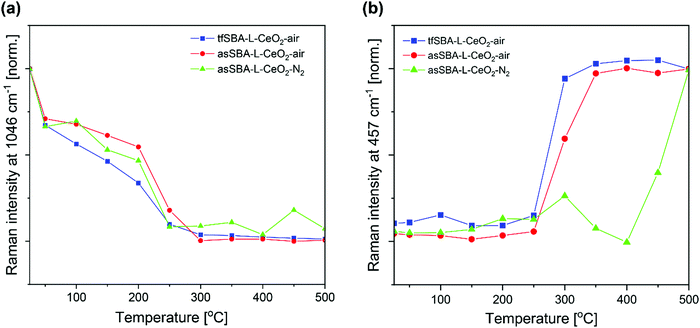 | ||
| Fig. 5 Temperature-dependent Raman intensities (514.5 nm) at 1046 cm−1, representing cerium nitrate (a), and at 457 cm−1, representing CeO2 (b), recorded during calcination, following the protocol given in Fig. 1a. The corresponding Raman spectra are shown in Fig. S5 (ESI†). | ||
Previously, a possible ion-exchange reaction on silicate adsorbent has been reported:19,48
| Ce–O–NO2 + OH− → Ce–OH + NO3− | (1) |
In situ DR UV-vis spectra were recorded to gain information about changes in the coordination environment of cerium ions during the transformation from Ce(NO3)3 to CeO2 (see Fig. 6). The initial DR UV-vis spectra of tfSBA–L-CeO2–air, asSBA–L-CeO2–air, and asSBA–L-CeO2–N2 at low temperature are characterized by typical features of Ce(NO3)3 at 218, 255, and 314 nm, which correspond to a 4f1-5d1 electronic transfer of Ce3+, a charge transfer (CT) of O2− 2p to Ce3+ 4f/5d, and a CT of Ce3+ 5d to O2− 2p, respectively.49 At higher temperature, spectra show a broad absorption band at 220–320 nm, which can be attributed to a CT band of O2− to Ce4+ (at ∼270 nm) and inter-band transitions (at ∼310 nm) of ceria. With increasing temperature from room temperature to 500 °C, tfSBA–L-CeO2–air (see Fig. 6a) shows an increase of the bands at 320 nm and 255 nm, but a decrease of the band at 220 nm, which is attributed to the transformation of nitrate to oxide. In addition, there is a shift of the absorption edge from 370 nm for Ce(NO3)3 to 470 nm for CeO2. For the samples asSBA–L-CeO2–air (see Fig. 6b) and asSBA–L-CeO2–N2 (see Fig. 6c) similar overall changes were observed, i.e., the band at 260 nm increased, while the shoulder band at 320 nm disappeared. The presence of noise signals in the UV region can be explained by the strong absorption of the carbon-containing P123 template. Similarly, the absorption edge shifted from 370 nm to 450 nm for asSBA–L-CeO2 calcined in air or in N2/air. The intensity at about 380 and 250 nm has been reported to be proportional to the amount of Ce4+ ions in an octahedral/polymeric and a tetrahedral coordination environment of CeO2, respectively.50 Thus, we can conclude that there is more tetrahedrally coordinated cerium present in asSBA–L-CeO2–air/N2 than in tfSBA–L-CeO2–air after calcination (see Fig. S6, ESI†).
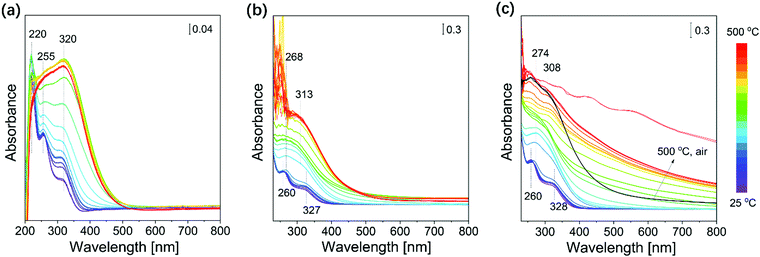 | ||
| Fig. 6 In situ DR UV-vis spectra during the calcination of (a) tfSBA–L-CeO2–air, (b) asSBA–L-CeO2–air, and (c) asSBA–L-CeO2–N2, following the protocol given in Fig. 1a. | ||
For bare CeO2, the direct band gap energy (Eg) can be calculated from the DR UV-vis spectra according to51
| αhv = A(hv − Eg)1/2 | (2) |
| Ce(NO3)3·xH2O → Ce(NO3)3(s) → CeONO3 (s) → CeO2−x(s) |
The Eg values decrease rapidly for tfSBA–L-CeO2–air to reach a relatively stable state at about 275 °C, while asSBA–L-CeO2–air and asSBA–L-CeO2–N2 require higher temperatures of ∼375 °C and 500 °C to reach their final state, respectively. In addition, with increasing temperature from 300 to 500 °C, the band gap energy increases from 2.90 eV to 3.12 eV for tfSBA–L-CeO2–air, suggesting the growth of CeO2 crystallites. In contrast, for asSBA–L-CeO2–air, the band gap reaches its minimum value of 2.85 eV at about 375 °C and then stays unchanged at higher temperature, indicative of a stable ceria crystallite size. Finally, for asSBA–L-CeO2–N2, the determined Eg value suggests that there is no dominant ceria crystal phase formation with N2 at 500 °C, while subsequent calcination for 2 h in air at 500 °C induces an Eg red-shift to 2.71 eV, which may indicate the formation of tiny CeO2 crystallites.
Fig. 7 shows in situ DRIFT spectra of tfSBA–L-CeO2–air, asSBA–L-CeO2–air, and asSBA–L-CeO2–N2 during the calcination process. The assignments for the observed IR features are summarized in Table S1 (ESI†). Briefly, in the low-wavenumber region (1400–1800 cm−1), mainly bands of nitrogen-containing species, and in the high-wavenumber region (>3000 cm−1) hydroxyl-related features are detected. In addition, there are features attributed to vibrational modes of organic groups, such as C–O, C![[double bond, length as m-dash]](https://www.rsc.org/images/entities/char_e001.gif) O, and C–H, originating from P123 in the case of the asSBA-15-based samples, and from a small amount of residual P123 in the case of the tfSBA-15-based sample. As can be seen in Fig. 7, all three samples exhibit a distinct change in vibrational structure at a critical temperature. In detail, at low temperatures, sample tfSBA–L-CeO2–air shows a broad band at about 3200–3600 cm−1, originating from H-bonded hydroxyl groups, which disappears when the temperature is raised from 225 °C to 275 °C, suggesting the removal of crystal water from Ce(NO3)3·6H2O. Simultaneously, a strong decline of the nitrate features (at 1400–1800 cm−1) is detected,52 indicating the decomposition of cerium nitrate. Similarly, for asSBA–L-CeO2–air and asSBA–L-CeO2–N2, there are rather sudden spectral changes within 225–275 °C and 275–300 °C. These observations further prove that the inert gas causes a delay in the decomposition of the cerium precursor. The asymmetric peak at 3740 cm−1 is typical for Si–OH groups, while the feature at 3700 cm−1 is attributed to Ce–OH.45 It is noteworthy that tfSBA–L-CeO2–air shows a peak at 3740 cm−1 over the whole temperature range, providing evidence for the presence of uncovered silica, even after CeO2 formation. For asSBA–L-CeO2–air, at the beginning no peak at 3740 cm−1 is detected, but at temperatures >275 °C, indicating that surface Si-OH is initially covered by the template, but emerges after the removal of P123. At low temperatures, the sample asSBA–L-CeO2–N2 shows spectra similar to those of asSBA–L-CeO2–air, but the appearance of the Ce–OH peak at 3700 cm−1 evidences that the silica surface is coated by ceria. Based on these changes of the surface hydroxyl groups, we can conclude that P123 inside the pores shrinks to the pore wall when the temperature is increased. After reaching a critical temperature, surface Si–OH is exposed. On the other hand, the observation of Ce–OH in the absence of silanol features clearly shows that the formed ceria coats the silica surface.
O, and C–H, originating from P123 in the case of the asSBA-15-based samples, and from a small amount of residual P123 in the case of the tfSBA-15-based sample. As can be seen in Fig. 7, all three samples exhibit a distinct change in vibrational structure at a critical temperature. In detail, at low temperatures, sample tfSBA–L-CeO2–air shows a broad band at about 3200–3600 cm−1, originating from H-bonded hydroxyl groups, which disappears when the temperature is raised from 225 °C to 275 °C, suggesting the removal of crystal water from Ce(NO3)3·6H2O. Simultaneously, a strong decline of the nitrate features (at 1400–1800 cm−1) is detected,52 indicating the decomposition of cerium nitrate. Similarly, for asSBA–L-CeO2–air and asSBA–L-CeO2–N2, there are rather sudden spectral changes within 225–275 °C and 275–300 °C. These observations further prove that the inert gas causes a delay in the decomposition of the cerium precursor. The asymmetric peak at 3740 cm−1 is typical for Si–OH groups, while the feature at 3700 cm−1 is attributed to Ce–OH.45 It is noteworthy that tfSBA–L-CeO2–air shows a peak at 3740 cm−1 over the whole temperature range, providing evidence for the presence of uncovered silica, even after CeO2 formation. For asSBA–L-CeO2–air, at the beginning no peak at 3740 cm−1 is detected, but at temperatures >275 °C, indicating that surface Si-OH is initially covered by the template, but emerges after the removal of P123. At low temperatures, the sample asSBA–L-CeO2–N2 shows spectra similar to those of asSBA–L-CeO2–air, but the appearance of the Ce–OH peak at 3700 cm−1 evidences that the silica surface is coated by ceria. Based on these changes of the surface hydroxyl groups, we can conclude that P123 inside the pores shrinks to the pore wall when the temperature is increased. After reaching a critical temperature, surface Si–OH is exposed. On the other hand, the observation of Ce–OH in the absence of silanol features clearly shows that the formed ceria coats the silica surface.
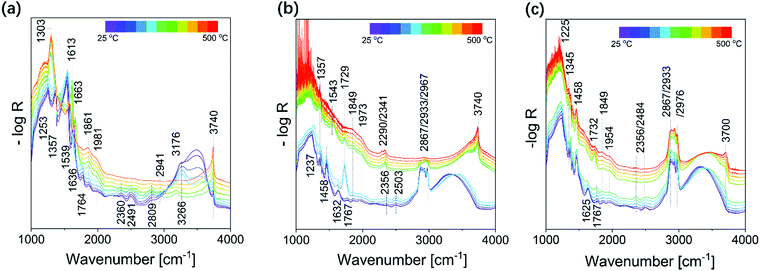 | ||
| Fig. 7 In situ DRIFT spectra during calcination of (a) tfSBA–L-CeO2–air, (b) asSBA–L-CeO2–air, and (c) asSBA–L-CeO2–N2, following the protocol given in Fig. 1a. | ||
3. Physical role of P123 in nanoconfinement formation
Previously, it had been proposed that the template could form a confined space to hinder the growth of larger crystallites. An unverified hypothesis was that the confined space was formed between the P123 micelles and the inner wall of SBA-15. As part of our detailed analysis, in situ DRIFT spectra show Si–OH-related signals at about 3734 cm−1, which appear after the removal of P123, strongly suggesting that P123 shrinks to the wall with increasing temperature. Especially, at low temperatures, the P123 chains are stabilized by their integration into the silica wall, while in the shrinkage stage, the water loss would break the central micelle structure (see Scheme 3). Thus, P123 tends to shrink to the inner wall, forming a confined space in the pore centre, and cerium ions entering the pore are coordinated by P123, as shown in Scheme 3, overturning previous hypotheses.29 In the further course of the synthesis, cerium, initially coordinated by P123 in the central confinement,19 is dispersed onto the silica surface when the template is removed at higher temperatures (see Scheme 3). Besides shrunk P123, carbon (deposited during calcination at higher temperatures) may contribute to the suppression of CeO2 agglomeration by further confining the space for the ceria growth.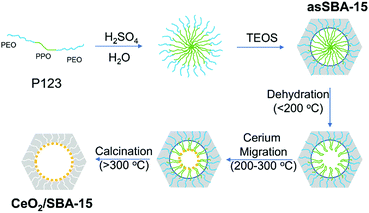 | ||
| Scheme 3 Schematic diagram of the template-assisted processes leading to ceria dispersion within the mesopores matrix. | ||
4. Chemical role of P123 for co-catalytic interaction with ceria species
Based on the findings described above, the calcination process involves three steps, i.e., decomposition of cerium nitrate, migration of cerium species, and nucleation/growth of ceria. The final dispersion of ceria is shown to depend on the relative decomposition temperatures of P123 and cerium nitrate. The TG and FTIR results have revealed that the decomposition behaviour of cerium nitrate/SBA-15 mixtures significantly deviates from that of bare cerium nitrate and P123 containing SBA-15, confirming the presence of interactions between cerium nitrate and the P123 template.Calcination of mixed samples in air with the assistance of P123 results in the coordination of cerium ions by P123, while cerium nitrate migrates into the pores.19 Due to the catalytic reaction between cerium ions and P123, ceria nanoparticles are formed by oxidation in air, while without P123, thermal decomposition of cerium nitrate occurs over a wide temperature range, accompanied by nucleation and growth of ceria crystallites (see Scheme 4). The catalytic reaction facilitates the oxidation of P123-coordinated cerium to ceria nuclei at even lower temperature than the critical decomposition temperature of bare Ce(NO3)3·6H2O. Meanwhile, reduction by P123 consumes lattice oxygen, which slows down the growth of ceria nanocrystals, thus increasing dispersion of ceria on SBA-15.
 | ||
| Scheme 4 Calcination of cerium nitrate with (left) or without (right) the assistance of template P123. | ||
Based on the knowledge of the catalytic effect of P123, the synthesis protocol for CeO2/SBA-15 was modified by application of an inert N2 atmosphere to further improve the ceria dispersion. Considering the low thermal stability of P123, which decomposes at a temperature of about 115 °C (TGA) in air, the nitrogen atmosphere could delay the decomposition of P123 into carbon chain fragments, thus inhibiting the catalytic oxidation induced formation of ceria nuclei at an early stage until the decomposition temperature of cerium nitrate. Reaching this temperature results in an explosive nucleation of ceria and catalytic decomposition of P123, which is favourable for the formation of a homogeneous nanoscale grain structure.
5. DeNOx performance
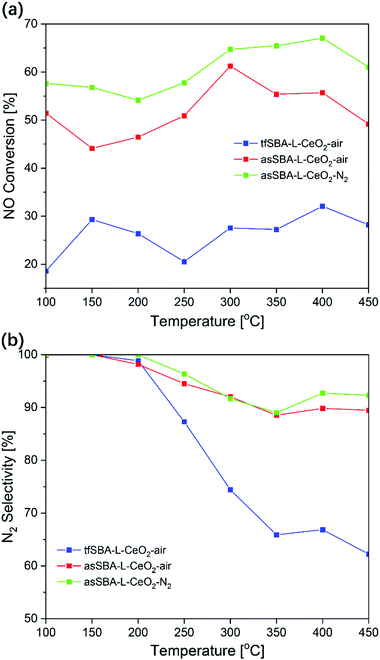
Fig. 8 summarizes the catalytic performance of CeO2/SBA-15 samples in NH3-SCR within a temperature range of 100–450 °C. Sample tfSBA–L-CeO2–air shows the lowest NO conversion (<30%) over the whole temperature range (see Fig. 8a) and the lowest N2 selectivity in the high-temperature range (see Fig. 8b). The low reactivity in NH3-SCR is in agreement with that of bare CeO2 reported previously.42 Sample asSBA–L-CeO2–air, which is based on as-made SBA-15 and is calcined in air atmosphere, shows a dramatic improvement in NO conversion and N2 selectivity, exhibiting a maximum in NO conversion of about 60% at 300 °C. Combining the template interaction with a calcination in inert N2 atmosphere yields sample asSBA–L-CeO2–N2, which shows a further significant increase in NO conversion compared to asSBA–L-CeO2–air, and even the N2 selectivity slightly improves. Thus, the NH3-SCR performance of these three samples follows the order asSBA–L-CeO2–N2 > asSBA–L-CeO2–air ≫ tfSBA–L-CeO2–air, which resembles the extent of ceria dispersion on the SBA-15 surface, as discussed above. In addition, Fig. S9 (ESI†) provides results from a long-term test (20 h) at 300 °C, demonstrating the stability of these samples for NH3-SCR. At high ceria loading, similar trends were observed (see Fig. S8, ESI†), with overall higher NO conversions compared to low cerium loading. Especially, the N2 selectivity of asSBA–H-CeO2–N2 was significantly higher than that of asSBA–H-CeO2–air, demonstrating that an inert calcination atmosphere could further improve the CeO2 dispersion and thus the catalytic performance even at high ceria loading. Table S2 (ESI†) summarizes reactivity data of ceria-based catalysts for NH3-SCR. In general, pure ceria shows a lower NOx performance than silica supported ceria, prepared by controlled nanoconfinement thus further improving the ceria dispersion.Experimental section
1. Materials preparation
Prior to catalytic testing in NH3-SCR, all samples treated in N2 during synthesis were calcined in air for 2 h at 500 °C to remove residual template.
2. Characterization
3. Catalytic tests
The SCR performance of the catalysts was measured in a commercial CCR1000 reactor (Linkam Scientific Instruments) in combination with quantitative gas-phase FTIR spectroscopy (see above). The flow rate of the inlet gases was adjusted by mass flow controller, by employing the following gas sources: 2000 ppm NO/N2 (±0.25% abs.), 2000 ppm NH3/N2 (±0.25% abs.), O2 (≥99.999%), and N2 (≥99.999%). For catalytic testing in NH3-SCR, the concentrations of NO, NH3, and O2 in the feed gas mixture were set to 500 ppm, 500 ppm, and 5%, respectively, and balanced with N2. The weight of the catalyst samples loaded into the reactor was 15 mg; the feed gas mixture passed through the catalyst bed at a total flow rate of 50 ml min−1, resulting in a gas hourly space velocity (GHSV) of 30![[thin space (1/6-em)]](https://www.rsc.org/images/entities/char_2009.gif) 000 h−1.
000 h−1.
Using the detected concentrations of NO, NO2, N2O, and NH3 in the outlet gas flow, and the feed gas concentrations, the N2 concentration can be calculated based on conservation of mass, assuming that besides N2 nitrogen is present only in the form of the gases listed above. NOx conversion and N2 selectivity were calculated using the following equations:
 | (3) |
 | (4) |
Conclusions
Herein, we have reported our studies of the synthesis mechanism of CeO2/SBA-15 catalysts by the solid-state impregnation method using a combination of TG and IR gas-phase analysis, as well as in situ Raman, DR UV-vis, and DRIFT spectroscopies. These studies have revealed that ceria formation on mesoporous SBA-15 during calcination involves first cerium precursor decomposition, then migration of cerium species, and finally ceria formation at high temperature. Based on our findings we can explain the roles of the template inside the mesoporous matrix: on one hand P123 acts as a physical barrier to prevent the growth of ceria, on the other, P123 acts as a chemical reactant, which interacts with cerium ions, thus enabling the catalytic decomposition of the cerium precursor.With the gained mechanistic knowledge of the formation of CeO2/SBA-15 materials, a new calcination protocol was developed based on an intended retardation of the decomposition of the template and the cerium precursor, leading to a higher dispersion of ceria inside the pores and thus a significant improvement of catalytic performance in NH3-SCR.
An important finding of the study is that the precursor itself can facilitate the synthesis of the catalyst, as demonstrated here for a ceria-based catalyst, by using both the template and the gas atmosphere to control the catalytic reaction conditions. Our results underline the importance of the details of the calcination process for defining the catalyst properties. Application of in situ spectroscopy allows one to monitor the preparation process, including calcination, thus facilitating a rational synthesis of supported catalysts as shown here in the context of NOx abatement. The outlined approach is expected to trigger more studies on the development of improved catalysts based on a careful design of the catalytic preparation reactions.
Author contributions
The manuscript was written through contributions of both authors. Original idea, C. H.; conceptualization, J. S. and C. H.; methodology, J. S.; formal analysis, J. S.; writing – original draft preparation, J. S.; writing – review and editing, C. H.; supervision, C. H.; project administration, C. H.Conflicts of interest
There are no conflicts to declare.Acknowledgements
The authors thank Martin Brodrecht for N2 adsorption–desorption measurements, Kathrin Hofmann for XRD analysis, Stefan Lauterbach for TEM analysis, and Karl Kopp for XPS analysis and technical support. Financial support by the Deutsche Forschungsgemeinschaft (DFG) is gratefully acknowledged.Notes and references
- W. Li, J. Liu and D. Y. Zhao, Nat. Rev. Mater., 2016, 1, 1–17 Search PubMed.
- D. Y. Zhao, J. L. Feng, Q. S. Huo, N. Melosh, G. H. Fredrickson, B. F. Chmelka and G. D. Stucky, Science, 1998, 279, 548–552 CrossRef CAS PubMed.
- F. Khanmohammadi, M. A. Molina, R. M. Blanco, S. N. Azizi, C. Marquez-Alvarez and I. Diaz, Microporous Mesoporous Mater., 2020, 309, 1–6 CrossRef.
- S. Inagaki, S. Guan, Y. Fukushima, T. Ohsuna and O. Terasaki, J. Am. Chem. Soc., 1999, 121, 9611–9614 CrossRef CAS.
- J. Nakazawa, B. J. Smith and T. D. P. Stack, J. Am. Chem. Soc., 2012, 134, 2750–2759 CrossRef CAS PubMed.
- S. F. Zhang, B. Zhang, H. J. Liang, Y. Q. Liu, Y. Qiao and Y. Qin, Angew. Chem., Int. Ed., 2018, 57, 1091–1095 CrossRef CAS PubMed.
- P. Hongmanorom, J. Ashok, G. H. Zhang, Z. F. Bian, M. H. Wai, Y. Q. Zeng, S. B. Xi, A. Borgna and S. Kawi, Appl. Catal., B, 2021, 282, 119564 CrossRef CAS.
- C. Hess, in Comprehensive Inorganic Chemistry II, ed. J. Reedijk and K. Poeppelmeier, Elsevier, Amsterdam, 2013, vol. 7 Search PubMed.
- V. Chaudhary and S. Sharma, J. Porous Mater., 2017, 24, 741–749 CrossRef CAS.
- P. Hongmanorom, J. Ashok, S. Das, N. Dewangan, Z. Bian, G. Mitchell, S. Xi, A. Borgna and S. Kawi, J. Catal., 2020, 387, 47–61 CrossRef CAS.
- R. R. Chada, S. S. Enumula, K. S. Reddy, M. D. Gudimella, S. R. R. Kamaraju and D. R. Burri, Microporous Mesoporous Mater., 2020, 300, 110144 CrossRef CAS.
- O. Daoura, G. Fornasieri, M. Boutros, N. El Hassan, P. Beaunier, C. Thomas, M. Selmane, A. Miche, C. Sassoye, O. Ersen, W. Baaziz, P. Massiani, A. Bleuzen and F. Launay, Appl. Catal., B, 2021, 280, 119417 CrossRef CAS.
- J. W. Fan, X. F. Niu, W. Teng, P. Zhang, W. X. Zhang and D. Y. Zhao, J. Mater. Chem. A, 2020, 8, 17174–17184 RSC.
- R. A. Mitran, D. C. Culita and I. Atkinson, Microporous Mesoporous Mater., 2020, 306, 110484 CrossRef CAS.
- R. Manno, P. Ranjan, V. Sebastian, R. Mallada, S. Irusta, U. K. Sharma, E. V. Van der Eycken and J. Santamaria, Chem. Mater., 2020, 32, 2874–2883 CrossRef CAS.
- N. N. Mikheeva, V. I. Zaikovskii and G. V. Mamontov, Microporous Mesoporous Mater., 2019, 277, 10–16 CrossRef CAS.
- C. Chong, A. H. K. Owgi, N. Ainirazali, S. Y. Chin and H. D. Setiabudi, Mater. Today: Proc., 2018, 5, 21644–21651 CAS.
- S. N. Bukhari, A. H. K. Owgi, N. Ainirazali, D. V. N. Vo and H. D. Setiabudi, Mater. Today: Proc., 2018, 5, 21620–21628 CAS.
- W. W. Yang, H. M. Liu, Y. M. Li and D. H. He, Microporous Mesoporous Mater., 2016, 228, 174–181 CrossRef CAS.
- W. W. Yang, H. M. Liu, Y. M. Li, H. Wu and D. H. He, Int. J. Hydrogen Energy, 2016, 41, 1513–1523 CrossRef CAS.
- B. Dragoi, G. Laurent, S. Casale, T. Benamor, B. Lebeau, C. Boissiere, F. Ribot, M. Selmane, P. Schmidt, D. Kreher and A. Davidson, J. Sol–Gel Sci. Technol., 2019, 91, 552–566 CrossRef CAS.
- B. Dragoi, I. Mazilu, A. Chirieac, C. Ciotonea, A. Ungureanu, E. Marceau, E. Dumitriu and S. Royer, Catal. Sci. Technol., 2017, 7, 5376–5385 RSC.
- Y. Yin, W. J. Jiang, X. Q. Liu, Y. H. Li and L. B. Sun, J. Mater. Chem., 2012, 22, 18514–18521 RSC.
- Y. Yin, P. Tan, X. Q. Liu, J. Zhu and L. B. Sun, J. Mater. Chem. A, 2014, 2, 3399–3406 RSC.
- Y. Yin, D. M. Xue, X. Q. Liu, G. Xu, P. Ye, M. Y. Wu and L. B. Sun, Chem. Commun., 2012, 48, 9495–9497 RSC.
- Y. Yin, Z. H. Wen, X. Q. Liu, A. H. Yuan and L. Shi, Adsorpt. Sci. Technol., 2018, 36, 953–966 CrossRef CAS.
- Y. Yin, Z. F. Yang, Z. H. Wen, A. H. Yuan, X. Q. Liu, Z. Z. Zhang and H. Zhou, Sci. Rep., 2017, 7, 4509 CrossRef PubMed.
- Y. Yin, H. Wu, L. Shi, J. Q. Zhang, X. Y. Xu, H. Y. Zhang, S. B. Wang, M. Sillanpaad and H. Q. Sun, Environ. Sci.: Nano, 2018, 5, 2842–2852 RSC.
- Y. Yin, L. Shi, W. L. Li, X. N. Li, H. Wu, Z. M. Ao, W. J. Tian, S. M. Liu, S. B. Wang and H. Q. Sun, Environ. Sci. Technol., 2019, 53, 11391–11400 CrossRef CAS PubMed.
- A. Taratayko, Y. Larichev, V. Zaikovskii, N. Mikheeva and G. Mamontov, Catal. Today, 2021, 375, 576–584 CrossRef CAS.
- L. P. Han, S. X. Cai, M. Gao, J. Hasegawa, P. L. Wang, J. P. Zhang, L. Y. Shi and D. S. Zhang, Chem. Rev., 2019, 119, 10916–10976 CrossRef CAS PubMed.
- A. Trovarelli, Catal. Rev., 1996, 38, 439–520 CrossRef CAS.
- J. Strunk, W. C. Vining and A. T. Bell, J. Phys. Chem. C, 2011, 115, 4114–4126 CrossRef CAS.
- J. Shen and C. Hess, Catalysts, 2020, 10, 1386 CrossRef CAS.
- M. T. Weller, Inorganic materials chemistry, Oxford University Press, Oxford; New York, 1994 Search PubMed.
- J. P. Thielemann, F. Girgsdies, R. Schlogl and C. Hess, Beilstein J. Nanotechnol., 2011, 2, 110–118 CrossRef CAS PubMed.
- S. Y. Chen, T. Mochizuki, Y. Abe, M. Toba, Y. Yoshimura, P. Somwongsa and S. Lao-ubol, Appl. Catal., B, 2016, 181, 800–809 CrossRef CAS.
- E. A. Cochran, K. N. Woods, D. W. Johnson, C. J. Page and S. W. Boettcher, J. Mater. Chem. A, 2019, 7, 24124–24149 RSC.
- W. Kang, D. O. Ozgur and A. Varma, ACS Appl. Nano Mater., 2018, 1, 675–685 CrossRef CAS.
- N. Ulagappan and H. Frei, J. Phys. Chem. A, 2000, 104, 7834–7839 CrossRef CAS.
- Y. L. Liu and H. J. Kim, Sensors, 2017, 17, 1469 CrossRef PubMed.
- B. L. Zhang, S. G. Zhang and B. Liu, Appl. Surf. Sci., 2020, 529, 147068 CrossRef CAS.
- W. H. Weber, K. C. Hass and J. R. Mcbride, Phys. Rev. B: Condens. Matter Mater. Phys., 1993, 48, 178–185 CrossRef CAS PubMed.
- T. Suzuki, I. Kosacki, H. U. Anderson and P. Colomban, J. Am. Ceram. Soc., 2001, 84, 2007–2014 CrossRef CAS.
- A. Filtschew, K. Hofmann and C. Hess, J. Phys. Chem. C, 2016, 120, 6694–6703 CrossRef CAS.
- C. Schilling, A. Hofmann, C. Hess and M. V. Ganduglia-Pirovano, J. Phys. Chem. C, 2017, 121, 20834–20849 CrossRef CAS.
- A. Filtschew, D. Stranz and C. Hess, Phys. Chem. Chem. Phys., 2013, 15, 9066–9069 RSC.
- J. Seo, J. W. Lee, J. Moon, W. Sigmund and U. Paik, ACS Appl. Mater. Interfaces, 2014, 6, 7388–7394 CrossRef CAS PubMed.
- V. Nicolini, E. Varini, G. Malavasi, L. Menabue, M. C. Menziani, G. Lusvardi, A. Pedone, F. Benedetti and P. Luches, Mater. Des., 2016, 97, 73–85 CrossRef CAS.
- C. M. Aiube, K. V. de Oliveira and J. L. de Macedo, Catalysts, 2019, 9, 377 CrossRef CAS.
- S. Phokha, S. Pinitsoontorn, P. Chirawatkul, Y. Poo-arporn and S. Maensiri, Nanoscale Res. Lett., 2012, 7, 425 CrossRef PubMed.
- C. X. Wang, D. Z. Ren, J. C. Du, Q. G. Qin, A. M. Zhang, L. Chen, H. Cui, J. L. Chen and Y. K. Zhao, Catalysts, 2020, 10, 143 CrossRef CAS.
Footnote |
| † Electronic supplementary information (ESI) available: Additional images and characterization. See DOI: 10.1039/d1ma00658d |
| This journal is © The Royal Society of Chemistry 2021 |

