 Open Access Article
Tuning the magnetic properties of Sn1−x−yCe4+xCe3+yO2 nanoparticles: an experimental and theoretical approach
F. F. H.
Aragón†
 *a,
L.
Villegas-Lelovsky†
bc,
L.
Cabral
d,
M. P.
Lima
 c,
A.
Mesquita
 b and
J. A. H.
Coaquira
 ae
ae
aLaboratorio de Películas Delgadas, Escuela Profesional de Física, Universidad Nacional de San Agustín de Arequipa, Av. Independencia s/n, Arequipa, Peru. E-mail: ffharagon@gmail.com
bDepartamento de Física, IGCE, Universidade Estadual Paulista, 13506-900 Rio Claro, SP, Brazil
cDepartamento de Física, Centro de Ciências Exatas e de Tecnologia, Universidade Federal de São Carlos, São Carlos, SP 13565-905, Brazil
dInstituto de Física “Gleb Wataghin” (IFGW), Universidade Estadual de Campinas, 13083-859 Campinas, SP, Brazil
eNúcleo de Física Aplicada, Instituto de Física, Universidade de Brasília, Brasília, DF 70910900, Brazil
First published on 28th December 2020
Abstract
During the last decade, there was a substantial increase in the research on metal-doped oxide semiconductor nanoparticles due to advances in the engineering of nanomaterials and their potential application in spintronics, biomedicine and photocatalysis fields. In this regard, doping a nanomaterial is a powerful tool to tune its physicochemical properties. The aim of this work is to shine a new light on the role of the neighbouring elements on the oxidation state of the Ce-impurity, from both experimental and theoretical points of view. Herein, we present an accurate study of the mechanisms involved in the oxidation states of the Ce-ions during the doping process of SnO2 nanoparticles (NPs) prepared by the polymeric precursor method. X-ray diffraction measurements have displayed the tetragonal rutile-type SnO2 phase in all samples. However, the Bragg’s peak (111) and (220) located at 2θ ∼29° and ∼47° evidence the formation of a secondary CeO2 phase for samples with Ce content up to 10%. X-ray absorption near-edge structure (XANES) measurements, at Ce L3 edge, were performed on the NPs as a function of Ce content. The results show, on one side, the coexistence of Ce3+ and Ce4+ states in all samples; and on the other side, a clear reduction in the Ce3+ population driven by the increase of Ce content. It is shown that this is induced by the neighboring cation, and confirmed by magnetic measurements. The monotonic damping of the Ce3+/Ce4+ ratio experimentally, was connected with theoretical calculations via density functional theory by simulating a variety of point defects composed of Ce impurities and surrounding oxygen vacancies. We found that the number of oxygen vacancies around the Ce-ions is the main ingredient to change the Ce oxidation state, and hence the magnetic properties of Ce-doped SnO2 NPs. The presented results pave the way for handling the magnetic properties of oxides through the control of the oxidation state of impurities.
I. Introduction
The doping process developed around 1950 has been extensively used in order to tune the electrical, magnetic, optical and structural properties of host matrices. As is the case of silicon (largely applied in the industry), n- and p-type semiconductors are obtained by introducing donor and acceptor impurities, respectively. More recently, due to its unique properties that exist only at the nanometer scale, a great deal of attention has been devoted to investigate transition metals and rare earth doping oxides (SnO2, TiO2, In2O3, ZnO, among others),1–4 producing the so-called metal-doped oxide semiconductors. In these materials, among different possibilities, doping with multivalent elements results in systems with a high potential for future applications.5 We give special attention to the unique properties of Ce ion doping oxides. Whereas Ce4+ ions are non-magnetic, Ce3+ ions act as paramagnetic centers, due to the presence of one localized unpaired valence electron. Thus, tuning the Ce oxidation state could be an effective way to handle the magnetic properties of Ce doped oxides. However, the microscopic understanding of the doping mechanism (which is the condition under which an ion prefers to occupy crystal sites in the host lattice at a magnetic oxidized state (Ce3+) or non-magnetic oxidized state (Ce4+)) is an open question, demanding further effort to pave the way for future technological applications of metal-doped oxides. To our knowledge, little or no attention has been paid to explain the valence state preference of these ions in doped materials. In particular, the +3 valence state of cerium has a strong influence in the magnetic properties of the host materials and opens the possibility of the production of diluted magnetic semiconductors (DMSs) with high Curie temperature (Tc). Hence, Ce doped systems have been gathering much interest from the industrial viewpoint because of their potential to fabricate novel multifunctional semiconductor devices where the magnetic electric and optical properties are combined.The Ce-doped SnO2 nanostructure is a good candidate for this study. The interesting point about this type of material is that, regardless of the ions, they exhibit a ferromagnetic-like order above room temperature (at low doping content), which make them interesting materials for the next generation of spintronics, electronic, and optoelectronic devices.6–10 As is shown by Prellier et al., the coexistence of the electric and magnetic properties provides the possibility of generating a spin-valve system with enhanced magnetoresistance (MR).2 Besides, several works highlight this material as promising for gas sensor applications,11 such as that reported by Kumar et al. in recent publications indicating the room temperature ethanol sensing property, and the astonishing change from n-type to p-type12 semiconductor, associated with the Ce doping level in SnO2 lattices. Also, Watts et al. showed the use of this promising material for the oxidation of organic materials and the reduction of heavy metal-ions in industrial wastewater streams.13
Using the above mentioned research, in the present work, a systematic theoretical and experimental study was carried out, focusing on the effect of cerium doping on the physical properties. X-ray diffraction measurements (XRD), transmission electron microscopy (TEM), and X-ray absorption (XANES, and EXAFS) were used for this purpose. The experimental results display the coexistence of Ce3+ and Ce4+ states in all samples, tuned by the incremental increases of Ce content. Meanwhile, our theoretical findings suggest that the change of the coordination number of the oxygen ions surrounding Ce ions provokes the oxidation state change, and this fact shows the local tuning of the magnetic properties.
II. Methods
A. Experimental approach
Ce-doped SnO2 nanoparticles with Ce-content in the range from 0 to 30 mol% have been synthesized according to the polymeric precursor method. The undoped SnO2 noncrystalline sample was synthesized from tin(II) citrate (Sn22+(C6O7H4)), which was prepared from citric acid (C6O7H8) and tin(II) chloride (Sn2+Cl2) in agreement with the following equation:| C6O7H8+2Sn2+Cl2− → Sn22+(C6O7H4) + 4HCl | (1) |
Thermal annealing (TA) in the tin(II) citrate under air atmosphere was performed (see eqn (2)), promoting the oxidation from Sn2+ to Sn4+. The TA was made in two steps: firstly at 400 °C for 4 h; and additional calcination at 400 °C for 15 h. The latter was made in order to improve the crystallinity of the samples.
 | (2) |
Meanwhile, for the Ce-doped samples the Ce precursor is the cerium(III) nitrate Ce3+(N3)3, where the amount of Ce was controlled using the Ce/(Ce + Sn) ratio, and the same thermal treatment as the undoped sample was applied. For more details on the preparation, see ref. 14. X-ray powder diffraction (XRD) patterns were obtained using a commercial Bruker diffractometer (D8 advanced) with a CuKα radiation source (=1.5406 Å). The lattice parameters, as well as the average crystallite size and residual strain were determined from the XRD data analysis: in the approach the Bragg-diffraction peak has a Lorentzian shape which is implemented in the Jana2006 program,15 the half-value breadth (β) obtained from the Rietveld refinement method was carefully corrected from the instrumental broadening (β = βsample + βinstrument) using a single-crystalline Si as a standard sample. In order to separate the contribution of the size from the residual strain, the Williamson–Hall plot was used. The particle size and morphology have been determined for one of the samples by high-resolution transmission electron microscopy (HRTEM). The DC magnetic measurements were carried out using the SQUID (MPMS, Quantum Design) magnetometer, varying the temperature from 5 to 300 K, and applying magnetic fields up to ±70 kOe. In order to study the electronic and atomic structure, X-ray absorption spectroscopy (XAS) measurements were carried out in the X-ray absorption near-edge spectroscopy (XANES) region, located in the Ce L3-edge. For these measurements, pellets were made from the powders, and the XAS spectra were carried out at room temperature in transmission and fluorescence modes, and the energy was calibrated using standard Cr and Fe foils, respectively. The XAFS2 beamline at the Brazilian Synchrotron Light Laboratory (LNLS) was used, more details of the beamline used can be obtained from ref. 16. The data were analyzed using the Athena and Artemis interfaces.17
B. Theoretical approach and computational details
In order to characterize the trend of Ce-ion incorporation into the SnO2 structure, and elucidate the oxidation state, we used computational simulations at the atomistic scale to study different configurations and concentrations of the cerium doping atoms and oxygen vacancies in the SnO2 pristine cell. Our total energy calculations are based on density functional theory (DFT),18,19 by employing the semilocal Perdew–Burke–Ernzerhof (PBE) exchange and correlation functional,20 using the spin-polarized generalized gradient approximation (GGA), as implemented in the Vienna ab initio simulation package – VASP,21,22 version 5.4.4. The Kohn–Sham equations were solved using the projector augmented wave (PAW) method23,24 employing the following projectors: Sn(4d10, 5s2, 5p2), O(2s2, 2p4) and Ce(4f1, 5d1, 6s2), where the valence states are shown in parentheses. The SnO2 equilibrium volume (atomic forces) in the bulk-phase was reached by performing the stress-tensor minimization (total energy) calculation using a plane-wave cutoff of 829 eV (466 eV). For the Brillouin zone integration, we used the k-mesh of 1 × 1 × 2 for the stress-tensor and atomic force optimizations, while 2 × 2 × 4 for the electronic property calculations, such as the density of states. In every calculation, Gaussian smearing of 0.01 eV was employed, and the atoms were allowed to find their equilibrium atomic position when all the forces were smaller than 0.01 eV Å−1. In order to improve the limitations given by the PBE functional and to obtain a better description of the electronic band structure, a Hubbard correction within the GGA+U method proposed by Dudarev et al. was used,25 where the Hubbard U parameters are 3.5 eV and 4.5 eV on Sn-d and Ce-f states, respectively.In addition, the theoretical XANES spectra were calculated by the FEFF9 ab initio code.26 In our simulation of Ce L3 edge XANES, we used self-consistent potentials (SCF), and full multiple scattering (FMS) for the calculation of the real-space Green’s function approach. FMS calculations were performed using a Hedin–Lundqvist self-energy correction and adding a core hole in the final state rule (FSR). The potential values used for the atom species were 58, 8 and 50 for Ce, O and Sn, respectively. The cluster sizes used in the SCF and FMS routines were 4.6 Å and 6.0 Å respectively, which was enough to fulfil the required level of accuracy. Finally, the core-level broadening was reduced to match the experimental data.
III. Results and discussion
A. Experimental results
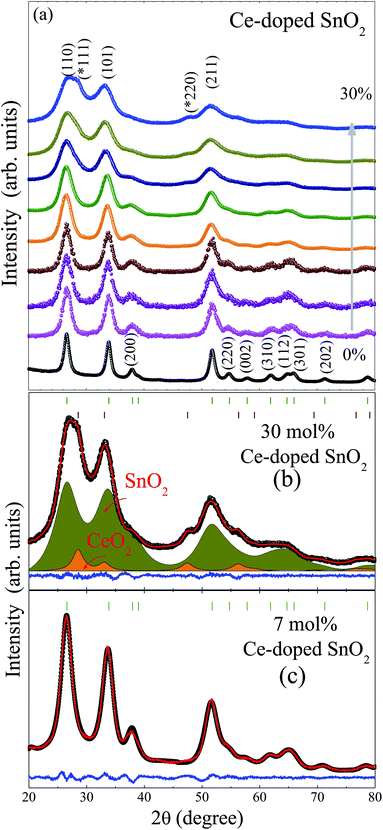
Fig. 1 provides the X-ray diffraction patterns of Ce-doped SnO2 nanoparticles. The rutile-type tetragonal structure (JCPDS card, 41-1445), with space group, P42/mnm, has been determined for all samples. The formation of this phase is retained for each dopant content. However, for samples with Ce content above 10 mol%, a secondary phase of cerium oxide (CeO2) was detected, which was evidenced by (111) and (220) diffraction peaks located at 2θ ∼29 and ∼47°. This result is in agreement with Raman spectroscopy measurements which will be published elsewhere. In order to obtain further information such as the lattice constant, the average crystallite size (〈D〉DRX), average residual strain (〈ε〉), and phase amount, the whole set of Bragg reflections were refined using the Rietveld refinement method, using Jana2006 software.27Typical Rietveld refinement analyses are shown in Fig. 1 for the 30 and 7 mol% Ce-doped samples, as can be seen, the 30 mol% XRD pattern displays the tetragonal SnO2 and the cubic CeO2 phases. Lattice constants a and c of undoped SnO2 were found at 4.73 and 3.18 Å, respectively. These values are in agreement with those expected from SnO2 NPs reported in the literature.28 However, the introduction of Ce ions to the SnO2 matrix, leads to the monotonic increase of lattice constants, and consequently to the unit cell volume (V) increase of up to 10 mol% Ce content, as shown in Table 1, and graphically in Fig. 2. This fact was associated with the substitution of Sn4+ ions by Ce3+ and/or Ce4+ ions, due to both Ce3+ (1.01 Å) and Ce4+ (0.87 Å) ions having ionic radii larger than Sn4+ (0.69 Å) (all for coordination VI).29 This fact is in agreement with the substitutional solution of Ce to Sn ions in the rutile-type crystalline structure. On the other hand, the change of the volume rate as is seen in Fig. 2(a) suggests a change in the Ce3+/Ce4+ rate, therefore, a shift of the oxidized state of cerium ions from Ce3+ to Ce4+, and for higher concentrations up to 10 mol%, the formation of the CeO2 secondary phase, indicating the occurrence of a doping saturation limit, tuned by the change of valence state from Ce3+ to Ce4+. This fact will be corroborated later by magnetic and XAS measurements. The average crystallite size and residual strain were determined by the Williamson–Hall plot method implemented within the Jana2006 software.27 The 〈D〉DRX has expected decreasing behavior with the Ce content change. This effect is correlated with surface segregation of the dopant ions on the particle surface.30,31 Due to the aliovalent nature of cerium (Ce3+ and Ce4+), the doping of the SnO2 matrix can produce an undoubtedly different type of substitution process. However, when analyzing the literature, for example, in Ti4+-doped SnO2 (ref. 32) and Al3+-doped SnO2, both have continuous decreasing crystallite size with increasing doping concentration.33 This suggests that the type of doping element has no dependence on the final particle size. This indicates that the monotonic crystallite size is correlated with the surface segregation of the dopant ions on the particle surface,30,31 leading to an increase in the nanocrystals’ surface energy, and reducing the average crystallite size with increasing dopant concentration. This migration process continued until it reached the nucleation regime where a second phase emerges.34 Our samples change around 10%, and afterward, a tendency to be constant is expected as shown in Fig. 2(b). The average crystallite size reduction is accompanied by an increase of the residual strain (see Table 1) associated with the cerium ions located in sites incorporated into SnO2 as a solid solution, provoking local distortions that lead to the breaking of the symmetry of the SnO6 octahedral structure.
| Ce (mol%) | a (Å) | c (Å) | V (Å3) | 〈D〉 (nm) | 〈ε〉 (%) | CeO2 (%) | |
| 0 | 4.7344 | 3.1844 | 71.38 | 5.6 | −0.385 | 0 | |
| 1 | 4.7287 | 3.1831 | 71.17 | 4.1 | 0.023 | 0 | |
| 2 | 4.7397 | 3.1887 | 71.64 | 3.9 | 0.380 | 0 | |
| 5 | 4.7416 | 3.1918 | 71.76 | 3.7 | 1.376 | 0 | |
| 7 | 4.7493 | 3.2036 | 72.26 | 3.7 | 1.191 | 0 | |
| 10 | 4.7525 | 3.2017 | 72.31 | 3.3 | 0.989 | 0 | |
| 20 | 4.7628 | 3.2110 | 72.84 | 2.8 | 1.864 | ∼3 | |
| 25 | 4.7522 | 3.2216 | 72.75 | 2.4 | 1.784 | ∼4 | |
| 30 | 4.7495 | 3.2151 | 72.52 | 2.2 | 1.565 | ∼5 | |
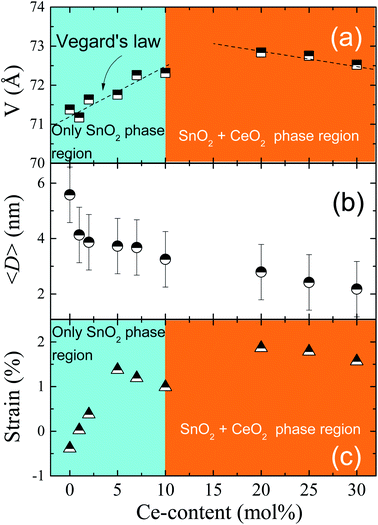 | ||
| Fig. 2 Evolution of the lattice volume (a), mean particle size 〈D〉DRX (b), and residual strain 〈ε〉 for the Ce-doped SnO2 nanoparticles (c). | ||
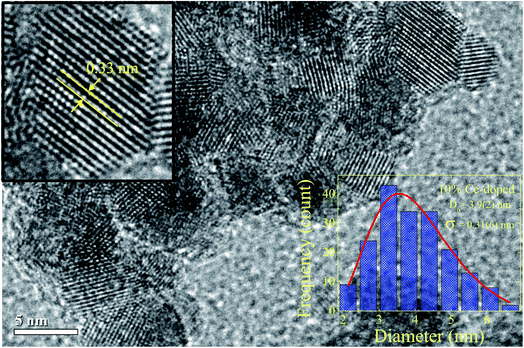
In order to assess the physical crystallite size, and compare it with the crystallite size obtained by XRD results, transmission electron microscopy images were obtained. Fig. 3 shows one of the TEM images obtained for the 10% Ce-doped SnO2 NPs. The particle sizes were obtained from the TEM images, and subsequently, a particle size histogram was made using the Sturges method, for more details see ref. 35. The bottom-right inset in Fig. 3 provides the obtained histogram. As observed, this histogram is well modeled by a log-normal distribution:  , the red line shows where D0 is the median value and σ is the polydispersity index. The median particle size value was assessed using DTEM = D0
![[thin space (1/6-em)]](https://www.rsc.org/images/entities/char_2009.gif) exp(σ2/2), and the value was estimated at 4.1 ± 0.3 nm, which is slightly higher than that obtained by XRD suggesting a surface amorphous phase, which could be associated with Ce-ion surface segregation. Furthermore, an interplanar distance of ∼0.33 nm was obtained (see left-top inset in Fig. 3) and is associated with the interplanar spacing of (110) planes.
exp(σ2/2), and the value was estimated at 4.1 ± 0.3 nm, which is slightly higher than that obtained by XRD suggesting a surface amorphous phase, which could be associated with Ce-ion surface segregation. Furthermore, an interplanar distance of ∼0.33 nm was obtained (see left-top inset in Fig. 3) and is associated with the interplanar spacing of (110) planes.
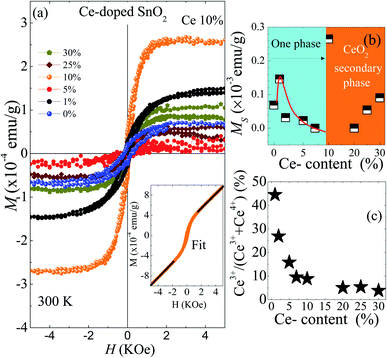
Fig. 4(a) displays the magnetization (M) as a function of magnetic field (H) at room temperature for undoped and Ce-doped SnO2 NPs, after the subtraction between the diamagnetic background signal (holder sample) and the paramagnetic susceptibility (obtained from the fit at high magnetic field values, as seen in the inset of Fig. 4(a)), the room temperature ferromagnetism (RTF) contribution was obtained. With respect to pure SnO2, an S-shape curve in the central evidence of a ferromagnetic contribution, with a magnetization saturation of MS ∼ 0.07 × 10⁻³ emu g−1, which is associated with the exchange coupling of the spins of electrons trapped in oxygen vacancies (F-center), mainly located on the particle surface, as was discussed in a previous publication.36 As can be seen, from Fig. 4(b), we have a substantial increase of the MS (∼129%) from ∼0.07 × 10⁻³ to ∼0.16 × 10⁻³ emu g−1, mapped from 0 to 1 mol% Ce content. A plausible source of the strengthening of the ferromagnetism, can be associated with the exchange interaction of cerium ions with non-zero magnetic moment (4f1) via the F-centers. The latter, are electrons trapped in oxygen vacancies, likewise, the strengthening of the ferromagnetism is linked to the amount of V0 which is in agreement with the PL results associated to V0 in the same samples.37 Furthermore, above the 1 mol% concentration the magnetic saturation shows a monotonic decrease of up to 10 mol%, which is associated with the reduction of the F-centers due to an enrichment of the surface segregation and the change of oxidized state from Ce3+ to Ce4+ after increasing the doping content. The latter is produced during the synthesis process, where the amount of Ce3+ (x) and Ce4+ (y) in the SnO2 host matrix, and Ce4+ (z) in the CeO2 secondary phase depends on the Ce content according to the following equation,
 | (3) |
However, the maximum value of the MS was obtained for 10% Ce content, which is interesting in itself. The origin of the room temperature ferromagnetism is still unclear, but surface defects seem to be crucial for its appearance due to small CeO2 NPs (which has been evidenced by Raman measurements) with a high concentration of oxygen vacancies (VO), which are the main type of defects in ceria NPs.38 The oxygen vacancies provoke the rise of Ce3+ ions to form Ce4+–VO–Ce3+ complexes. These ingredients could be the key for the RTF observed in this sample.39,40 On the other hand, from the paramagnetic susceptibility (χP = M/H) and using eqn (1), the concentration of Ce3+, x(Ce3+), was determined and is displayed in Fig. 4(c).
| μeff2x(Ce3+)NAμB = 3AkBTχP | (4) |
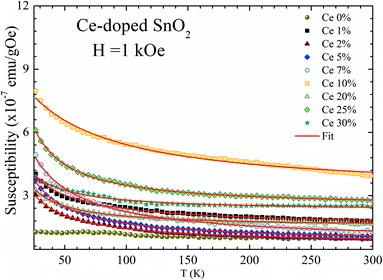 | ||
| Fig. 5 DC susceptibility (χDC) as a function of temperature (T) recorded at H = 1 kOe. Symbols represent experimental data, whereas solid lines show fitting using the Curie–Weiss law. | ||
| Ce (mol%) | C (emu K g−1 Oe−1) | θ cw | χ 0 (emu g−1 Oe−1) | μ eff |
|---|---|---|---|---|
| 1 | 9.8 × 10⁻⁶ | −15.35 | 15.2 × 10⁻⁸ | 1.09 |
| 2 | 8.3 × 10⁻⁶ | −9.93 | 6.9 × 10⁻⁸ | 0.71 |
| 5 | 9.8 × 10⁻⁶ | −7.64 | 7.7 × 10⁻⁸ | 0.49 |
| 7 | 16.6 × 10⁻⁶ | −15.26 | 8.0 × 10⁻⁸ | 0.54 |
| 10 | 34.7 × 10⁻⁶ | −50.48 | 31.2 × 10⁻⁸ | 0.65 |
| 20 | 5.5 × 10⁻⁶ | −5.07 | 15.1 × 10⁻⁸ | 0.18 |
| 25 | 11.1 × 10⁻⁶ | −4.31 | 24.3 × 10⁻⁸ | 0.24 |
| 30 | 5.7 × 10⁻⁶ | −7.83 | 22.6 × 10⁻⁸ | 0.16 |
The high negative values of θcw (see Table 2) suggest the occurrence of antiferromagnetic correlations among the Ce-ions dispersed in the SnO2 matrix. The effective magnetic moments (μeff) calculated from the Curie constant are in the range 0.71 to 0.65 μB (see Table 2). Due to the expected magnetic moment values for the Ce3+ (μeff = 2.54 μB) and Ce4+ (μeff = 0 μB) the low and decreasing tendency of the effective magnetic moment suggests a monotonic reduction of the Ce3+-ions as the cerium content increases.
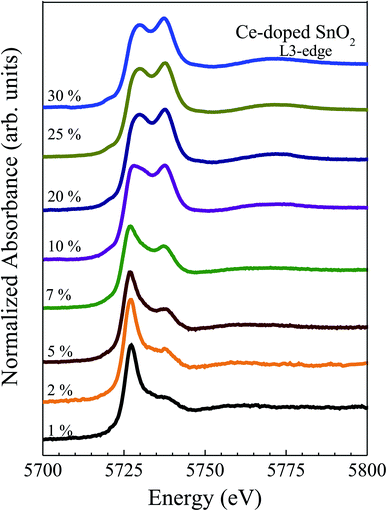
Fig. 6(a) shows the X-ray absorption near-edge spectra (XANES) at Ce L3-edge, for the Ce-doped SnO2 NPs. In order to study the valence state of the cerium ions all spectra were compared with the spectra obtained for the standard compounds Ce(C2H3O2)3·H2O and CeO2, for more details see the previous work.41
A visual inspection of the spectra’s shape suggests the coexistence of Ce3+ and Ce4+ in all Ce-doped samples, with a clear reduction in the amount of Ce3+-ions as the Ce content increases. However, via deconvolution of the recorded spectra, the quantitative Ce3+ population can be assessed, as already reported in the literature.42,43 In this regard, the spectra have been fitted using three peaks, one for the Ce3+-ions (located at 5727 eV) and two for the Ce4+-ions (located at 5731 eV and 5738 eV). A typical fitting of the XANES spectra for the 7 mol% cerium-doped SnO2 NPs is shown in Fig. 7(a).
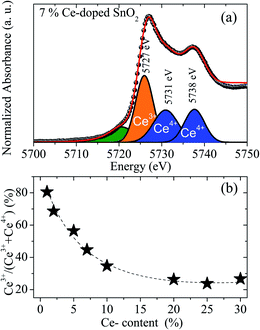 | ||
| Fig. 7 (a) Fit of the XANES spectrum of the 7 mol% cerium-doped SnO2 NPs using three components. (b) Percent of Ce3+-ions as function of the Ce content obtained from X-ray absorption. | ||
In Fig. 7(a), the green peak in the pre-edge region is related to the final states of 2p5d with delocalized d character at the bottom of the conduction band.42 The blue peaks located at 5731 and 5738 eV are associated with Ce4+ and correspond to 2p4f15d1 and 2p4f05d1 final states, respectively.43 The orange peak located at 5727 eV has its origin in the specific white-line spectra of Ce3+ ions and has been used in the estimation of their concentration.42,43
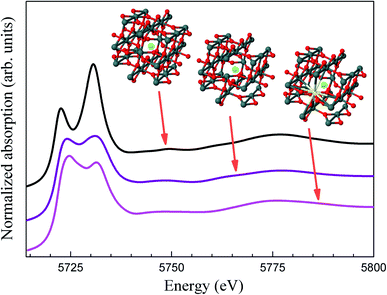
Estimation of the Ce3+-content for all doped samples has been obtained using the spectral area ratio of the peaks Ce3+/(Ce3+ + Ce4+). Our results show a higher concentration of Ce3+ for the 1 mol% (∼80%). This value is larger when compared to the value obtained from the magnetic measurements (∼45%). This fact could be closely linked to the occurrence of antiferromagnetic interactions, leading to antiparallel alignment ↑↓⋯↑↓ of neighboring Ce-ions. This antiparallel alignment drives an apparent reduction in the effective magnetic moment of the Ce-ions in the paramagnetic phase, leading to low concentration values of the Ce3+. Moreover, calculated XANES spectra for Ce-doped SnO2 at Ce L3-edge using ab initio FEFF code are also shown in Fig. 8. The input files for the FEFF code were initially generated using a crystallographic model according to the XRD measurements where Sn4+ ions are replaced by Ce4+ ions. The cluster used in this calculation radius presents a radius of 6.0 Å with 68 atoms around the absorber Ce atom, which is also shown in Fig. 8. According to this crystallographic model, Ce atoms in Sn sites are surrounded by 6 O atoms in the first shell and 2 Sn atoms in the second shell. As can be seen in this figure, the calculated XANES spectra with 6 O atoms in the first shell shows a higher intensity for the feature around 5733 eV, which is, as stated above, directly related to Ce4+ ions. The calculated XANES spectra with 4 O atoms in the first shell (2 O vacancies) and 2 Sn atoms in the second shell, and the calculated XANES spectra with 4 O atoms in the first shell (2 O vacancies) and 1 Ce and 1 Sn atom in the second shell, are also shown in Fig. 8. As can be seen in this figure, a decrease in the intensity for the feature around 5738 eV is observed.
Hence, for two O vacancies we have, in the former case, one Ce3+ ion whereas in the latter we have two Ce3+ ions. It means that each Ce atom must be coordinated with two O vacancies to give a Ce3+ ion as is shown in the DFT ab initio simulation. Further, the calculated XANES spectra reproduce satisfactorily the experimental spectra for concentrations lower than 10% Ce-doped samples. In other words, O vacancies are associated with the decreasing oxidation state from +4 to +3, demonstrating a majority of Ce3+ ions in these samples. Thus, the reduced tendency of the amount of Ce3+-ions as a function of Ce content is in agreement with magnetic and X-ray absorption measurements.
B. Ab initio investigation of the oxidation state of the dopant Ce ions
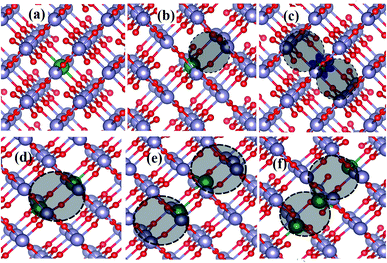
We performed ab initio simulations of Ce-doped SnO2 to provide an atomistic understanding of the ingredients that determine the oxidation state of the Ce-ions. In our calculations, we adopted a rutile-like SnO2 structure with a 3 × 3 × 3 supercell,44 containing 54 and 108 atoms of Sn and O, respectively, in its pristine form. Thus, we created a variety of point defects inside it. Our experiments indicated substitutional doping of Ce atoms at the Sn sites and the presence of oxygen vacancies. The investigated point defects, shown in Fig. 9, are taken into account from these experimental insights.Panel (a) shows a single Ce atom doped into the SnO2 at the Sn sites, namely 1CeSn. This simulation reveals the absence of a magnetic moment, indicating that all Ce valence electrons are shared in covalent bonds, characterizing the +4 oxidation state. Panel (b) depicts a point defect with a single oxygen vacancy surrounding a Ce-ion substituting a Sn site, namely, 1CeSn1VO. Again, the simulation results in the oxidation state +4 for the Ce ion. Thus, a single-vacancy neighboring the Ce-ion does not suffice to modify its oxidation state. However, after adding two neighboring oxygen vacancies to a Ce impurity (1Ce2VO), as depicted in Fig. 9(c), we found an unpaired localized valence electron in the Ce-ion, resulting in a magnetic moment characteristic of Ce3+. Thus, the addition of oxygen vacancies to Ce-doped SnO2 was shown to be a determining factor to tune the oxidation state of Ce-ions.
In our investigation, we also consider complexes comprised of two and three Ce substitutional impurities surrounded by one and two oxygen vacancies, as depicted in Fig. 9(d)–(f). The 2CeSn1VO complex (panel d) results in the oxidation state +4 for all ions. However, the 2CeSn2VO complex has all Ce ions in the oxidation state +3. Thus, for the complexes, our simulations also indicate the importance of oxygen vacancies for determining the Ce oxidation state. However, different to single Ce impurities, one oxygen vacancy per cerium atom results in Ce3+ ions. Finally, we show in panel (f) a complex with three Ce substitutional impurities and two vacancies. Here, the central Ce atoms present a +4 oxidation state, whereas the other ones are in the +3 oxidation state. This simulation indicates the possibility of Ce3+ and Ce4+ co-existing in the same complex. Table 3 presents these results more concisely.
| Structures | E f (eV) | OS | ME (meV) | SOM |
|---|---|---|---|---|
| 1CeSn | 7.237 | +4 | — | 0 |
| 1CeSn1VO | 1.651 | +4 | — | 0 |
| 1CeSn2VO | 2.095 | +3 | — | 1 |
| 2CeSn1VO | 1.268 | +4, +4 | — | 0 |
| 2CeSn2VO | 4.510 | +3, +3 | 1.67 | 2 |
| 3CeSn2VO | 1.918 | +3, +4, +3 | — | 2 |
Thus, our ab initio simulations demonstrate that the presence of oxygen vacancies is a determining factor for the oxidation state of the doped Ce impurity. In this sense, according to our calculations, in the absence (presence) of the oxygen vacancies the preferential oxidation state for cerium atoms is +4 (+3). Furthermore, it is worth noting that the possibility of Ce3+ and Ce4+ co-existing in the sample depends on the Ce/VO ratio, whereas an increased amount of oxygen vacancies favors the oxidation state Ce3+. Regarding the experimental result, when the Ce doping content is increased, the concentration of Ce3+-ions decreases. This drives the decrease of oxygen vacancies, reducing the presence of the neighboring oxygen vacancies around the cerium ions, in agreement with previous work, where they have shown that this occurs mainly on the particle shell.31,37
Here, we calculated the formation energy Ef with the following expression:45
| Ef = ED − EP + nSnμSn + nOμO − nCeμCe | (5) |
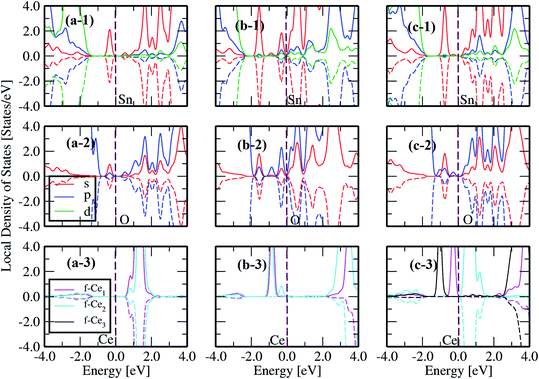
According to our results, the formation energies are in the following order: 1CeSn1VO (Ef = 1.65 eV) < 3CeSn2VO (Ef = 1.93 eV) < 1CeSn2VO (Ef = 2.09 eV) < 2CeSn2VO (Ef = 4.51 eV) < 1CeSn (Ef = 7.23 eV). The 1CeSn1VO is the lowest Ef, suggesting the most probable defect to occur in our experimental measurements. Also, Fig. 10 depicts the local density of states (LDOS) for 1Ce, 1Ce1VO, and 1Ce2VO, where we note that the effect of Ce impurities and surrounding oxygen vacancies, originates from the impurity electronic states between the conduction and the valence bands. In addition, the d-Sn has a stronger contribution at the valence band, and also, p-O and f-Ce. Another consequence to introduce oxygen vacancies in the system is the emergence of the s-Sn impurity states in O and Sn LDOS, which increases with the introduction of more O-vacancies, see the top and center panels of Fig. 10. As long as we are concerned with the Ce oxidation state, it is clear from panels (a-3), (b-3) and (c-3) that we need two oxygen vacancies to reduce the Ce oxidation from +4 to +3, in agreement with the equation:
| Sn24+Ce24+O82− + 2e− →Sn24+Ce23+O72−□V0 + O2−. | (6) |
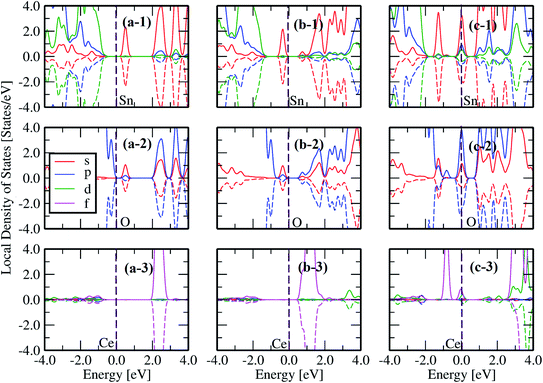 | ||
| Fig. 10 The local density of states (LDOS) for Sn (1), O (2) and Ce (3) for the respective structure displayed in each column: (a) 1CeSn, (b) 1CeSn1VO and (c) 1CeSn2VO. | ||
Eqn (6) suggests that the formation of the unstable Ce3+ requires two electrons for the reaction. This can be confirmed by the only fully occupied majority spin-up states without its minority counterpart Fig. 10(c-3), which is also accompanied by one peak of the corresponding p-O orbital just below of the Fermi energy Fig. 10(c-2). On the other configurations (Fig. 10(a and b)) Ce ions prefer to stay at valence +4 and the no polarized states signature is also exhibited by the corresponding p-O orbitals (cf.Fig. 10(a-2) and (b-2) with (a-3) and (b-3)).
Also, the increase of the cerium content was analyzed (2CeSn2VO and 3CeSn2VO). As displayed in Fig. 11, in the case of two Ce ions, both display the same oxidation state. Therefore, it shows that each Ce ion needs to be correlated, at least, with two oxygen vacancies to exhibit +3 valence, as a preferential state. Therefore, only Fig. 11(b-3) and (c-3), show two atoms with Ce-f orbitals full spin-up polarized. Furthermore, this last effect is accompanied by the p-O orbitals, as can be seen by cf.Fig. 11(b-2) and (c-2)with (b-3) and (c-3).
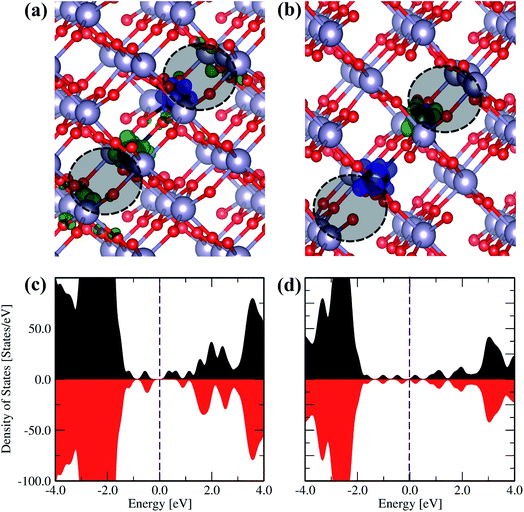
To elucidate the magnetic properties of the Ce-doped SnO2 systems, we study the local magnetic centers and spin-resolved charge densities for the lowest energy defect configuration to obtain the spin density polarization (SDP). In these calculations, we fix the initial magnetic moments for the ferromagnetic (FM) or antiferromagnetic (AFM) alignments. Fig. 12(a) and (b) show the SDP of the 2CeSn2VO defect. For the FM case, although the SDP nearby Ce1 becomes mainly negative (green-colored region) and the SDP of Ce2 is mainly positive (blue colored region). The negative SDP around the first vacancy (1CeSn1VO) overcomes the opposite positive SDP around the second vacancy (2CeSn2VO), favoring a net resultant polarization. Meanwhile, for the AFM configuration, the SDP nearby each cerium atom, and the oxygen atoms nearby each Ce impurity, display the same opposite spin polarization.
Moreover, the spin-resolved total density of states was plotted for both configurations (see Fig. 12(c) and (d)). A total energy difference between both magnetic configurations ΔEmag = EAFM − EFM = 1 meV. The small positive value suggests that FM is more favorable than the AFM state for this type of defect, as observed in the experimental part for Ce3+-ions, where the paramagnetic response is dominant.
IV. Conclusions
Undoped and cerium-doped (0 to 30 mol%) SnO2 NPs with high crystallinity have been successfully synthesized by a polymer precursor method. A mean crystallite size of 6 nm has been determined for the undoped SnO2 NPs, meanwhile, a small size of 2 nm was determined for the 30 mol% Ce-doped. Samples showing the formation of a single phase rutile-type structure have been obtained for doping amounts from 0 to 10 mol%, and the formation of a secondary CeO2 phase was determined for samples with cerium concentration above 10 mol%. Room-temperature ferromagnetism associated with oxygen vacancies in the single SnO2 sample was found. Meanwhile, for the cerium doped impurity, the FM is increased for the 1 mol% Ce doped sample, which was assigned to the long-range interaction of cerium ions with nonzero magnetic moment (4f1) mediated by the F-centers. On the other hand, we found a high MS of 0.27 × 10⁻³ emu g−1 in the 10 mol% of SnO2 NPs, this fact can be associated to ceria NPs. The coexistence of Ce3+ and Ce4+ has been corroborated from the Ce L3-edge XANES data analysis, with a decreasing tendency of the Ce3+/Ce4+ ratio as the Ce content increases. This fact is in good agreement with the magnetic measurement. The XANES was theoretically simulated via the FEFF code, our results show that the oxygen vacancies surrounding the cerium ions are the key to obtaining the +3 state in our samples as determined from the experimental part and corroborated by ab initio calculations. It was confirmed theoretically that for low concentrations of doping, the Ce atoms need to be correlated at least with two oxygen vacancies to exhibit the +3 state, as a preferential oxidation state, and after the Ce content in the host sample increases, the Ce4+ ions take over the Ce3+ ones, since after a critical doping level, Ce atoms can no longer coordinate with more oxygen vacancies. The presented results pave the way for tuning the magnetic properties of oxides through the control of the oxidation state of impurities.Conflicts of interest
There are no conflicts to declare.Acknowledgements
This work was financially supported by CONCYTEC – FONDECYT within the framework of the call E038-01 [contract No. 07-2019-FONDECYT-BM-INC. INV]. LVL thanks PNPD/CAPES for grant number 88887.319028/2019-00. L. Cabral thanks FAPESP (Fundação de Amparo à Pesquisa do Estado de São Paulo) for grant number 2018/20729-9. M. P. Lima thanks FAPESP (grant number 17/02317-2). AM thanks the FAPESP (grant number 2013/12993-4). JAHC want to thank the Brazilian agencies CNPq [grants number 301455/2017-1, 443652/2018-0] and FAPDF [grant number 00193.0000151/2019-20] for the financial support. The authors thank to the Brazilian Synchrotron Light Laboratory (LNLS) for the beamtime granted (proposal 20160072) to carry out the X-ray absorption measurements.References
- F. H. Aragón, J. A. H. Coaquira, P. Hidalgo, R. Cohen, L. C. C. M. Nagamine, S. W. da Silva, P. C. Morais and H. F. Brito, Experimental evidences of substitutional solution of Er dopant in Er-doped SnO2 nanoparticles, J. Nanopart. Res., 2012, 15(1), 1343 CrossRef.
- W. Prellier, A. Fouchet and B. Mercey, Oxide-diluted magnetic semiconductors: a review of the experimental status, J. Phys.: Condens. Matter, 2003, 15, 37 CrossRef.
- P. S. Basavarajappa, S. B. Patil, N. Ganganagappa, K. Raghava Reddy, A. V. Raghu and Ch. Venkata Reddy, Recent progress in metal-doped TiO2, non-metal doped/codoped TiO2 and TiO2 nanostructured hybrids for enhanced photocatalysis, Int. J. Hydrogen Energy, 2019 DOI:10.1016/j.ijhydene.2019.07.241.
- Z.-H. Ma, R.-T. Yu and Ji-M. Song, Facile synthesis of Pr-doped In2O3 nanoparticles and their high gas sensing performance for ethanol, Sens. Actuators, B, 2020, 305, 127377 CrossRef CAS.
- H. Peng, J. D. Perkins and L. Stephan, Multivalency of group 15 dopants in SnO2, Chem. Mater., 2014, 26(16), 4876–4881 CrossRef CAS.
- P. Mohanapriya, R. Pradeepkumar, N. V. Jaya and S. Natarajan, Magnetic and optical properties of electrospun hollow nanofibers of SnO2 doped with Ce-ion, Appl. Phys. Lett., 2014, 105, 022406 CrossRef.
- D. Liu, T. Liu, H. Zhang, C. Lv, W. Zeng and J. Zhang, Gas sensing mechanism and properties of Ce-doped SnO2sensors for volatile organic compounds, Mater. Sci. Semicond. Process., 2012, 15, 438–444 CrossRef CAS.
- T. Fukumura, Y. Yamada, H. Toyosaki, T. Hasegawa, H. Koinuma and M. Kawasaki, Exploration of oxide-based diluted magnetic semiconductors toward transparent spintronics, Appl. Surf. Sci., 2004, 223, 62–67 CrossRef CAS.
- T. Dietl, A ten-year perspective on dilute magnetic semiconductors and oxides, Nat. Mater., 2010, 9, 965 CrossRef CAS.
- S. Wu, C. Li, W. Wei, H. Wang, Y. Zhu and Y. Song, Synthesis and photocatalytic property of Ce-doped SnO2, J. Rare Earths, 2010, 28, 168–170 CrossRef.
- X. Lian, Y. Li, X. Tong, Y. Zou, X. Liu, D. An and Q. Wang, Synthesis of Ce-doped SnO2 nanoparticles and their acetone gas sensing properties, Appl. Surf. Sci., 2017, 407, 447–455 CrossRef CAS.
- M. Kumar, V. Bhatt, A. C. Abhyankar, J. Kim, A. Kumar, S. H. Patil and J. Yun, New insights towards strikingly improved room temperature ethanol sensing properties of p-type Ce-doped SnO2 sensors, Sci. Rep., 2018, 8, 8079 CrossRef.
- R. J. Watts, M. S. Wyeth, D. D. Finn and A. L. Teel, Optimization of Ti/SnO2–Sb2O5 anode preparation for electrochemical oxidation of organic contaminants in water and wastewater, J. Appl. Electrochem., 2008, 38, 31–37 CrossRef CAS.
- F. H. Aragón, J. A. H. Coaquira, P. Hidalgo, S. L. M. Brito, D. Gouvêa and R. H. R. Castro, Experimental study of the structural, microscopy and magnetic properties of ni-doped SnO2 nanoparticles, J. Non-Cryst. Solids, 2010, 356(52), 2960–2964 CrossRef . Crystallization in Glasses in Liquids (Crystallization 2009).
- V. Petříček, M. Dušek and L. Palatinus, Crystallographic computing system Jana2006: General features, Z. Kristallogr. - Cryst. Mater., 2014, 229(5) DOI:10.1515/zkri-2014-1737.
- S. J. A. Figueroa, J. C. Mauricio, J. Murari, D. B. Beniz, J. R. Piton, H. H. Slepicka, M. Falcão de Sousa, A. M. Espíndola and A. P. S. Levinsky, Upgrades to the XAFS2 beamline control system and to the endstation at the LNLS, J. Phys.: Conf. Ser., 2016, 712, 012022 CrossRef.
- B. Ravel and M. Newville, ATHENA, ARTEMIS, HEPHAESTUS: data analysis for X-ray absorption spectroscopy using IFEFFIT, J. Synchrotron Radiat., 2005, 12(4), 537–541 CrossRef CAS.
- P. Hohenberg and W. Kohn, Inhomogeneous electron gas, Phys. Rev., 1964, 136, B864–B871 CrossRef.
- W. Kohn and L. J. Sham, Self-consistent equations including exchange and correlation effects, Phys. Rev., 1965, 140, A1133–A1138 CrossRef.
- J. P. Perdew, K. Burke and M. Ernzerhof, Generalized gradient approximation made simple, Phys. Rev. Lett., 1996, 77, 3865–3868 CrossRef CAS.
- G. Kresse and J. Hafner, Ab initio molecular dynamics for open-shell transition metals, Phys. Rev. B: Condens. Matter Mater. Phys., 1993, 48, 13115–13118 CrossRef CAS.
- G. Kresse and J. Furthmüller, Efficient iterative schemes for ab initio total-energy calculations using a plane-wave basis set, Phys. Rev. B: Condens. Matter Mater. Phys., 1996, 54, 11169–11186 CrossRef CAS.
- P. E. Blöchl, Projector augmented-wave method, Phys. Rev. B: Condens. Matter Mater. Phys., 1994, 50, 17953–17979 CrossRef.
- G. Kresse and D. Joubert, From ultrasoft pseudopotentials to the projector augmented-wave method, Phys. Rev. B: Condens. Matter Mater. Phys., 1999, 59, 1758–1775 CrossRef CAS.
- S. L. Dudarev, G. A. Botton, S. Y. Savrasov, C. J. Humphreys and A. P. Sutton, Electron-energy-loss spectra and the structural stability of nickel oxide: An LSDA+U study, Phys. Rev. B: Condens. Matter Mater. Phys., 1998, 57, 1505–1509 CrossRef CAS.
- J. J. Rehr, J. J. Kas, F. D. Vila, M. P. Prange and J. Kevin, Parameter-free calculations of X-ray spectra with FEFF9, Phys. Chem. Chem. Phys., 2010, 12, 5503–5513 RSC.
- V. Petříček, M. Dušek and L. Palatinus, Crystallographic computing system Jana2006: General features, Z. Kristallogr. - Cryst. Mater., 2014, 229, 345 Search PubMed.
- M. A. Peche-Herrero, D. Maestre, J. Ramírez-Castellanos, A. Cremades, J. Piqueras and J. M. González-Calbet, The controlled transition-metal doping of SnO2 nanoparticles with tunable luminescence, CrystEngComm, 2014, 16, 2969–2976 RSC.
- R. D. Shannon, Revised effective ionic radii and systematic studies of interatomic distances in halides and chalcogenides, Acta Crystallogr., Sect. A: Cryst. Phys., Diffr., Theor. Gen. Crystallogr., 1976, 32(5), 751–767 CrossRef.
- R. H. R. de Castro, P. Hidalgo, J. A. H. Coaquira, J. Bettini, D. Zanchet and G. Douglas, Surface segregation in SnO2–Fe2O3 nanopowders and effects in mossbauer spectroscopy, Eur. J. Inorg. Chem., 2005, 11, 2134–2138 CrossRef.
- F. H. Aragón, I. Gonzalez, J. A. H. Coaquira, P. Hidalgo, H. F. Brito, J. D. Ardisson, W. A. A. Macedo and P. C. Morais, Structural and surface study of praseodymium-doped SnO2 nanoparticles prepared by the polymeric precursor method, Eur. J. Inorg. Chem., 2015, 119, 8711–8717 Search PubMed.
- L. Ran, D. Zhao, X. Gao and L. Yin, Highly crystalline Ti-doped SnO2 hollow structured photocatalyst with enhanced photocatalytic activity for degradation of organic dyes, CrystEngComm, 2015, 17, 4225–4237 RSC.
- F. H. Aragón, J. A. H. Coaquira, L. Villegas-Lelovsky, S. W. da Silva, D. F. Cesar, L. C. C. M. Nagamine, R. Cohen, E. Menéndez-Proupin and P. C. Morais, Evolution of the doping regimes in the al-doped SnO2 nanoparticles prepared by a polymer precursor method, J. Phys.: Condens. Matter, 2015, 27(9), 095301 CrossRef.
- R. H. R. Castro, P. Hidalgo, R. Muccillo and D. Gouvêa, Microstructure and structure of NiO–SnO2 and Fe2O3–SnO2 systems, Appl. Surf. Sci., 2003, 214(1), 172–177 CrossRef CAS.
- F. H. Aragón, P. E. N. de Souza, J. A. H. Coaquira, P. Hidalgo and D. Gouvêa, Spin-glass-like behavior of uncompensated surface spins in NiO nanoparticulated powder, Phys. B, 2012, 407(13), 2601–2605 CrossRef.
- F. H. Aragón, J. A. H. Coaquira, P. Hidalgo, S. L. M. Brito, D. Gouvêa and R. H. R. Castro, Structural and magnetic properties of pure and nickel doped SnO2 nanoparticles, J. Phys.: Condens. Matter, 2010, 22(49), 496003 CrossRef.
- D. G. Pacheco-Salazar, F. F. H. Aragón, L. Villegas-Lelovsky, G. E. Marques and J. A. H. Coaquira, Engineering of the band gap induced by cerium surface enrichment in SnO2 nanocrystals, Appl. Surf. Sci., 2020, 527, 146794 CrossRef CAS.
- P. Dutta, S. Pal, M. S. Seehra, Y. Shi, E. M. Eyring and R. D. Ernst, Concentration of Ce3+ and oxygen vacancies in cerium oxide nanoparticles, Chem. Mater., 2006, 18(21), 5144–5146 CrossRef CAS.
- A. Karl and J. M. D. Coey, Room temperature magnetism in CeO2—a review, Phys. Rep., 2018, 746, 1–39 CrossRef.
- S.-Y. Chen, Y.-H. Lu, T.-W. Huang, D.-C. Yan and C.-L. Dong, Oxygen vacancy dependent magnetism of CeO2 nanoparticles prepared by thermal decomposition method, J. Phys. Chem. C, 2010, 114(46), 19576–19581 CrossRef CAS.
- F. F. H. Aragón, J. C. R. Aquino, J. E. Ramos, J. A. H. Coaquira, I. Gonzalez, W. A. A. Macedo, S. W. da Silva and P. C. Morais, Fe-doping effects on the structural, vibrational, magnetic, and electronic properties of ceria nanoparticles, J. Appl. Phys., 2017, 122(20), 204302 CrossRef.
- S. Phokha, S. Pinitsoontorn and S. Maensiri, Structure and magnetic properties of monodisperse Fe3+-doped CeO2 nanospheres, Nano-Micro Lett., 2013, 5(4), 223–233 CrossRef CAS.
- V. Fernandes, I. L. Graff, J. Varalda, L. Amaral, P. Fichtner and D. Demaille, et al., Valence evaluation of cerium in nanocrystalline CeO2 films electrodeposited on Si substrates, J. Electrochem. Soc., 2011, 159, K27–K33 CrossRef.
- F. F. H. Aragón, L. Villegas-Lelovsky, L. Cabral, M. P. Lima, J. C. R. Aquino, M. C. Mathpal, J. A. H. Coaquira, S. W. da Silva, L. C. C. M. Nagamine, S. O. Parreiras, P. L. Gastelois, G. E. Marques and W. A. A. Macedo, Tailoring the physical and chemical properties of Sn1−xCoxO2 nanoparticles: an experimental and theoretical approach, Phys. Chem. Chem. Phys., 2020, 22, 3702–3714 RSC.
- M. P. Lima, L. Cabral, E. Margapoti, S. Mahapatra, J. L. F. Da Silva, F. Hartmann, S. Höfling, G. E. Marques and V. Lopez-Richard, Defect-induced magnetism in II-VI quantum dots, Phys. Rev. B, 2019, 99, 014424 CrossRef CAS.
Footnote |
| † These two authors contributed equally. |
| This journal is © The Royal Society of Chemistry 2021 |

