 Open Access Article
Creative Commons Attribution 3.0 Unported Licence
Chiroptical activity of Au13 clusters: experimental and theoretical understanding of the origin of helical charge movements†
Yukatsu
Shichibu
 *ab,
Yuri
Ogawa
a,
Mizuho
Sugiuchi
a and
Katsuaki
Konishi
 *ab
*ab
aGraduate School of Environmental Science, Hokkaido University, North 10 West 5, Sapporo 060-0810, Japan. E-mail: shichibu@ees.hokudai.ac.jp; konishi@ees.hokudai.ac.jp
bFaculty of Environmental Earth Science, Hokkaido University, North 10 West 5, Sapporo 060-0810, Japan
First published on 5th November 2020
Abstract
Ligand-protected gold clusters with an asymmetric nature have emerged as a novel class of chiral compounds, but the origins of their chiroptical activities associated with helical charge movements in electronic transitions remain unexplored. Herein, we perform experimental and theoretical studies on the structures and chiroptical properties of Au13 clusters protected by mono- and di-phosphine ligands. Based on the experimental reevaluation of diphosphine-ligated Au13 clusters, we show that these surface ligands slightly twist the Au13 cores from a true icosahedron to generate intrinsic chirality in the gold frameworks. Theoretical investigation of a monophosphine-ligated cluster model reproduced the experimentally observed circular dichroism (CD) spectrum, indicating that such a torsional twist of the Au13 core, rather than the surrounding chiral environment by helically arranged diphosphine ligands, contributes to the appearance of the chiroptical response. We also show that the calculated CD signals are dependent on the degree of asymmetry (torsion angle between the two equatorial Au5 pentagons), and provide a visual understanding of the origin of helical charge movements with transition-moment and transition-density analyses. This work provides novel insights into the chiroptical activities of ligand-protected metal clusters with intrinsically chiral cores.
Introduction
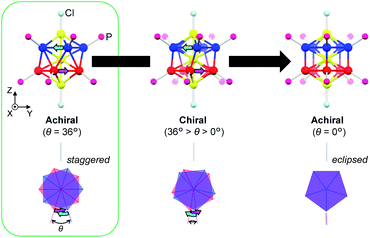
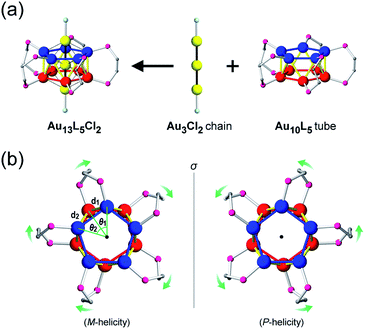
Among the various metal clusters reported to date, the geometric structures of gold clusters protected by thiolate1 and phosphine2 ligands have been well-defined through intensive X-ray crystallographic investigations, promoting experimental studies into chiral gold clusters.3 Structurally, the nature of a chiral gold cluster can be categorized as follows:4 (1) achiral gold cores inside chiral environments (category I), or (2) intrinsically chiral gold cores (category II). With respect to this categorization, various theoretical5 and numerical6 studies have aided the understanding of the origin of their unique chiroptical activities. However, the correlation between their structural details and chiroptical activities remains ambiguous due to the structural diversity and/or complexity of these clusters that mask the profound nature of the chiroptical responses (i.e., a helical movement of charge density in an electronic transition, hereinafter referred to as a helical charge movement).7In this paper, we focus on icosahedral Au13 clusters having ten phosphorus and two chloride atoms (i.e., the [Au13P10Cl2]3+-type clusters), and demonstrate the chiroptical responses depending on the transformation of the icosahedral Au13 core with variation in θ, the torsion angle between the two equatorial Au5 pentagons (Scheme 1). Since the first structural report on a PMe2Ph-ligated Au13 cluster, namely [Au13(PMe2Ph)10Cl2]3+, by Mingos et al.,8 the icosahedral Au13 framework, which is ubiquitously found in ligand-protected gold clusters,9 has attracted increasing interest as a symbolic core of metal clusters, while the monophosphine-ligated Au13 cluster itself is unstable. By using a C2-bridged diphosphine ligand (L) of achiral DPPE (1,2-bis(diphenylphosphino)ethane), we previously succeeded in the synthesis and structural determination of a [Au13L5Cl2]3+ cluster (1; L = DPPE),10 providing facile access to chemically stable Au13 clusters protected by various diphosphine ligands.11 Recently, the [Au13L5Cl2]3+ cluster protected by chiral DIPAMP (1,2-bis[(2-methoxyphenyl)phenylphosphino]ethane), a derivative of DPPE (2-R or 2-S; L = R,R- or S,S-DIPAMP), was also synthesized and structurally determined.12 The common framework of 1 and 2 can be viewed as a rotaxane-like motif, i.e., threading of a linear Au3Cl2 chain through a pentagonal antiprismatic Au10L5 tube (Fig. 1a). This tube contains two staggered Au5 rings, which are cross-linked by five diphosphine ligands exhibiting a helical arrangement. As shown in Fig. 1b, the tube can be presented in the P- or M-helicity, depending on the manner of the helical arrangements (i.e., right- and left-handed, respectively).
In terms of the Au13 cores, the Au13 core bearing an icosahedral (θ = 36°) or a bicapped pentagonal prismatic (θ = 0°) structure is achiral, while that with other values of θ (i.e., 36° > θ > 0°) is chiral (Scheme 1). With respect to the chirality of the [Au13L5Cl2]3+ cluster, Li et al. claimed that 1 should be chiral because of the helical arrangement of its achiral ligands (belonging to category I), although the enantiopure product of 1 was not obtained by chiral HPLC due to the rapid racemization.13 Thereafter, Zhan et al. reported that the enantiopair of 2 possessed chiral twisted Au13 cores induced by the helically arranged chiral ligands (belonging to category II).12 However, it was uncertain whether the helically arranged achiral ligands in 1 also induced such a torsional twist in the Au13 core. Moreover, if such achiral (1) and chiral (2) ligands both induce the intrinsic chirality to the Au13 cores, any correlation between the torsion of the Au13 framework and circular dichroism (CD) signals remains elusive, which limits a comprehensive understanding of their chiroptical origins, including the above-mentioned helical charge movements. Thus, to examine the effect of surface diphosphine ligands on the torsional twist of the Au13 cores, we herein report an experimental reevaluation of the [Au13L5Cl2]3+ clusters (1 and 2). Furthermore, we also report a theoretical investigation into a simplified model, i.e., the [Au13(PH3)10Cl2]3+ cluster, where the torsion angle θ was varied (Scheme 1) to evaluate the effect of the torsion angle on the CD signals. Based on a systematic approach using transition-moment and transition-density analyses, we theoretically demonstrate a torsion-angle-dependent chiroptical response and provide a visual understanding of the origin of helical charge movements in the Au13 cluster.
Results and discussion
Experimental structural reevaluation
Concerning the [Au13L5Cl2]3+ clusters (Fig. 1), torsion between the two staggered Au5 rings was reported only for the Cl salts of 2.12 Hence, we independently investigated the geometries of the PF6 salts of 1 and 2. Based on single-crystal X-ray structural analyses, it was apparent that 1 was obtained as a racemic compound,10 while 2-R and 2-S were obtained in their P- and M-helicities, respectively (Fig. S1 and S2†). The effect of the diphosphine ligands on the torsion of the Au13 cores was then revealed from a statistical analysis of the dihedral angles (θ1 and θ2) and the Au–Au distances (d1 and d2) of the Au10L5 tubes (Fig. 1b). For example, as was reported for 2,12 the dihedral angles relating to the cross-linked diphosphines (θ1) were narrower than the adjacent angles (θ2) (Fig. S3b and c†). The average angles of θ1 − 36 for 2-R and 2-S were −1.19 and −1.24°, respectively, which are ∼2° smaller than θ2 − 36 (Table 1). In addition, Au–Au distances related to the cross-linked diphosphines (d1) were shorter than the adjacent distances (d2) (Fig. S3b and c†), and the average distances of d1 for 2-R and 2-S were shorter by 0.053 and 0.055 Å than those of d2 (Table 1). These perfect periodic changes in the angles and distances for both enantiomers of 2 are reflected in the zigzag patterns that appear in Fig. 2 (red and blue lines). In the case of 1, such zigzag patterns were partially ambiguous (Fig. 2, black lines). In this regard, compared with 2, the differences in the average angles (θ2 − θ1) and distances (d2 − d1) became smaller, and the standard deviations of the angles and distances became larger (Table 1). In contrast, in the PMe2Ph-ligated Au13 cluster,8 which does not feature cross-linking between the two Au5 rings, such zigzag periodicities were disrupted (Fig. 2, light green lines), and their standard deviations were approximately doubled (Table 1). Therefore, these data clearly indicate that the helically arranged cross-linkage imparted by the C2-bridged diphosphine ligands induces a torsional twist between the two Au5 rings of the Au10L5 tubes by ∼1° from the ideal staggered angle (36°). In addition, the degree of torsion is higher in DIPAMP than in DPPE, which indicates the higher structural rigidity of 2.| θ 1 − 36 (°) | θ 2 − 36 (°) | d 1 (Å) | d 2 (Å) | |
|---|---|---|---|---|
| a The minimum and maximum values are given in square brackets. b Data for θ − 36 and d in Fig. S3d are presented, since there is no concept of such differences in angles (θ1 and θ2) and distances (d1 and d2) because of the lack of cross-linked diphosphine ligands. | ||||
| 1 | −1.03 ± 0.97 [−2.67, +0.20] | +1.03 ± 0.92 [−0.14, +2.37] | 2.863 ± 0.016 [2.848, 2.889] | 2.908 ± 0.017 [2.884, 2.929] |
| 2-R | −1.19 ± 0.70 [−2.52, −0.54] | +1.19 ± 0.51 [+0.24, +1.66] | 2.855 ± 0.010 [2.836, 2.867] | 2.908 ± 0.009 [2.893, 2.921] |
| 2-S | −1.24 ± 0.68 [−2.54, −0.59] | +1.24 ± 0.49 [+0.34, +1.68] | 2.852 ± 0.010 [2.833, 2.862] | 2.907 ± 0.008 [2.895, 2.919] |
| [Au13(PMe2Ph)10Cl2]3+b | 0.00 ± 1.60 [−2.37, +1.84] | 2.911 ± 0.024 [2.882, 2.944] | ||
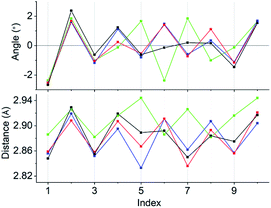 | ||
| Fig. 2 Line graphs of the angles (θ1 − 36 and θ2 − 36) and distances (d1 and d2) vs. the index numbers of 1 (black), 2-R (red), 2-S (blue), and [Au13(PMe2Ph)10Cl2]3+ (light green). Numbering of the indices is in accordance with Fig. S3.† Except for [Au13(PMe2Ph)10Cl2]3+, the “angles and distances” for the odd and even index numbers correspond to “θ1 − 36 and d1” and “θ2 − 36 and d2”, respectively. | ||
Experimental optical spectra
As shown in Fig. 3a, the absorption spectra of the PF6 salts of 1 and 2 were quite similar, exhibiting broad bands at ∼495 nm and intense bands at 360 nm. Previous theoretical studies into the absorption spectra of their Au13 clusters12,14 indicated that the broad bands at 495 nm were mainly attributed to Au(6sp) → Au(6sp) intraband transitions, while metal–metal transitions (e.g. Au(5d) → Au(6sp)) contributed to the band at 360 nm. This means that the contribution of the metal-based transitions within the Au13 cores to the near-UV-to-visible absorptions is large. In addition, the CD spectra of the 2-R and 2-S enantiomers showed perfect mirror images (Fig. 3b), whereby 2-R exhibited a positive first Cotton effect at 535 nm and negative Cotton effects at 485 and 398 nm. Previously, the experimentally obtained CD spectrum of the Cl salt of 2-R was theoretically well reproduced from the full structure of 2-R,12 and the calculated CD spectrum of the ligand-simplified structure of 1 was relatively similar to the experimental spectrum of 2-R.13 As these CD responses were connected to the metal-based transitions at approximately 400–600 nm, it is quite reasonable to assume that torsion between the two Au5 rings of the Au13 cores contributes to the chiroptical activities of the Au13 clusters, although we cannot ignore the effect of the surrounding chiral environments by the helically arranged achiral/chiral ligands on the CD responses.4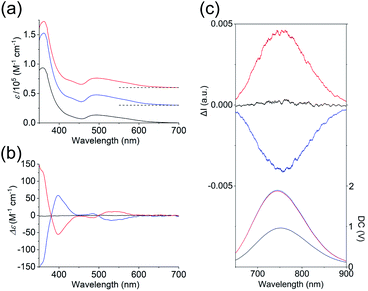 | ||
| Fig. 3 (a) Absorption, (b) CD, and (c) CPL (top) and PL (bottom) spectra (λex = 495 nm) of the PF6 salts of 1 (black), 2-R (red) and 2-S (blue) in acetonitrile. The CPL and PL spectra measured by using a CPL apparatus are uncorrected. Corrected PL spectra are given in Fig. S4.† Baselines of the absorption spectra are shown by dashed lines in (a). | ||
Several Au13 clusters, including 1, were reported to show relatively strong near-IR emissions,10,11,15 and we found that 2 also exhibited such an emission (Fig. S4†). In contrast to the emission peak of 1 at 818 nm, that of 2 at 792 nm was blue-shifted by 26 nm. In addition, the quantum yield of both enantiomers of 2 was 15%, which is 4% larger than that of 1.14 This can be attributed to the higher structural rigidity of 2 compared to 1, which can suppress nonradiative decay.16 Mirror images were also found in the circularly polarized luminescence (CPL) spectra of 2-R and 2-S (Fig. 3c), and the emission anisotropy factors at 760 nm (2.5 × 10⁻³ for 2-R and −2.3 × 10⁻³ for 2-S) were approximately one third of that of a chiral gold complex.17 It should also be noted here that the positive first Cotton effect at 535 nm (Fig. 3b, red line) and the positive CPL signal (Fig. 3c (top), red line) were both generated from 2-R, a Au13 cluster with P-helicity. The plus signs of these signals can be explained based on the exciton coupling theory18 and the excimer chirality rule19 for organic molecules with P-helicity. As these chiroptical spectroscopic techniques are sensitive to absolute structures, satisfaction of the above theory and rule may indicate a chiroptical analogy between organic molecules and gold clusters.
Theoretical optical spectra
The experimental and theoretical observations of the chiroptical signals from the Au13 clusters, which contain icosahedral Au13 cores twisted slightly by ∼1°, motivated us to investigate the correlation between the CD signals and the torsion angles of the two Au5 rings of the Au13 core. To focus on the effect of the torsion of the Au13 core, we performed theoretical calculations of a ligand-simplified cluster model, i.e., [Au13(PH3)10Cl2]3+, using various torsion angles (36° ≥ θ ≥ 0°; Scheme 1). The relative energy of the model at θ = 0° was more disfavored than that of the fully relaxed one (θ = 36°) by 1.32 eV, and the energy changes of the frontier orbitals at 36° ≥ θ ≥ 0° were small (Table S3†). The calculated absorption spectrum of the model at θ = 36° showed two bands at 520 and 462 nm, and the band at 520 nm was weakened upon decreasing the angle (Fig. S5†). In the calculated CD spectra, the Au13 clusters exhibiting staggered (θ = 36°) and eclipsed (θ = 0°) conformations of the two Au5 rings are silent, while the Au13 clusters with other values of θ present positive bisignate signals in the near-UV-to-visible region, where metal-based transitions mainly occur (Fig. 4a). This can be explained based on the symmetry of the Au13P10Cl2 framework (Scheme 1). More specifically, at 36° > θ > 0°, the Au13 cluster has D5 symmetry, which is chiral because of the lack of reflection (S1) and inversion (S2) symmetries.7 In contrast, the Au13 cluster bearing an icosahedral (θ = 36°) or a bicapped pentagonal prismatic (θ = 0°) structure exhibits higher D5d or D5h symmetries, respectively, which is achiral because of the presence of the Sn axis along the axial z-axis (n = 2 for θ = 36°, n = 1 for θ = 0°). As the value of θ decreases, a blue shift of the positive Cotton effect at ∼520 nm and a red shift of the negative Cotton effect at ∼410 nm were observed (Fig. 4a). In addition, the intensities of the positive and negative peaks, which exhibit gradual θ-dependent changes, reached their maximum and minimum values at θ = 18°, respectively. Interestingly, the theoretical CD spectrum of the Au13 model at θ = 35° (Fig. 4a, black dotted line) was similar to the experimental one of 2-R (Fig. 3b, red line) in terms of the peak shape and wavelength. In contrast, the intensity of the first Cotton effect at 522 nm of the model (θ = 35°) was +0.93 × 10−40 esu2 cm2 (Fig. 4a, black dotted line), which was approximately 1/350th of the theoretical intensity of that of 2-R.12 Such an enhancement effect on CD responses was theoretically demonstrated for several diphosphine-ligated gold clusters, where the chiral arrangement and/or nature of the ligands induced strong dissymmetric fields.5l,m Therefore, these results clearly show that the torsion between the two Au5 rings of the icosahedral Au13 cores affects the CD responses of the Au13 clusters, and the helically arranged diphosphine ligands around the Au13 cores contribute to the significant enhancement of the responses.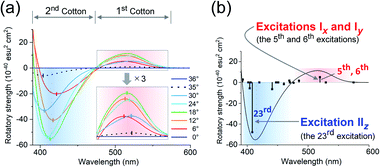 | ||
| Fig. 4 Calculated CD spectra of [Au13(PH3)10Cl2]3+ (a) upon variation in θ from 36° to 0°, and (b) at θ = 18°. Zones of the first and second Cotton effects are shaded in red and blue. | ||
Transition-moment analysis
A key factor in determining chiroptical properties is the transition dipole moments. As shown in Fig. 5a, a helical charge movement in an electron transition requires a simultaneous charge translation and charge rotation, each of which induces electric and magnetic transition dipole moments (i.e., μ and m).7 Here, the term “charge” refers to the electron charge. From these two moments, the rotatory strength (R), which governs the CD intensity, is formulated using the following equation:R = |μ||m|cos![[thin space (1/6-em)]](https://www.rsc.org/images/entities/char_2009.gif) α α | (1) |
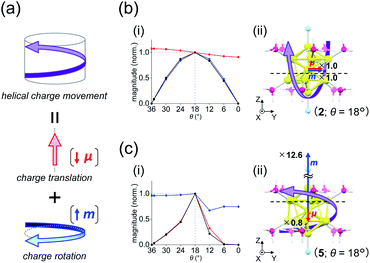 | ||
| Fig. 5 (a) Components of a helical charge movement. (i) Normalized magnitudes of the rotatory strength (black), electric transition dipole moment (red), and magnetic transition dipole moment (blue) at 36° ≥ θ ≥ 0°, and (ii) the electric (red) and magnetic (blue) transition dipole moments at θ = 18° for (b) excitation Iy and (c) excitation IIz of [Au13(PH3)10Cl2]3+. In parts b(ii) and c(ii), schematic representations of the helical charge movements are shown as helical purple arrows, the magnitudes of the moments relative to those for excitation Iy are given near the respective arrow tips, and dashed lines indicate the positions of the xy-cutplanes given in Fig. 6. | ||
For the 6th excitation (hereafter excitation Iy), |R| and |m| exhibited distinct parabolic relationships with θ, while |μ| was less dependent on θ (Fig. 5b(i)). As μ and m were oriented along the y-axis in parallel (i.e., cos![[thin space (1/6-em)]](https://www.rsc.org/images/entities/char_2009.gif) α ≈ 1) at 36° > θ > 0° (Fig. 5b(ii)), the θ-dependence of |R| was strongly coupled with the behavior of |m|, as indicated in eqn (1). Essentially the same features were observed along the x-axis (Fig. S8†) for the 5th excitation (hereafter excitation Ix), i.e., the other primary excitation responsible for the positive Cotton effect at θ = 18° (Fig. 4b). For the 23rd excitation, the primary excitation for the negative Cotton effect at θ = 18° (Fig. 4b), two types of excitations with z-axis-oriented transition moments (excitation IIz at θ ≥ 18° and excitation
α ≈ 1) at 36° > θ > 0° (Fig. 5b(ii)), the θ-dependence of |R| was strongly coupled with the behavior of |m|, as indicated in eqn (1). Essentially the same features were observed along the x-axis (Fig. S8†) for the 5th excitation (hereafter excitation Ix), i.e., the other primary excitation responsible for the positive Cotton effect at θ = 18° (Fig. 4b). For the 23rd excitation, the primary excitation for the negative Cotton effect at θ = 18° (Fig. 4b), two types of excitations with z-axis-oriented transition moments (excitation IIz at θ ≥ 18° and excitation  at θ < 18°) were found from shape similarities of their transition densities (details are given in the subsequent section) and systematic shifts of their transition wavelengths. As shown in Fig. S9† (blue and orange lines), the transition wavelengths of excitations IIz and
  showed blue and red shifts with decreasing θ, respectively, and overlap of the two excitations was observed at θ = ∼18°. A red shift of the negative Cotton effect with decreasing θ (Fig. 4a) can be attributed to such a complicated contribution of the two excitations. In contrast, a blue shift of the positive Cotton effect with decreasing values of θ (Fig. 4a) corresponds to the decrease in the transition wavelengths of excitations Ix and Iy with decreasing θ (Tables S6 and S7†). Excitation IIz, including the 23rd excitation at θ ≥ 18°, exhibited volcano-type relationships for |R| and |μ| with variation in θ (Fig. 5c(i)). Here, the θ-dependence of |R| was closely coupled to the behavior of |μ|, from eqn (1), because μ and m for excitation IIz were parallelly oriented at 18° > θ > 0° (i.e., cos
![[thin space (1/6-em)]](https://www.rsc.org/images/entities/char_2009.gif) α ≈ 1) and antiparallelly oriented at 36° > θ ≥ 18° (i.e., cos
α ≈ 1) and antiparallelly oriented at 36° > θ ≥ 18° (i.e., cos![[thin space (1/6-em)]](https://www.rsc.org/images/entities/char_2009.gif) α ≈ −1) along the z-axis (Fig. 5c(ii)).
α ≈ −1) along the z-axis (Fig. 5c(ii)).
Table 2 shows excitation data at three representative values of θ for excitations Iy and IIz (entries 1–6). Entries 1–3 and 4–6 exhibited larger values of |μ| and |m| than their respective counterparts (i.e., entries 4–6 and 1–3). At θ = 18°, the magnitudes of μ and m for excitation IIz (i.e., entry 5) are 0.8 times smaller and 12.6 times larger than those for excitation Iy (i.e., entry 2), respectively (Fig. 5b(ii) and c(ii), red and blue arrows). This significant difference in m leads to a large negative value of R in entry 5 (−47.87 × 10−40 esu2 cm2), the absolute value of which was more than nine times larger than that in entry 2 (5.095 × 10−40 esu2 cm2). Therefore, these data clearly indicate that the nature of the helical charge movements for excitations Iy and IIz at 36° > θ > 0°, representatively shown at θ = 18° as helical purple arrows in Fig. 5b(ii) and c(ii), is completely different.
| Entry | θ (°) | λ (nm) | R (10−40 esu2 cm2) | |μ| (D) | |m| (μB) |
|---|---|---|---|---|---|
| Excitation I y | |||||
| 1 | 36 | 524 | 0.000 | 1.552 | 0.000 |
| 2 | 18 | 519 | 5.095 | 1.444 | 0.038 |
| 3 | 0 | 515 | 0.000 | 1.313 | 0.000 |
![[thin space (1/6-em)]](https://www.rsc.org/images/entities/char_2009.gif) |
|||||
| Excitation II z | |||||
| 4 | 36 | 413 | 0.000 | 0.000 | 0.459 |
| 5 | 18 | 408 | −47.87 | 1.082 | 0.477 |
| 6 | 0 | 402 | 0.000 | 0.000 | 0.356 |
Transition-density analysis
To obtain further insights into the origin of the helical charge movements for excitations Iy and IIz, we investigated the generation factors of their charge translations and charge rotations (or μ and m) using transition-density analysis. Fig. 6a shows xy-cutplane views of the three transition densities for excitation Iy. At all angles (entries 1–3), wide red-colored (left side) and blue-colored (right side) areas were observed, which were also found in their overall views (Fig. S10a†). Thus, the charge translations from the blue to red areas, which are indicated by the (−y)-directed pink arrows in Fig. 6a, are the primary contributors to the (+y)-directed μ (Fig. 5b(ii)), and the reduced θ-dependence of |μ| for excitation Iy (Fig. 5b(i), red line) can be explained from the simultaneous observation of such similarly shaped areas in entries 1–3. The strong θ-dependence of |m| (Fig. 5b(i), blue line), on the other hand, appears to be related to the degree of asymmetry, which arises from the conformation of the two Au5 pentagons (Scheme 1). Specifically, the transition densities at θ = 36 and 0° have a symmetric yz-plane and an antisymmetric xz-plane containing the centred Au atoms, respectively (Fig. 6a, dotted lines). For these cases, the charge translation occurs only along the y-axis; hence, |m| reaches zero. However, at 36° > θ > 0°, the Au13 cluster model loses such symmetric planes, and the degree of asymmetry is expected to increase to its maximum at θ = 18°. These results indicate that the helical charge movement for excitation Iy at 36° > θ > 0° along the y-axis (e.g.Fig. 5b(ii)) was triggered by deformation of the “highly symmetric” y-axis-oriented charge translation (θ = 36° or 0°), which induces the charge rotation around the y-axis. Again, the same is essentially true along the x-axis for excitation Ix (Fig. S11†).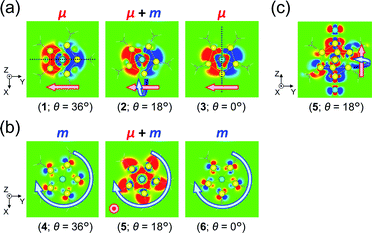 | ||
| Fig. 6 xy-Cutplane views of the transition densities for (a) excitation Iy and (b) excitation IIz of [Au13(PH3)10Cl2]3+ at three representative θ values (within ±0.00015 a.u. range). The red-colored and blue-colored areas represent electron increase and decrease during the electron excitations, respectively. Dotted black lines in part (a) represent the positions of a symmetric yz-plane (θ = 36°) and an antisymmetric xz-plane (θ = 0°). The positions of the xy-cutplanes in parts (a) (z = −0.25) and (b) (z = +1.0) are provided as dashed lines in Fig. 5b(ii) and c(ii), respectively. (c) yz-Cutplane view (x = 0.0) of entry 5. Pink and aqua arrows schematically indicate charge translations and rotations, respectively. | ||
For excitation IIz, the xy-cutplane views of the transition densities at θ = 36° and 0° (entries 4 and 6) are quite similar to one another, whereas that at θ = 18° (entry 5) is clearly different (Fig. 6b). In contrast, entries 4–6 all showed significantly larger |m| values (0.356–0.477 μB), i.e., by one order of magnitude, compared to entry 2 (0.038 μB; Table 2). In the cases of entries 4 and 6, the charge rotations around the z-axis (Fig. 6b, aqua arrows), which arises from the circular patterns of the four-clover-leaf-like lobes on the Au5 rings (Fig. 6b and S10b,† left and right), are the primary contributors to the strong and (+z)-directed m (Fig. 5c(ii)). In entry 5, it is reasonable to assume that the charge rotation is essentially identical to those in entries 4 and 6, and the clear difference in transition density (Fig. 6b, middle) results from a mixture of excitations IIz and  because of their above-mentioned overlap at θ = ∼18° (Fig. S9†). This assumption is supported by the observation that the transition densities of entry 5 for excitation IIz (Fig. 6b and S10b,† middle; Fig. 6c) and entries 4′–6′ for excitation
  (Fig. S12†) are similar to one another, all exhibiting wide red- and blue-colored areas in the ±z regions leading to the generation of μ along the z-axis (Fig. 6c and S12b†). Therefore, the helical charge movement for excitation IIz at 36° > θ > 0° along the z-axis (e.g.Fig. 5c(ii)) is generated by the combination of the strong charge rotation around the z-axis originating in the Au5 rings and the z-axis-oriented charge translation, the latter of which mainly comes from the other excitation (i.e., excitation
  ).
).
Finally, it should be noted that these theoretical analyses reveal the unique origin of m in the Au13 cluster, whereby the circularly arranged gold atoms around the cluster axis can generate a remarkably strong charge rotation around the axis in electronic transitions, which is significantly more effective than the charge rotation induced by the deformation of the highly symmetric gold core. With respect to understanding the structural origins of the chiroptical activities of gold clusters, previous theoretical and numerical studies have generally focused on the “asymmetric arrangement” of the gold atoms and/or the surrounding chiral environments.5,6 In contrast, our systematic theoretical approach based on the simple Au13 cluster model highlights the importance of the “circular arrangement” of gold atoms, and so could lead to a boost in chiroptical studies into metal clusters.
Conclusions
We compared the geometric structures and chiroptical properties of achiral/chiral diphosphine-ligated Au13 clusters and revealed that cross-linking through diphosphine ligands induced small torsional twists between the two equatorial Au5 rings of the Au13 cores, contributing to their chiroptical properties. Furthermore, we systematically investigated the effect of torsion between the two equatorial Au5 rings of the Au13 cores on their chiroptical activities using theoretical calculations for a simplified Au13 cluster model. The enhancement of the chiroptical signals in the calculated circular dichroism spectra was observed in response to the degree of asymmetry of the Au13 model. In addition, transition-moment and transition-density analyses revealed the profound origin of the helical charge movements, and the unique origin of the strong charge rotation arising from the equatorial Au5 rings was demonstrated. Our results indicate that not only the conventional asymmetric arrangement but also the circular arrangement of the metal atoms can influence the chiroptical activities of ligand-protected metal clusters bearing intrinsically chiral metal cores. The results of our study will be expected to provide valuable tools for understanding the geometric and electronic origins of the chiroptical activities of metal clusters. Recently, not just icosahedral Au13 cores but also metal counterparts of the Au13 core (i.e., M13 cores) have been highlighted as building blocks of ligand-protected metal clusters.20 Since these icosahedral M13 cores, with two stacking M5 rings, possess ideal topologies for generating strong charge rotations, the exploration of novel chiroptical metal clusters based on ubiquitous M13-based cores is worthy of further investigation.Conflicts of interest
There are no conflicts to declare.Acknowledgements
This work was partly supported by JSPS KAKENHI Grant Numbers JP17H05345 (Coordination Asymmetry), JP19H02532 and JP18H01987, and the Photoexcitonix Project at Hokkaido University. We thank Dr Jiawei Xu and Mr Toshifumi Uchiyama of JASCO for CPL and PL measurements, respectively.References
- R. Jin, C. Zeng, M. Zhou and Y. Chen, Chem. Rev., 2016, 116, 10346–10413 CrossRef CAS.
- K. Konishi, M. Iwasaki and Y. Shichibu, Acc. Chem. Res., 2018, 51, 3125–3133 CrossRef CAS.
- (a) T. G. Schaaff, G. Knight, M. N. Shafigullin, R. F. Borkman and R. L. Whetten, J. Phys. Chem. B, 1998, 102, 10643–10646 CrossRef CAS; (b) H. Yao, K. Miki, N. Nishida, A. Sasaki and K. Kimura, J. Am. Chem. Soc., 2005, 127, 15536–15543 CrossRef CAS; (c) Y. Yanagimoto, Y. Negishi, H. Fujihara and T. Tsukuda, J. Phys. Chem. B, 2006, 110, 11611–11614 CrossRef CAS; (d) S. Si, C. Gautier, J. Boudon, R. Taras, S. Gladiali and T. Bürgi, J. Phys. Chem. C, 2009, 113, 12966–12969 CrossRef CAS; (e) I. Dolamic, S. Knoppe, A. Dass and T. Bürgi, Nat. Commun., 2012, 3, 798 CrossRef; (f) S. Knoppe, A. Dass and T. Bürgi, Nanoscale, 2012, 4, 4211–4216 RSC; (g) S. Knoppe, I. Dolamic and T. Bürgi, J. Am. Chem. Soc., 2012, 134, 13114–13120 CrossRef CAS; (h) C. Zeng, T. Li, A. Das, N. L. Rosi and R. Jin, J. Am. Chem. Soc., 2013, 135, 10011–10013 CrossRef CAS; (i) S. Knoppe, O. A. Wong, S. Malola, H. Häkkinen, T. Bürgi, T. Verbiest and C. J. Ackerson, J. Am. Chem. Soc., 2014, 136, 4129–4132 CrossRef CAS; (j) M. Sugiuchi, Y. Shichibu and K. Konishi, Angew. Chem., Int. Ed., 2018, 57, 7855–7859 CrossRef CAS; (k) Y. Zhu, H. Wang, K. Wan, J. Guo, C. He, Y. Yu, L. Zhao, Y. Zhang, J. Lv, L. Shi, R. Jin, X. Zhang, X. Shi and Z. Tang, Angew. Chem., Int. Ed., 2018, 57, 9059–9063 CrossRef CAS; (l) L. Riccardi, F. De Biasi, M. De Vivo, T. Bürgi, F. Rastrelli and G. Salassa, ACS Nano, 2019, 13, 7127–7134 CrossRef CAS; (m) J. Q. Wang, Z. J. Guan, W. D. Liu, Y. Yang and Q. M. Wang, J. Am. Chem. Soc., 2019, 141, 2384–2390 CrossRef CAS; (n) A. Baghdasaryan, K. Martin, L. M. Lawson Daku, M. Mastropasqua Talamo, N. Avarvari and T. Bürgi, Nanoscale, 2020, 12, 18160–18170 RSC.
- C. Zeng and R. Jin, Chem.–Asian J., 2017, 12, 1839–1850 CrossRef CAS.
- (a) I. L. Garzón, M. R. Beltrán, G. González, I. Gutierrez-González, K. Michaelian, J. A. Reyes-Nava and J. I. Rodriguez-Hernández, Eur. Phys. J. D, 2003, 24, 105–109 CrossRef; (b) M. R. Goldsmith, C. B. George, G. Zuber, R. Naaman, D. H. Waldeck, P. Wipf and D. N. Beratan, Phys. Chem. Chem. Phys., 2006, 8, 63–67 RSC; (c) A. Sánchez-Castillo, C. Noguez and I. L. Garzón, J. Am. Chem. Soc., 2010, 132, 1504–1505 CrossRef; (d) O. Lopez-Acevedo, H. Tsunoyama, T. Tsukuda, H. Häkkinen and C. M. Aikens, J. Am. Chem. Soc., 2010, 132, 8210–8218 CrossRef CAS; (e) M. R. Provorse and C. M. Aikens, J. Am. Chem. Soc., 2010, 132, 1302–1310 CrossRef CAS; (f) C. Noguez, A. Sánchez-Castillo and F. Hidalgo, J. Phys. Chem. Lett., 2011, 2, 1038–1044 CrossRef CAS; (g) S. Malola, L. Lehtovaara, S. Knoppe, K. J. Hu, R. E. Palmer, T. Bürgi and H. Häkkinen, J. Am. Chem. Soc., 2012, 134, 19560–19563 CrossRef CAS; (h) B. Molina, A. Sánchez-Castillo, S. Knoppe, I. L. Garzón, T. Bürgi and A. Tlahuice-Flores, Nanoscale, 2013, 5, 10956–10962 RSC; (i) D. Crasto, S. Malola, G. Brosofsky, A. Dass and H. Häkkinen, J. Am. Chem. Soc., 2014, 136, 5000–5005 CrossRef CAS; (j) S. Knoppe, L. Lehtovaara and H. Häkkinen, J. Phys. Chem. A, 2014, 118, 4214–4221 CrossRef CAS; (k) A. Tlahuice-Flores, Phys. Chem. Chem. Phys., 2016, 18, 27738–27744 RSC; (l) N. V. Karimova and C. M. Aikens, J. Phys. Chem. C, 2018, 122, 11051–11065 CrossRef CAS; (m) H. Yao, S. Tsubota and R. Nobukawa, J. Phys. Chem. C, 2018, 122, 1299–1308 CrossRef CAS; (n) S. Malola and H. Häkkinen, J. Am. Chem. Soc., 2019, 141, 6006–6012 CrossRef CAS; (o) A. Muñoz-Castro, Inorg. Chem. Front., 2019, 6, 2349–2358 RSC.
- (a) I. L. Garzón, J. A. Reyes-Nava, J. I. Rodríguez-Hernández, I. Sigal, M. R. Beltrán and K. Michaelian, Phys. Rev. B: Condens. Matter Mater. Phys., 2002, 66, 073403 CrossRef; (b) J. J. Pelayo, R. L. Whetten and I. L. Garzón, J. Phys. Chem. C, 2015, 119, 28666–28678 CrossRef CAS; (c) S. Takano and T. Tsukuda, J. Phys. Chem. Lett., 2016, 7, 4509–4513 CrossRef CAS; (d) Y. Sato, M. Mitani and H. Yao, Phys. Chem. Chem. Phys., 2019, 21, 14984–14991 RSC.
- S. F. A. Kettle, Symmetry and Structure: Readable Group Theory for Chemists, John Wiley & Sons Inc., The Atrium, Southern Gate, Chichester, West Sussex PO19 8SQ, England, 3rd edn, 2007 Search PubMed.
- C. E. Briant, B. R. C. Theobald, J. W. White, L. K. Bell and D. M. P. Mingos, J. Chem. Soc., Chem. Commun., 1981, 201–202 RSC.
- (a) Y. Shichibu, Y. Negishi, T. Watanabe, N. K. Chaki, H. Kawaguchi and T. Tsukuda, J. Phys. Chem. C, 2007, 111, 7845–7847 CrossRef CAS; (b) M. W. Heaven, A. Dass, P. S. White, K. M. Holt and R. W. Murray, J. Am. Chem. Soc., 2008, 130, 3754–3755 CrossRef CAS; (c) H. Qian, W. T. Eckenhoff, Y. Zhu, T. Pintauer and R. Jin, J. Am. Chem. Soc., 2010, 132, 8280–8281 CrossRef CAS; (d) X. K. Wan, S. F. Yuan, Z. W. Lin and Q. M. Wang, Angew. Chem., Int. Ed., 2014, 53, 2923–2926 CrossRef CAS; (e) X. K. Wan, Q. Tang, S. F. Yuan, D. E. Jiang and Q. M. Wang, J. Am. Chem. Soc., 2015, 137, 652–655 CrossRef CAS; (f) Y. Song, F. Fu, J. Zhang, J. Chai, X. Kang, P. Li, S. Li, H. Zhou and M. Zhu, Angew. Chem., Int. Ed., 2015, 54, 8430–8434 CrossRef CAS; (g) Y. Chen, C. Zeng, C. Liu, K. Kirschbaum, C. Gayathri, R. R. Gil, N. L. Rosi and R. Jin, J. Am. Chem. Soc., 2015, 137, 10076–10079 CrossRef CAS; (h) C. Zeng, Y. Chen, K. Kirschbaum, K. Appavoo, M. Y. Sfeir and R. Jin, Sci. Adv., 2015, 1, e1500045 CrossRef.
- Y. Shichibu and K. Konishi, Small, 2010, 6, 1216–1220 CrossRef CAS.
- Y. Shichibu, K. Suzuki and K. Konishi, Nanoscale, 2012, 4, 4125–4129 RSC.
- Y. Yang, Q. Zhang, Z. J. Guan, Z. A. Nan, J. Q. Wang, T. Jia and W. W. Zhan, Inorg. Chem., 2019, 58, 3670–3675 CrossRef CAS.
- J. Zhang, Y. Zhou, K. Zheng, H. Abroshan, D. R. Kauffman, J. Sun and G. Li, Nano Res., 2018, 11, 5787–5798 CrossRef CAS.
- M. Sugiuchi, Y. Shichibu, T. Nakanishi, Y. Hasegawa and K. Konishi, Chem. Commun., 2015, 51, 13519–13522 RSC.
- (a) M. R. Narouz, S. Takano, P. A. Lummis, T. I. Levchenko, A. Nazemi, S. Kaappa, S. Malola, G. Yousefalizadeh, L. A. Calhoun, K. G. Stamplecoskie, H. Häkkinen, T. Tsukuda and C. M. Crudden, J. Am. Chem. Soc., 2019, 141, 14997–15002 CrossRef CAS; (b) Z.-H. Gao, J. Dong, Q.-F. Zhang and L.-S. Wang, Nanoscale Adv., 2020, 2, 4902–4907 RSC.
- J. Mei, N. L. Leung, R. T. Kwok, J. W. Lam and B. Z. Tang, Chem. Rev., 2015, 115, 11718–11940 CrossRef CAS.
- L. Shi, L. Zhu, J. Guo, L. Zhang, Y. Shi, Y. Zhang, K. Hou, Y. Zheng, Y. Zhu, J. Lv, S. Liu and Z. Tang, Angew. Chem., Int. Ed., 2017, 56, 15397–15401 CrossRef CAS.
- N. Harada and K. Nakanishi, Acc. Chem. Res., 1972, 5, 257–263 CrossRef CAS.
- K. Takaishi, K. Iwachido, R. Takehana, M. Uchiyama and T. Ema, J. Am. Chem. Soc., 2019, 141, 6185–6190 CrossRef CAS.
- S. Jin, S. Wang and M. Zhu, Chem.–Asian J., 2019, 14, 3222–3231 CrossRef CAS.
Footnote |
| † Electronic supplementary information (ESI) available: Experimental and computational data. CCDC 2032118 and 2032119. For ESI and crystallographic data in CIF or other electronic format see DOI: 10.1039/d0na00833h |
| This journal is © The Royal Society of Chemistry 2021 |

