 Open Access Article
Direct Z-scheme α-MnO2@MnIn2S4 hierarchical photocatalysts with atomically defined junctions for improved photocatalytic activities†
Min
Zhang
,
Muhammad
Arif
 ,
Yuxiang
Hua
,
Bo
Qiu
,
Yue
Mao
and
Xiaoheng
Liu
,
Yuxiang
Hua
,
Bo
Qiu
,
Yue
Mao
and
Xiaoheng
Liu
 *
*
Key Laboratory of Education Ministry for Soft Chemistry and Functional Materials, Nanjing University of Science and Technology, Nanjing 210094, Jiangsu Province, China. E-mail: xhliu@njust.edu.cn
First published on 11th December 2020
Abstract
The use of semiconductor photocatalysts to generate electrons with efficient reducing capability for organic photoreduction synthesis and the removal of harmful substances has become a hotspot in the field of green chemistry research. In this work, α-MnO2 nanocubes and α-MnO2@MnIn2S4 hybrid photocatalysts with a core–shell structure were synthesized successively by a two-step method. XRD and XPS verified the coexistence of the two substances (α-MnO2 and MnIn2S4) in hybrid systems. According to the SEM and TEM characterization, it is clearly seen that MnIn2S4 nanosheets grow on α-MnO2 nanocubes to form a hierarchical structure. Furthermore, HRTEM showed that the interface contact between α-MnO2 and MnIn2S4 resulted in an atomically defined junction. The photocatalytic performance of the composite catalyst was evaluated by reducing 4-nitroaniline to 4-phenylenediamine and Cr(VI) to Cr(III), respectively. The results show that the catalytic activity of the composite material is effectively improved compared to that of the single components. The Z-scheme electron transport mechanism was proved by ultraviolet-visible diffuse reflectance spectroscopy, valence band XPS, energy band structure calculation and active species detection experiments. The constructed Z-scheme hierarchical α-MnO2@MnIn2S4 system with an atomically defined junction can improve the redox performance of semiconductors for organic synthesis and environmental remediation.
1 Introduction
Recently, with the development of industrialization, human society's demand for industrial chemicals has been increasing, and the issue of environmental pollution has also been paid more and more attention to.1–3 4-Phenylenediamine (4-PDA) is a widely used industrial chemical raw material. It can be used in the preparation of azo dyes, as well as in the preparation of developers, rubber antioxidants, and copper–iron indicators.4–8 The industrial preparation of 4-PDA is mainly carried out by using 4-nitroaniline (4-NA) as a raw material and adopting industrial hydrogenation.9,10 This method is restricted by strict reaction conditions and complicated procedures. In recent years, some research studies involving photocatalytic and electrocatalytic methods to prepare 4-PDA have attracted more and more attention.11,12 Among these methods, highly selective photoreduction of 4-NA to 4-PDA in water systems has become a powerful technology. Moreover, dealing with highly toxic hexavalent chromium is a difficult task in the treatment of world environmental pollution.13,14 Based on trivalent chromium's low toxicity and easy flocculation into Cr(OH)3 in an alkaline environment, reducing Cr(VI) to trivalent chromium has become a key procedure for environmental remediation.15,16 Among the currently developed reduction methods, photocatalytic reduction has shown potential application prospects compared with high-cost chemical reduction methods17 and biological reduction methods18 with high environmental requirements. Therefore, visible-light-driven semiconductor photocatalysis has received extensive attention in these fields because of its low cost, environmental friendliness and unique reaction mechanisms and easy availability of materials.19–22 Importantly, photogenerated electrons generated by semiconductors with a deeper conduction band top have extremely strong reducibility and have attracted the attention of researchers.Manganese-based materials (MnO2, Mn3O4, MnFeO4, MnSiO3, and metal–Mn LDH) are widely used in photocatalytic environmental remediation, supercapacitors, lithium–sulfur batteries, and guided cancer treatments due to their low-cost, easy availability, environmental friendliness, high theoretical capacitance, and narrow band gap.23–27 The visible light absorption capability of manganese oxide among them is high due to its narrow band gap which makes it a promising candidate for photocatalysis. Gaigneaux et al. reported a plasma chemical reduction method to prepare three kinds of α-, γ- and δ-MnO2. Tartrazin yellow was selected as the model pollutant for photocatalytic activity evaluation, and the results showed that α-MnO2 has achieved the best overall photocatalytic performance.28 On the other hand, the weaker photoreduction ability caused by the higher conduction band potential and the high recombination efficiency of photogenerated carriers caused by the narrow band gap limit the in-depth application of MnO2 in the photocatalytic industry. Fortunately, the preparation of composite nanomaterials and the introduction of the concept of heterojunction catalysis greatly improve this defect. Leung et al.29in situ synthesized a TiO2/MnO2 heterojunction catalyst by a hydrothermal method and used the catalyst for vacuum ultraviolet (VUV) photocatalytic oxidation of toluene degradation. The good contact of the heterojunction structure of TiO2/MnO2 effectively inhibited the recombination of photo-excited electron–hole pairs and improved the catalytic activity. Qiu et al.30 built a Z-scheme mesoporous α-MnO2/Mn3O4 heterojunction to promote its photocatalytic oxidation activity by using the characteristics of Mn having multivalent states. It is proposed that the heterojunction of multivalent manganese oxide can efficiently prevent the recombination of photo-generated carriers.
Furthermore, MnIn2S4, which belongs to the AB2X4 (A = Cu, Cd, and Mn; B = Al, Ga, and In; X = S, Se, and Te) family,31–33 has also received considerable attention in the field of photocatalysis due to its suitable band gap and simple preparation. Chen et al.34 synthesized a direct Z-scheme 2D/2D MnIn2S4/g-C3N4 structure, which has high photocatalytic activity for the treatment of pharmaceutical wastewater and hydrogen evolution.
In this work, α-MnO2 nanocubes were obtained through the guiding effect of surfactant and annealing treatment, and then a multi-stage α-MnO2@MnIn2S4 composite photocatalyst was synthesized in situ by a solvothermal reaction after adsorption of Mn2+ and In2+. SEM and TEM showed that the synthesized catalyst was MnIn2S4 nanosheets coated on α-MnO2 nanocubes making an α-MnO2@MnIn2S4 core–shell structure. Compared with the single materials, the composite catalyst exhibits excellent catalytic activity and structural stability in reducing 4-NA and Cr(VI).
2 Experimental
2.1 Materials
All reagents were used without any further purification in this research. Manganese sulfate monohydrate (MnSO4·H2O, AR), cyclohexane (C6H12), manganese chloride tetrahydrate (MnCl2·4H2O, AR), indium chloride (InCl3·4H2O, AR) and ammonium formate (CH5NO2) were bought from Aladdin Industrial Corporation. Potassium dichromate (KCr2O7), potassium permanganate (KMnO4), cetyltrimethylammonium bromide (CTAB), ammonium bicarbonate (NH4HCO3), and thioacetamide (TAA) were purchased from Sinopharm Group Chemical Reagent Co., Ltd.2.2 Catalyst synthesis
| 2MnO4− + MnCO3 + H2O → 2MnO42− + MnO2 + 2H+ + CO2 | (1) |
After filtering and separation of the above suspension, it was dried at 60 °C for 8 hours to obtain a δ-MnO2 precursor. Furthermore, the obtained δ-MnO2 precursor was heat-treated in an air atmosphere at 500 °C for 2 h at a heating rate of 5 °C min−1 to obtain α-MnO2 nanocubes.
2.3 Characterization of the catalyst
The morphology of the fabricated samples was demonstrated by using an electron microscope (SEM and TEM, JEM-2100). X-ray diffraction (XRD, D8 Advance X-ray diffractometer, Cu K, λ = 1.5406 Å, tube voltage 40 kV, tube current 40 mA) was used to characterize the crystallinity and structure of the catalyst. The surface element composition and valence state of the sample were determined by X-ray photoelectron spectroscopy. The ultraviolet-visible diffuse reflection spectrum (DRS) was used to show the light absorption capacity of the catalyst using BaSO4 as the substrate.2.4 Evaluation of photocatalytic performance
The photocatalytic activity of the catalyst was evaluated by reducing 4-nitroaniline (4-NA) and Cr(VI). In a typical catalytic process, 50 mg of the sample was dispersed in 50 mL 4-NA (10 mg L−1) ultrasonically, and ammonium formate (150 mg) was added as a hole trapping agent. Before the irradiation, the adsorption–desorption equilibrium was achieved in the dark and in a nitrogen environment for 1 h. At regular intervals, 3 mL of the photocatalytic reaction solution was taken out. The catalyst in the solution was removed with centrifugation and a 0.22 μm drainage filtration membrane. The product detection by using a UV-Vis spectrophotometer shows the characteristic absorption peak of 4-NA at 381.7 nm, while 293.7 nm and 238.1 nm belong to the characteristic absorption peaks of 4-phenylenediamine (4-PDA). In addition, for the photocatalytic reduction of Cr(VI), 50 mg of the sample was dispersed in 50 mL of 50 mg L−1 Cr(VI) solution and adsorbed in a dark room for 1 h. Under visible light irradiation, 1 mL of the solution was taken at regular intervals of 20 min and centrifuged to remove the catalyst. The concentration of Cr(VI) was detected at 540 nm by the normal diphenylcarbazide (DPC) method.2.5 Electrochemical performance test
The transient photocurrent and electrochemical impedance spectra (EIS) were obtained on a CHI 760E electrochemical workstation. The standard three-electrode system was composed of the photocatalyst (0.2 mg sample loaded on a 1.0 cm2 conductive glass area), a platinum wire, and a saturated Ag/AgCl electrode, which were used as the working electrode, counter electrode, and reference electrode in the test system. The transient photocurrent test of the sample was carried out in 0.5 M Na2SO4 aqueous solution with a 300 W xenon lamp with a 420 nm cutoff filter. The electrochemical impedance spectroscopy test of the sample was carried out in 0.1 M KCl solution containing 2.5 mM K3[Fe(CN)6]/K4[Fe(CN)6] as the electrolyte.3 Results and discussion
In this work, we constructed a heterojunction photocatalyst by growing MnIn2S4 nanosheets in situ on the surface of α-MnO2 nanocubes to efficiently reduce 4-NA and Cr(VI), constructing a core–shell-like α-MnO2@MnIn2S4 hierarchical heterostructure as illustrated schematically in Fig. 1. Firstly, MnCO3 nanocubes were synthesized by room temperature solvent orientation. After an oxidation–reduction reaction with KMnO4 and annealing treatment, the α-MnO2 nanocubes are obtained. Finally, MnIn2S4 nanosheets were grown in situ on the surface of α-MnO2 nanocubes by a solvothermal reaction. It should be noted that Mn2+ will be preferentially adsorbed to the α-MnO2 surface due to the negative charge of the α-MnO2 surface36 and the Fajans rules during the stirring process before the solvothermal reaction,37 which is beneficial in the in situ growth of MnIn2S4. The photocatalytic functions of α-MnO2 and MnIn2S4 are concentrated in a hierarchical core–shell structure, which facilitates the separation and migration of photogenerated electrons and holes, and provides a large number of active sites for the reduction reaction.3.1 Structure and morphology
The powder X-ray diffraction (XRD) technology was used to investigate the crystal structure and phase purity of pure MnIn2S4 nanosheets, α-MnO2 nanocubes, and all M–MIS nanocomposites with different α-MnO2 contents. Fig. S1† displays the XRD pattern of the as-prepared MnCO3 precursor in which all the characteristic crystal peaks are consistent with the cubic phase (JCPDS no: 44-1472).38 As shown in Fig. S2,† the pure MnO2 sample shows diffraction peaks at 12.8°, 18.1°, 28.8°, 36.7°, 37.5°, and 49.9°, which can be assigned to the (110), (200), (310), (400), (211) and (411) crystallographic planes of cubic α-MnO2 (JCPDS no: 44-0141).39 Along with the coupling of MnIn2S4 nanosheets and α-MnO2 to form the α-MnO2@MnIn2S4 nanocomposite catalyst, the M–MIS-x series samples show diffraction peaks at 14.3°, 27.6°, 33.4°, and 48°, respectively, which correspond to the (111), (311), (400) and (440) crystal planes of cubic phase (JCPDS no: 65-7474) MnIn2S4.34 It is worth noting that there is no impurity diffraction characteristic peak of In2S3 or MnS in the pure MnIn2S4 and M–MIS-x composite catalysts. The hierarchical composite catalyst assembled using α-MnO2 and MnIn2S4 is beneficial to the carrier transport between the interfaces and improves the photocatalytic activity.40,41The morphology of the as-prepared materials was characterized by SEM and TEM. Fig. 2a–c shows the morphology of MnCO3 as the precursor of α-MnO2. The size of the cube with a smooth surface is about 200 nm. As shown in Fig. S3,† after the reaction of MnCO3 with KMnO4, the morphology of the nanocube is still maintained, and “small thorns” of nanosheets are grown on the smooth surface. After the annealing treatment, the surface of the δ-MnO2 nanocube becomes rough due to the etching of the ions and voids are generated inside, which will facilitate the adsorption of Mn2+ and In3+ to form a heterojunction in situ (Fig. 2d–f). The HRTEM image of a single nanocube (Fig. 2i-II) exhibits the lattice lines with a spacing of about 0.692 nm and 0.245 nm, which are in good agreement with the (110) and (400) crystal plane distances of α-MnO2,42,43 respectively, and the angle between the two crystal planes is 45°. MnIn2S4 was crystallized in three-dimensional nanoflakes as shown in Fig. 2g and h, and this two-dimensional structure can provide more catalytic sites. Similarly, the lattice fringes attributed to the (222) and (400) crystal planes of MnIn2S4 are 0.309 nm and 0.268 nm, respectively (Fig. 2i-I).34 Next, the thin MnIn2S4 nanosheets were grown on the surface of the α-MnO2 cubes by a solvothermal method. After the reaction, MnIn2S4 nanosheets uniformly covered the surface of the α-MnO2 cube and had a good overall 3D morphology (Fig. 2j). The layered cubic core–shell structure of α-MnO2@MnIn2S4 is shown by the TEM images (Fig. 2k). No visible interlayer gaps were found between the MnIn2S4 shell and the α-MnO2 core (Fig. S4†), indicating close contact between the two components. The HR-TEM image shows the heterojunction between layered MnIn2S4 and α-MnO2 (Fig. 2l), in which lattice fringes can be assigned to cubic α-MnO2 and hexagonal MnIn2S4 crystal planes can be seen. In particular, the red elliptical area in Fig. 2l clearly shows the interface with an atomic junction between the crystal planes of the two materials. These results provide clear evidence of the formation of an α-MnO2@MnIn2S4 core–shell structure.
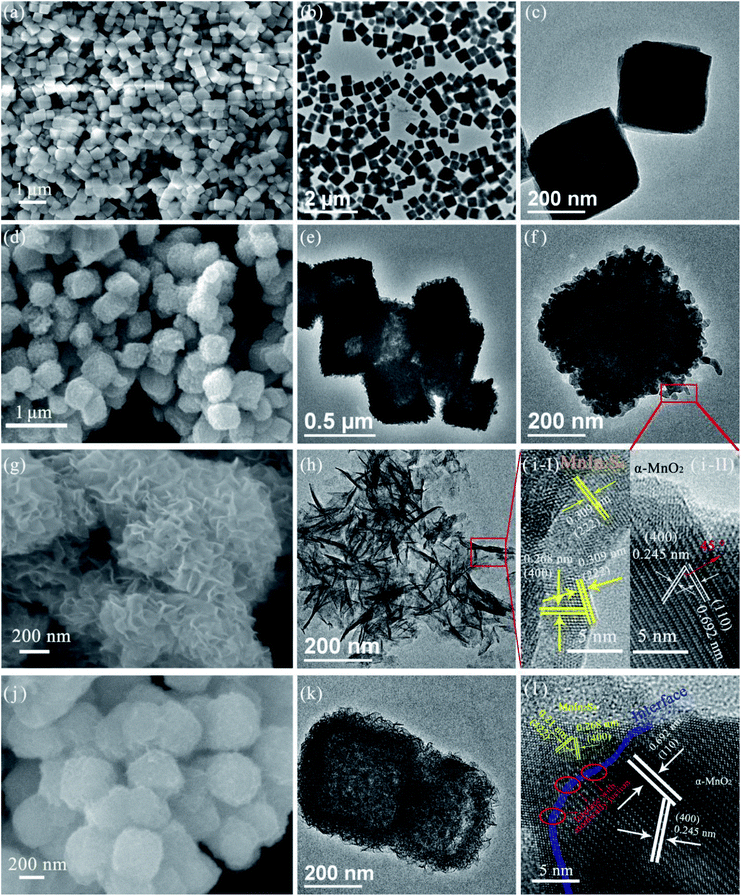 | ||
| Fig. 2 SEM and TEM images of (a–c) MnCO3 nanocubes, (d–f) α-MnO2 nanocubes, (g and h) MnIn2S4 nanosheets, and (j and k) M–MIS-2, and HRTEM images of (i) α-MnO2 (II) and MnIn2S4 (I) and (l) M–MIS-2. | ||
Besides, the SEM elemental mapping of M–MIS-2 is shown in Fig. 3a. It can be seen from the images that Mn, O, In, and S elements all appear on the hierarchical nanocubes, which verifies the successful recombination of MnIn2S4 and α-MnO2 from the side. In order to clearly understand the combination of the two components at the interface, a schematic illustration of the interface and atomic-junction combination of α-MnO2 and MnIn2S4 is shown based on HR-TEM and SEM elemental mapping (Fig. 3b). The negative charge oxygen atoms in α-MnO2 crystals are exposed on the surface.44,45 Mn2+ and In3+ exist in the suspension system at the same time, and Mn2+ will be preferentially anchored on the surface of α-MnO2 according to the Fajans rules.37 These atomically-defined-junction and close interface contact facilitate the transport and separation of photo-generated electrons and improve the catalytic activity of the photocatalyst.
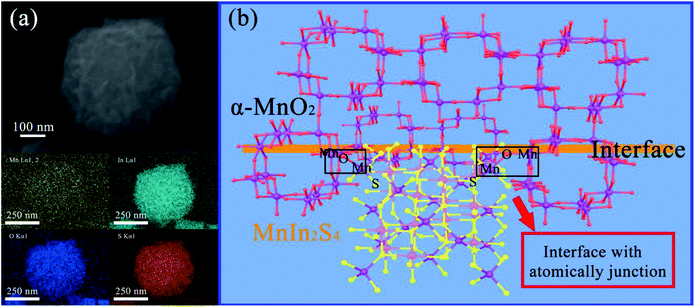 | ||
| Fig. 3 (a) SEM elemental mapping of M–MIS-2 and (b) schematic illustration of the interface between α-MnO2 and MnIn2S4. | ||
3.2 Surface element analysis
The surface elements and valence states of the as-prepared photocatalyst were characterized by XPS. Herein, the interaction mechanism between α-MnO2 and MnIn2S4 can be further confirmed by Mn 2p3/2, 2p1/2, and S 2p XPS analysis.46 Fig. S5† shows the full-scale XPS spectra for α-MnO2@MnIn2S4 (M–MIS-2) and single α-MnO2 and MnIn2S4. Among them, the M–MIS-2 XPS spectrum contains Mn, In, O, and S elements, which confirms the coexistence of α-MnO2 and MnIn2S4 in the composite materials. This result is completely consistent with SEM elemental mapping (Fig. 3a). The Mn 2p spectra of M–MIS-2 are displayed in Fig. 4a and show the characteristic peaks assigned to Mn2+ (641.48 eV and 652.32 eV) and Mn4+ (643.92 eV and 653.71 eV).47,48 Compared with composite materials, the position of the characteristic peak of Mn 2p3/2 and Mn 2p1/2 in single α-MnO2 and MnIn2S4 is shifted, which is closely related to the heterojunction formation by the two materials.49 It can be seen from Fig. 4b that the O 1s high-resolution spectra of α-MnO2 and M–MIS-2 samples show the characteristic peak at 529.43 eV, which belongs to Mn–O–Mn.50 Moreover, the characteristic peaks located at 531.37 eV and 530.31 eV in α-MnO2 and M–MIS-2 can be assigned to Mn–O–H, respectively.51 The Mn–O–H shift to low binding energy is because the chemical state of Mn on the surface of α-MnO2 is 4+, which is higher than that (2+) of Mn in the MnIn2S4 on the surface of M–MIS-2. As shown in Fig. 4c, the binding energy of S 2p in MnIn2S4 was detected at 161.30 eV and 162.37 eV, respectively. Correspondingly, the characteristic peak of the composite catalyst (M–MIS-2) has a slight shift towards high binding energy (161.25 eV and 162.25 eV, respectively).52 The In 3d spectra of MnIn2S4 and M–MIS-2 are illustrated in Fig. 4d. The binding energies of the doublets are 3d5/2 (444.88 eV and 444.77 eV) and 3d3/2 (452.50 eV and 452.37 eV), respectively. As mentioned earlier, the shift in binding energy of the heterojunction sample indicates a strong interaction between MnIn2S4 nanosheets and α-MnO2 nanocubes, which enhances the migration efficiency of photogenerated carriers, thereby improving the catalytic activity of the catalyst.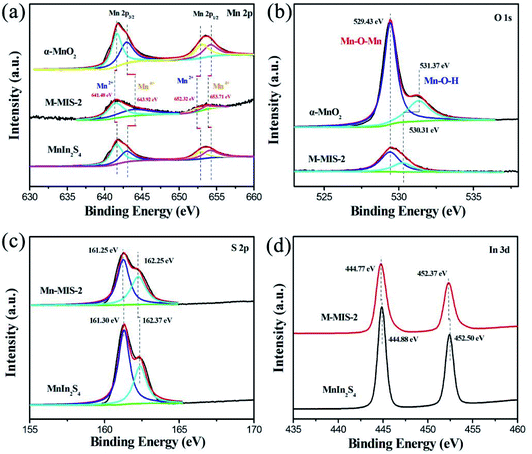 | ||
| Fig. 4 High-resolution (a) Mn 2p, (b) O 1s, (c) S 2p and (d) In 3d XPS spectrum for the α-MnO2@MnIn2S4 (M–MIS-2), and pure α-MnO2, and MnIn2S4. | ||
3.3 Optical properties, band structure and carrier separation efficiency
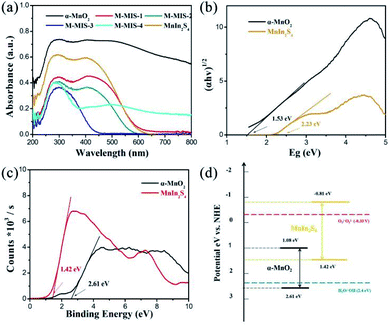
Many factors affect the activity of photocatalysts, such as the band gap, crystal structure, crystal plane orientation and optical properties.53,54 Among them, optical properties are the most important characteristics that determine the application of photocatalytic materials in the field of photocatalysis. Fig. 5a shows the UV-Vis diffuse reflectance spectra of M–MIS with different molar ratios and single materials. Compared with other materials, α-MnO2 has higher band-edge absorption in the visible and near-infrared regions, indicating that it is a narrow band gap semiconductor. The absorption band edge of MnIn2S4 is about 560 nm. With the increase of the content of α-MnO2 in the α-MnO2@MnIn2S4 heterostructure, the absorption of the composite materials in visible light gradually increases, which is beneficial for the easy excitation of the semiconductor under visible-light and generates more carriers. Furthermore, the band gap width of α-MnO2 and MnIn2S4 calculated using the Kubelka–Munk formula is determined to be 1.53 eV and 2.23 eV, respectively, which are consistent with those in the reported literature.30,34 Similarly, the positions of the bottom of the valence band (VB) of α-MnO2 and MnIn2S4 are determined from the VB-XPS analysis and it was found to be 2.61 eV and 1.42 eV, respectively (Fig. 5c). Furthermore, the CB potential of α-MnO2 and MnIn2S4 at the point of zero charges was theoretically calculated from eqn (2):55| Eg = |ECB − EVB| | (2) |
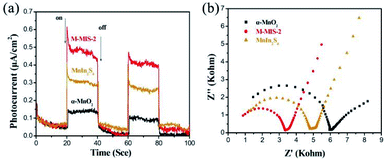
Moreover, the migration rate of photogenerated carriers is also an important factor of the photocatalytic activity of the catalyst. To further compare the migration and separation efficiency of photogenerated electrons–holes of the different materials, the transient photocurrent responses were measured during several on–off intermittent irradiation cycles.56 As shown in Fig. 6a, the M–MIS-2 exhibited a much higher photocurrent response than other single photocatalysts (α-MnO2 and MnIn2S4), indicating that the composite material has a higher charge generation and transfer efficiency. This carrier migration in the composite catalyst leads to an effective eCB−–hVB+ separation and a lower recombination rate in the M–MIS-2 sample, ultimately leading to enhanced photocatalytic performance.57 Furthermore, EIS measurements are used to gain a deeper understanding of the photogenerated charge carrier transfer process and recombination behavior. Fig. 6b displays a typical Nyquist plot of different samples under dark conditions. It can be seen that the α-MnO2 electrode forms a partial semicircle with a diameter larger than that of the other samples. The semicircle in the high-frequency region reflects the charge transfer resistance and constant phase elements at the photocatalyst/electrolyte interface. The radius of the semicircle of M–MIS-2 is the smallest at any frequency, indicating that the charge transfer resistance is smaller, which leads to a better electronic conductivity and charge separation efficiency.58 Furthermore, the high electron–hole separation efficiency in the M–MIS composite photocatalyst was analyzed by steady-state photoluminescence (PL) spectroscopy. As can be seen from Fig. S6,† M–MIS-2 exhibits a lower PL emission intensity compared to α-MnO2 and MnIn2S4, which means that there is a faster charge transfer rate at the contact interface of the composite catalyst, and it has a better separation efficiency than a single component.
3.4 Photocatalytic performance
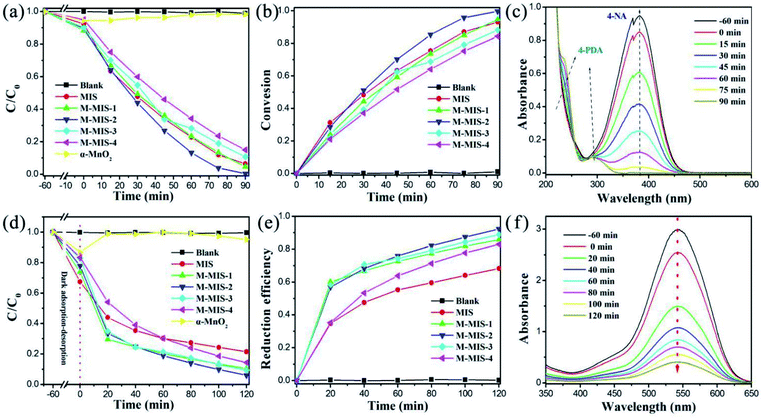
The photocatalytic performance of the synthesized α-MnO2@MnIn2S4 heterojunctions was characterized by the photoreduction from 4-NA to 4-PDA with a visible light source (λ > 420 nm). Obviously, pure α-MnO2 has no activity towards 4-PDA evolution from 4-NA, and the dark adsorption on the surface of α-MnO2 gradually desorbs 4-NA molecules during the light process. Different amounts of α-MnO2 were compounded with MnIn2S4, and the photocatalytic performance of M–MIS on 4-NA was greatly improved (Fig. 7a). In particular, M–MIS-2 has the best reduction efficiency, with a conversion efficiency of 99.6% for photoreduction of 4-NA to 4-PDA within 90 min (Fig. 7b). As shown in Fig. 7c, with the gradual decrease in the intensity of the main absorption peak of 4-nitroaniline at 381.7 nm, at the same time the characteristic absorption peak intensities of 4-phenylenediamine at 293.7 nm and 238.1 nm consecutively increase. As shown in Fig. S7†, the color of the reaction solution gradually changed from light yellow to colorless after 90 minutes of visible light irradiation, indicating the highly selective conversion efficiency of 4-NA to 4-PDA.Similarly, the M–MIS heterojunction catalyst also shows higher photocatalytic efficiency towards the photoreduction of Cr(VI). As shown in Fig. 7d, when single α-MnO2 is used as a catalyst, the content of Cr(VI) changes little, which is attributed to the adsorption effect of the high specific surface area of the mesoporous α-MnO2. The composite catalysts showed higher catalytic activity than pure MIS in reducing Cr(VI). M–MIS-2 showed the best photocatalytic reduction efficiency among all the catalysts, reaching 94% (Fig. 7e and f). Therefore, the above results indicate that the M–MIS-2 sample exhibits excellent visible-light-driven photocatalytic reduction performance, indicating that the α-MnO2@MnIn2S4 heterojunction is an attractive material for environmental remediation and organic conversion.
Besides the photocatalytic activity of the target material, its catalytic stability is also an important factor in measuring the application prospects of the catalyst. It can be seen in Fig. 8a that the photoreduction reactions of 4-NA over M–MIS-2 can still maintain the conversion rate above 92%. The slight decrease may be due to the loss of the catalyst. The sample after four reduction experiments was characterized by XRD (Fig. 8b), and the results show that its crystal shape did not change significantly and had good stability. In addition, the SEM images of the M–MIS-2 catalyst before and after the reaction are shown in Fig. S8.† The morphology of the sample before and after the reaction is still maintained.
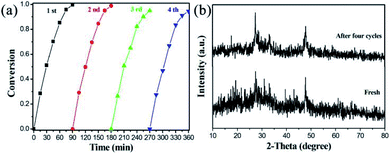 | ||
| Fig. 8 (a) Cycles of photocatalytic reduction of 4-NA by M–MIS-2; (b) XRD patterns of M–MIS-2 after four cycle experiments. | ||
3.5 Possible photocatalytic mechanism
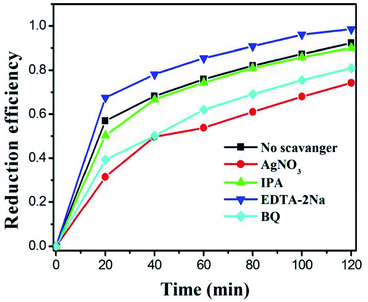
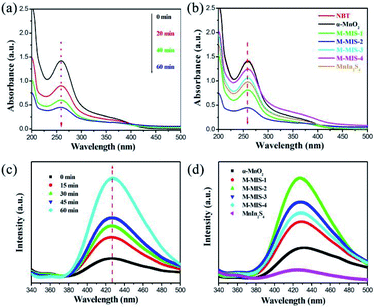
As we all know, the active species (such as superoxide radicals (˙O2−), holes (h+) and hydroxyl radicals (˙OH)) in the photocatalytic reaction system play an important role. In order to detect these species, we use AgNO3, isopropanol (IPA), and disodium ethylenediaminetetraacetic acid (EDTA–2Na) with a concentration of 1 mM as the e−, ˙OH and h+ capture agents.14,59,60 Obviously, it can be observed from Fig. 9 that with the addition of AgNO3, the reduction efficiency of the catalyst towards Cr(VI) significantly decreases, indicating that e− is an important active species participating in the reduction reaction. After IPA was introduced into the photoreduction system, the catalytic efficiency decreased slightly, which may be because some of the ˙OH was produced by e− and competed with the Cr(VI) reduction process. When the EDTA–2Na is added, it can be found that the catalytic reduction efficiency was significantly improved, which is due to the addition of the hole trapping agent and it inhibits the recombination of photogenerated electrons–holes, consequently, improving the rate and utilization of electron migration to the catalyst surface. After adding BQ in the system, the photocatalytic reduction efficiency also decreased, which is due to the generation of ˙O2− from photogenerated electrons. When the ˙O2− was captured, the balance of the reaction (e− + O2 → ˙O2−) moves to the right, reducing the photogenerated electrons in the reaction system. Therefore, during the photocatalytic Cr(VI) reduction, the electrons are the main participating species.To further demonstrate the photocatalytic reaction mechanism of α-MnO2@MnIn2S4, the detection of superoxide radicals (˙O2−) and hydroxyl radicals (˙OH) can be carried out. The enhanced photocatalytic ability was confirmed by conversion experiments of nitro blue tetrazolium (NBT) and terephthalic acid (TA). Due to the exclusive reaction between ˙O2− and NBT, NBT can be used to detect the presence of ˙O2− in the photoreaction.61 Therefore, in the photocatalytic reaction, a low NBT concentration means that a large amount of ˙O2− is produced in the system. It can be seen from Fig. 10a that, as the photocatalytic reaction time increases, the NBT concentration continues to decrease, confirming that the α-MnO2@MnIn2S4 (represented by M–MIS-2) system can produce ˙O2− during the photoreaction. The NBT measurement of all samples after 60 min is shown in Fig. 11b. Taking into account the effect of error, no change in the concentration of NBT was observed in the single α-MnO2 system, indicating that ˙O2− was not produced during the photoreaction. In addition, M–MIS-2 produced the highest level of ˙O2−. The ˙O2− is produced by the reaction of O2 with photogenerated electrons and more O2 indicates high separation efficiency of photogenerated carriers in the α-MnO2@MnIn2S4 system.
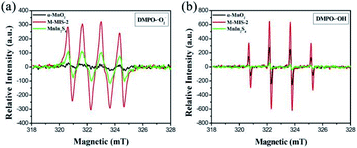 | ||
| Fig. 11 ESR spectra of radical adducts trapped by DMPO: (a) DMPO–˙O2− and (b) DMPO–˙OH in the α-MnO2, MnIn2S4 and M–MIS-2 dispersion solution. | ||
At the same time, high ˙O2− production concentration are accompanied by high ˙OH concentrations.62 The ˙OH can be equally divided with terephthalic acid (TA) to form 2-hydroxyterephthalic acid (TAOH), which exhibits a characteristic peak at 425 nm when excited at a wavelength of 325 nm, so TA can be applied to detect ˙OH. As shown in Fig. 10c, the gradual increase of the fluorescence intensity over time indicates that ˙OH is gradually generated during the illumination process. In addition, the fluorescence signal of M–MIS-x is stronger than that of single α-MnO2 and MnIn2S4 after 60 min of irradiation (Fig. 10d). The M–MIS-2 has the highest signal intensity, which further proves that the composite material can produce higher active oxygen performance. This is consistent with the NBT detection result, which indicates that the composite catalyst improves the separation efficiency of carriers and produces more active components.
Furthermore, as shown in Fig. 11a, the ESR signal for DMPO–˙O2− can be observed for MnIn2S4 and M–MIS-2, which means that ˙O2− was generated in the reaction system during visible light irradiation. Moreover, the characteristic peak of DMPO–˙OH for pure MnIn2S4 does not appear under visible light irradiation (Fig. 11b) but four weak peaks were detected for pure α-MnO2. As for M–MIS-2 heterojunction composites, the DMPO–˙OH signal intensities of ˙OH are obviously much higher than those in pure α-MnO2, which can be attributed to the construction of the atomically defined heterojunction to improve ˙OH production.
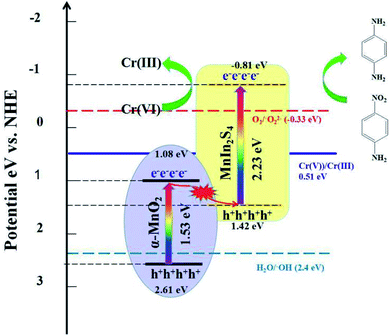
Based on the above test results and experimental phenomenon, a possible Z-scheme photocatalytic reduction mechanism of 4-NA and Cr(VI) using α-MnO2@MnIn2S4 is proposed. As illustrated in Fig. 12, under visible light irradiation, the electrons located on the valence band (VB) of α-MnO2 and MnIn2S4 are excited and then transfer to the conduction band (CB), while holes remain on the VB. At the interface of α-MnO2 and MnIn2S4, electrons in the CB of α-MnO2 are transferred along the interface to the VB of MnIn2S4 to recombine with holes. The electrons remaining in the CB of MnIn2S4 gain relatively more negative potential energy and have stronger reducibility, and then react with 4-NA and Cr(VI), hence reducing them to 4-PDA and Cr(III). In contrast to the traditional type-II electron transport mechanism (Fig. S9†), the e− in the CB of MnIn2S4 migrates to the CB of α-MnO2 and the h+ of α-MnO2 is transferred to the VB of MnIn2S4. Since the CB potential of α-MnO2 is more positive than that of O2/˙O2− (E = −0.33 eV)63 and Cr(VI)/Cr(II) (E = 0.51 eV),64 the VB potential of MnIn2S4 is more negative than that of H2O/˙OH (E = 2.4 eV).65 In this case, the catalyst cannot only reduce Cr(VI) to Cr(III), but also cannot generate ˙O2− and ˙OH in the reaction system, which is contrary to the experimental results (NBT and TA detection test). Therefore, the electron transmission in α-MnO2@MnIn2S4 is a novel Z-scheme mechanism instead of the traditional type-II mechanism.
4 Conclusions
In summary, a core–shell α-MnO2@MnIn2S4 hierarchical cubic Z-scheme heterostructure was designed and assembled by growing MnIn2S4 nanosheets in situ on the surface of α-MnO2 nanocubes as a heterojunction photocatalyst, which was used to efficiently reduce 4-NA and Cr(VI) under visible light. The composition and structure of the final heterojunction were controlled by facile annealing treatment and a hydrothermal reaction. The interface contact heterojunction defined at the atomic-level has proven the effective and rapid migration of photogenerated carriers on the catalytic surface, and the complex multilayer structure also exposes abundant catalytic sites, providing a large specific surface area for the adsorption of 4-NA and Cr(VI), and consequently, highly improving the photocatalytic reduction reaction. As a result, Z-scheme α-MnO2@MnIn2S4 with the optimal composition ratio showed excellent reduction performance and cycle stability. The selective reduction of 4-NA to 4-PDA was almost complete (99.6%) within 90 minutes, and the Cr(VI) reduction efficiency reached more than 93% within 120 minutes. This work reveals the basis of the photocatalytic performance of α-MnO2@MnIn2S4 composite materials and has potential application in organic photosynthesis and pollutant purification.Credit author statement
Min Zhang: Conceptualization, methodology, software, investigation, and writing-original draft. Muhammad Arif and Yuxiang Hua: Writing – review & editing, supervision, and visualization. Bo Qiu: Resources, software, supervision, and data curation. Yue Mao: Resources and visualization. Xiaoheng Liu: Writing-review & editing and supervision. All the authors discussed the results and commented on the article.Conflicts of interest
There are no conflicts to declare.Acknowledgements
This work was supported by the National Natural Science Foundation of China (51872141). The TEM part of this work was supported by Mr Chenyao Hu from Nanjing Forestry University.References
- D. A. Nicewicz and D. W. C. MacMillan, Science, 2008, 322, 77–80 CrossRef CAS.
- H. Seo, M. H. Katcher and T. F. Jamison, Nat. Chem., 2017, 9, 453–456 CrossRef CAS.
- H. B. Yu, L. B. Jiang, H. Wang, B. B. Huang, X. Z. Yuan, J. H. Huang, J. Zhang and G. M. Zeng, Small, 2019, 15, 1901008 CrossRef.
- B. Weng, S. Q. Liu, N. Zhang, Z. R. Tang and Y. J. Xu, J. Catal., 2014, 309, 146–155 CrossRef CAS.
- R. W. Liang, F. F. Jing, G. Y. Yan and L. Wu, Appl. Catal., B, 2017, 218, 452–459 CrossRef CAS.
- A. L. Chibac, V. Melinte, V. Brezová, E. A. Brosseau, V. Langlois and D. L. Versace, ChemCatChem, 2019, 11, 3307–3317 CrossRef CAS.
- K. Mishra, T. N. Poudel, N. Basavegowda and T. R. Lee, J. Catal., 2016, 344, 273–285 CrossRef CAS.
- Z. H. Farooqi, R. Khalid, R. Begum, U. Farooq, Q. S. Wu, W. T. Wu, M. Ajamal, A. Irfan and K. Naseem, Environ. Technol., 2019, 40, 2027–2036 CrossRef CAS.
- M. A. Pandit, S. H. K. N. Dasari, S. Billakanti, M. Ramadoss and K. Muralidharan, J. Phys. Chem. C, 2020, 124, 18010–18019 CrossRef CAS.
- T. Liu, Y. Sun, B. Jiang, W. Guo, W. Qin, Y. M. Xie, B. Zhao, L. Zhao, Z. Q. Liang and L. Jiang, ACS Appl. Mater. Interfaces, 2020, 12, 28100–28109 CrossRef CAS.
- W. Chen, T. Y. Liu, T. Huang, X. H. Liu and X. J. Yang, Nanoscale, 2016, 8, 3711–3719 RSC.
- P. Viswanathan and R. Ramaraj, J. Mol. Catal. A: Chem., 2016, 424, 128–134 CrossRef CAS.
- M. Misra, S. R. Chowdhury and T. I. Lee, Appl. Catal., B, 2020, 272, 118991 CrossRef CAS.
- L. Hou, Y. Q. Zhang, Y. Y. Ma, Y. L. Wang, Z. F. Hu, Y. Z. Gao and Z. G. Han, Inorg. Chem., 2019, 58, 16667–16675 CrossRef CAS.
- B. Jiang, Y. F. Gong, J. N. Gao, T. Sun, Y. J. Liu, N. Oturan and M. A. Oturan, J. Hazard. Mater., 2019, 365, 205–226 CrossRef CAS.
- J. Ding, L. T. Pu, Y. F. Wang, B. D. Wu, A. Q. Yu, X. L. Zhang, B. C. Pan, Q. X. Zhang and G. D. Gao, Environ. Sci. Technol., 2018, 52, 12602–12611 CrossRef CAS.
- H. L. Ma, Y. M. Zhang, Q. H. Hu, D. Yan, Z. Z. Yu and M. L. Zhai, J. Mater. Chem., 2012, 22, 5914–5916 RSC.
- X. Zheng, D. Yuan, Y. Li and C. G. liu, Environ. Pollut., 2019, 254, 113042 CrossRef CAS.
- C. P. Xu, P. R. Anusuyadevi, C. Aymonier, R. Luque and S. Marre, Chem. Soc. Rev., 2019, 48, 3868–3902 RSC.
- L. Buzzetti, G. E. M. Crisenza and P. Melchiorre, Angew. Chem., Int. Ed., 2019, 58, 3730–3747 CrossRef CAS.
- A. Li, W. Zhu, C. C. Li, T. Wang and J. L. Gong, Chem. Soc. Rev., 2019, 48, 1874–1907 RSC.
- R. Xiao, C. X. Zhao, Z. Y. Zou, Z. P. Chen, L. Tian, H. T. Xu, H. Tang, Q. Q. Liu, Z. X. Lin and X. F. Yang, Appl. Catal., B, 2020, 268, 118382 CrossRef CAS.
- H. H. Zeng, B. L. Xing, C. T. Zhang, L. J. Chen, H. H. Zhao, X. F. Han, G. Y. Yi and G. X. Huang, Energy Fuels, 2020, 34, 2480–2491 CrossRef CAS.
- S. I. Han, S. W. Lee, M. G. Cho, J. M. Yoo, M. H. Oh, B. Jeong, D. Kim, O. K. Park, J. C. Kim, E. Namkoong, J. W. Jo, N. Lee, C. H. Lim, M. Soh, Y. E. Sung, J. M. Yoo, K. Park and T. W. Hyeon, Adv. Mater., 2020, 32, 2001566 CrossRef CAS.
- X. Sun, G. L. Zhang, R. H. Du, R. Xu, D. W. Zhu, J. C. Qian, G. Bai, C. Yang, Z. Y. Zhang, X. Zhang, D. H. Zou and Z. Y. Wu, Biomaterials, 2019, 194, 151–160 CrossRef CAS.
- P. Miao, J. X. Chen, Y. S. Tang, K. J. Chen and J. Kong, Sci. China Mater., 2020, 1–12 Search PubMed.
- D. L. Chao, C. Ye, F. X. Xie, W. H. Zhou, Q. H. Zhang, Q. F. Gu, K. Davey, L. Gu and S. Z. Qiao, Adv. Mater., 2020, 32, 2001894 CrossRef CAS.
- F. W. Boyom-Tatchemo, F. Devred, G. Ndiffo-Yemeli, S. Laminsi and E. M. Gaigneaux, Appl. Catal., B, 2020, 260, 118159 CrossRef CAS.
- Y. G. Zhang, M. Y. Wu, Y. H. Kwok, Y. F. Wang, W. Zhao, X. L. Zhao, H. B. Huang and D. Y. C. Leung, Appl. Catal., B, 2019, 259, 118034 CrossRef CAS.
- P. Wu, S. Q. Dai, G. X. Chen, S. Q. Zhao, M. L. Fu, P. R. Chen, Q. Chen, X. J. Jin, Y. C. Qiu, S. H. Yang and D. Q. Ye, Appl. Catal., B, 2020, 268, 118418 CrossRef CAS.
- S. B. Wang, Y. Wang, S. L. Zhang, S. Q. Zang and X. W. Lou, Adv. Mater., 2019, 31, 1903404 CrossRef CAS.
- C. Y. Liu, X. Li, J. Z. Li, Y. J. Zhou, L. L. Sun, H. Q. Wang, P. W. Huo, C. C. Ma and Y. S. Yan, Carbon, 2019, 152, 565–574 CrossRef CAS.
- D. Santamaria-Perez, M. Amboage, F. J. Manjon, D. Errandonea, A. Muñoz, P. Rodríguez-Hernández, A. Mújica, S. Radescu, V. V. Ursaki and I. M. Tiginyanu, J. Phys. Chem. C, 2012, 116, 14078–14087 CrossRef CAS.
- W. Chen, Z. C. He, G. B. Huang, C. L. Wu, W. F. Chen and X. H. Liu, Chem.Eng. J., 2019, 359, 244–253 CrossRef CAS.
- X. Q. Chen, Z. G. Cao, L. D. Xing, Y. H. Liao, Y. C. Qiu and W. S. Li, Nanoscale, 2017, 9, 18467–18473 RSC.
- H. Zhang, Q. Qi, P. G. Zhang, W. Zheng, J. Chen, A. G. Zhou, W. B. Tian, W. Zhang and Z. M. Sun, ACS Appl. Energy Mater., 2018, 2, 705–714 CrossRef.
- H. Fang and P. Jena, J. Mater. Chem. A, 2016, 4, 4728–4737 RSC.
- W. Wang and L. Ao, Cryst. Growth Des., 2008, 8, 358–362 CrossRef CAS.
- B. K. Wu, G. B. Zhang, M. Y. Yan, T. F. Xiong, P. He, L. he, X. Xu and L. Q. Mai, Small, 2018, 14, 1703850 CrossRef.
- Y. Shiraishi, J. Imai, N. Yasumoto, H. Sakamoto, S. Tanaka, S. Ichikawa and T. Hira, Langmuir, 2019, 35, 5455–5462 CrossRef CAS.
- C. K. Yao, A. L. Yuan, Z. S. Wang, H. Lei, L. Zhang, L. M. Guo and X. P. Dong, J. Mater. Chem. A, 2019, 7, 13071–13079 RSC.
- R. Bi, G. X. Liu, C. Zeng, X. P. Wang, L. Zhang and S. Z. Qiao, Small, 2019, 15, 1804958 CrossRef.
- B. X. Li, G. X. Rong, Y. Xie, L. F. Huang and C. Q. Feng, Inorg. Chem., 2006, 45, 6404–6410 CrossRef CAS.
- H. Chen, M. Q. Wang, Y. N. Yu, H. Liu, S. Y. Lu, S. J. Bao and M. W. Xu, ACS Appl. Mater. Interfaces, 2017, 9, 35040–35047 CrossRef CAS.
- C. Revathi and R. T. R. Kumar, Electroanalysis, 2017, 29, 1481–1489 CrossRef CAS.
- L. B. Ni, Z. Wu, G. L. Zhao, C. Y. Sun, C. Q. Zhou, X. X. Gong and G. W. Diao, Small, 2017, 13, 1603466 CrossRef.
- D. L. Chao, W. H. Zhou, C. Ye, Q. H. Zhang, Y. G. Cheng, L. Gu, K. Davey and S. Z. Qiao, Angew. Chem., Int. Ed., 2019, 58, 7823–7828 CrossRef CAS.
- X. Shi, H. Zheng, A. M. Kannan, P. Salcedo and B. Escobar, Inorg. Chem., 2019, 58(8), 5335–5344 CrossRef CAS.
- M. Zhang, J. C. Yao, M. Arif, B. Qiu, H. F. Yin, X. H Liu and S. M. Chen, Appl. Surf. Sci., 2020, 526, 145749 CrossRef CAS.
- Y. Y. Shi, S. M. Gao, Y. F. Yuan, G. J. Liu, R. C. Jin, Q. Y. Wang, H. Xu and J. Lu, Nano Energy, 2020, 77, 105153 CrossRef CAS.
- Y. Chen, X. Zhang, C. Xu and H. Xu, Electrochim. Acta, 2019, 309, 424–431 CrossRef CAS.
- R. Sha, N. Vishnu and S. Badhulika, Sens. Actuators, B, 2019, 279, 53–60 CrossRef CAS.
- C. X. Zhao, L. Tian, Z. Y. Zou, Z. P. Chen, H. Tang, Q. Q. Liu, Z. X. Lin and X. F. Yang, Appl. Catal., B, 2020, 268, 118445 CrossRef CAS.
- Y. C. Zhang, N. Afzal, L. Pan, X. W. Zhang and J. J. Zou, Adv. Sci., 2019, 6, 1900053 CrossRef.
- J. Zhou, J. X. Cui, M. Dong, C. Y. Sun, S. Q. You, X. L. Wang, Z. Y. Zhou and Z. M. Su, Chem. Commun., 2020, 56, 7261–7264 RSC.
- S. M. Ghoreishian, K. S. Ranjith, H. Lee, H. I. Ju, S. Z. Nikoo, Y. K. Han and Y. S. Huh, J. Hazard. Mater., 2020, 391, 122249 CrossRef CAS.
- L. H. Zheng, H. R. Su, J. Z. Zhang, L. S. Walekar, B. X. Zhou, M. C. Long and Y. H. Hu, Appl. Catal., B, 2018, 239, 475–484 CrossRef CAS.
- M. M. Fang, J. X. Shao, X. G. Huang, J. Y. Wang and W. Chen, J. Mater. Sci. Technol., 2020, 56, 133–142 CrossRef.
- P. J. Li, W. Cao, Y. Zhu, Q. Y. Teng, L. Peng, C. Y. Jiang, C. S. Feng and Y. P. Wang, Sci. Total Environ., 2020, 715, 136809 CrossRef CAS.
- H. F. Yin, Y. Cao, T. L. Fan, M. Zhang, J. C. Yao, P. F. Li, S. M. Cheng and X. H. Liu, Sci. Total Environ., 2020, 754, 141926 CrossRef.
- Y. C. Deng, J. Liu, Y. B. Huang, M. M. Ma, K. Liu, X. M. Dou, Z. J. Wang, S. C. Qu and Z. G. Wang, Adv. Funct. Mater., 2020, 30, 2002353 CrossRef CAS.
- M. Li, H. W. Huang, S. X. N. Tian and Y. H. Zhang, ChemCatChem, 2018, 10, 4477–4496 CrossRef CAS.
- T. Huang, Y. T. Luo, W. Chen, J. C. Yao and X. H. Liu, ACS Sustainable Chem. Eng., 2018, 6, 4671–4679 CrossRef CAS.
- C. Cheng, D. Y. Chen, N. J. Li, Q. F. Xu, H. Li, J. H. he and J. M. Lu, J. Hazard. Mater., 2020, 391, 122205 CrossRef CAS.
- W. Chen, L. Chang, S. B. Ren, Z. C. He, G. B. Huang and X. H. Liu, J. Hazard. Mater., 2020, 384, 121308 CrossRef CAS.
Footnote |
| † Electronic supplementary information (ESI) available. See DOI: 10.1039/d0na00848f |
| This journal is © The Royal Society of Chemistry 2021 |


