 Open Access Article
Creative Commons Attribution 3.0 Unported Licence
Micro- and nano-encapsulated metal and alloy-based phase-change materials for thermal energy storage
Shilei
Zhu
 ,
Mai Thanh
Nguyen
 and
Tetsu
Yonezawa
 *
*
Division of Materials Science and Engineering, Faculty of Engineering, Hokkaido University, Kita 13 Nishi 8, Kita-ku, Sapporo, Hokkaido 060-8628, Japan. E-mail: tetsu@eng.hokudai.ac.jp
First published on 14th June 2021
Abstract
An overview of recent literature on the micro- and nano-encapsulation of metallic phase-change materials (PCMs) is presented in this review to facilitate an understanding of the basic knowledge, selection criteria, and classification of commonly used PCMs for thermal energy storage (TES). Metals and alloys with high thermal conductivity can be used as PCMs for rapid heat storage in compact systems owing to their high volumetric TES density. The emerging application of metal PCMs in different fields such as solar thermal energy management, smart wearable devices with thermal comfort control, and cooling of electronic devices call for the need of micro- and nano-TES particles, which can be synthesised in different forms to satisfy specific requirements. As metals are easily oxidised, especially at the micro- and nano-level, encapsulation of metal-based PCM particles is important for sustainable use at high operating temperature in ambient conditions. Recent studies focusing on the encapsulation of metallic PCMs at the micro- and nano-level have been reviewed and classified in terms of the melting point of metal/alloy PCMs used and types of encapsulation materials, such as oxides, polymers, carbon, and metals. The current review is expected to provide an outlook on novel metal and alloy PCMs with function-directed structures and superior TES properties for a broad range of applications.
1. Thermal energy storage (TES)
When we look back at the history of humankind, the discovery of fire helped our ancestors move from the life of savages into the most dominant species on earth and in creating fantastic civilisations. Using fire for cooking is one of the earliest applications of thermal energy, in which chemical energy contained in wood is transformed into thermal energy by combustion and then transferred to food via the heating process, ultimately resulting in physical and chemical changes in the food being cooked.By April 2019, the human population on the Earth was ∼7.7 billion. Such large population numbers entail ever-increasing demands for different types of energy, including electricity, heat, and mechanical work. According to the International Energy Agency (IEA), world power generation in 2016 was 24![[thin space (1/6-em)]](https://www.rsc.org/images/entities/char_2009.gif) 973 TWh, of which power from coal and natural gas accounted for 38.4% and 23.2%, respectively.1 According to this data, energy generation is dominated by burning fossil fuels, which has resulted in massive emission of greenhouse gases like CO2, thus contributing to global warming. As a consequence of global warming, ice sheets in polar regions are melting at an increasing rate, potentially causing a global sea-level rise.2 Furthermore, due to the limited reserves and non-renewable characteristics of fossil fuels, we cannot depend completely on fossil fuels, as evidenced by the energy crisis that occurred in the 1970s.
973 TWh, of which power from coal and natural gas accounted for 38.4% and 23.2%, respectively.1 According to this data, energy generation is dominated by burning fossil fuels, which has resulted in massive emission of greenhouse gases like CO2, thus contributing to global warming. As a consequence of global warming, ice sheets in polar regions are melting at an increasing rate, potentially causing a global sea-level rise.2 Furthermore, due to the limited reserves and non-renewable characteristics of fossil fuels, we cannot depend completely on fossil fuels, as evidenced by the energy crisis that occurred in the 1970s.
1.1. Necessity of thermal energy storage and management
TES is crucial when attempting to harvest renewable energy resources via energy conversion and storage. Renewable energy resources refer to resources that can be ‘renewed’ in a human timescale. Solar energy, as one typical example of renewable energy, can be directly collected as thermal energy for utilisation in concentrated solar power plants (CSPs). However, the biggest problem with solar energy is related to its fluctuating availability, depending on time and space (Fig. 1). On the one hand, there is often a large mismatch between the peak hours of energy demand and consumption. For example, there is a big demand for air conditioning during summer nights in tropical areas, but no solar energy is available after sunset. On the other hand, due to geographical locations and climate, the distribution of solar energy varies across the planet (Fig. 1). For example, the solar resource available in the Sahara Desert is much larger than that in Hokkaido Island because of the differences in latitude; while the solar resource available in Yangtze Plain, located at the same latitude, is much less abundant than that in the Sahara Desert due to differences in the climate. Besides, the large-scale solar thermal power plants currently being used are set in remote areas, while the densest consumption of energy is from urban areas with a large population. This time and space mismatch of demand and supply in solar thermal energy for electricity production and supply can be addressed using TES.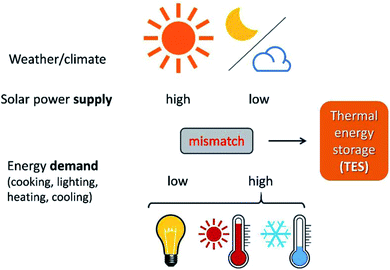 | ||
| Fig. 1 TES helps solve the time and space mismatch between the fluctuating solar energy supply and energy demand for human activity. | ||
High-grade thermal energy, if not consumed or stored, will simply dissipate into the environment as waste heat. This will result in irreversible degradation in thermal energy quality. In addition to CSP plants, a large amount of thermal energy is generated in other activities, such as industrial waste heat and heat from nuclear power plants. Therefore, TES is a good way for storing these energies for conversion to other useful forms, instead of simply dissipating into the environment.
In addition to storage, proper management of thermal energy, i.e., heat dissipation from high-performance electronic devices, is an important consideration in modern society.3 Good thermal management of mobile phones can reduce damage to the central processing unit (CPU) and the batteries, increase battery life and improve the comfort of use. Since the development of the first mobile phone, it has gradually transformed into a more compact and lighter device. However, the constant developments in information and communications technology make it challenging to cool mobile phones sufficiently, especially in the new 5G (5th generation wireless systems) era. The changes in the cooling requirements of 5G mobile phones mainly come from two aspects, namely an increase in power consumption and changes in mobile-phone structure. In terms of power consumption, the 5G mobile phone possesses a more powerful processor and higher data-processing capability than a 4G phone. As a result, the absolute value of the produced heat increases sharply, which makes it difficult to dissipate heat. Besides, structural changes in mobile phones impose higher requirements on heat-dissipation performance. As the number of 5G antennae increases and the penetration of electromagnetic waves becomes weaker, phone manufacturers are slowly turning toward non-metallic bodies, which require an additional heat-dissipation design. Meanwhile, with the recent progress in chip manufacturing, more compact mobile phones are being designed, which also contributes to difficulties in thermal management. Since latent heat can be stored at a constant temperature in phase-change materials (PCMs), these materials can be used as heat sinks that can absorb heat produced from modern compact electronic devices.
1.2. Classification of TES methods
Based on the applications, TES can be achieved by sensible heat storage (SHS), latent heat storage (LHS), and chemical heat storage (CHS).4Table 1 summarises the principles of heat storage/release, the quantity of the stored energy, storage density, advantages, disadvantages, and requirements of the materials for each method. Briefly, SHS can allow fast charge/discharge by increasing or reducing the temperature of storage materials (eqn (1), Table 1). SHS has heat loss and low volumetric TES density. In contrast, LHS realises high-density TES by absorbing energy at a constant temperature (eqn (2), Table 1) via phase changes of the TES materials, called PCMs. Hence, PCMs are promising for solar TES or as heat sinks for heat dissipation of mobile phones. CHS achieves high-density TES5 by breaking/making chemical bonds to store/release energy (eqn (3) and (4), Table 1).6 Their drawbacks relate to the chemical reactions involved, e.g., MgH2/Mg CHS needs H2 storage and strict reaction conditions (e.g., 50–100 bar).6,7Thermal energy stored in PCMs, Q (J), in a certain temperature range from Ti to Tf comprises sensible heat from the increase in temperature and latent heat from the phase change process (eqn (5)). In a narrow range of temperatures near the melting point (green area, Fig. 2), the TES capacity of PCMs is much higher than that of SHS.
 | (5) |
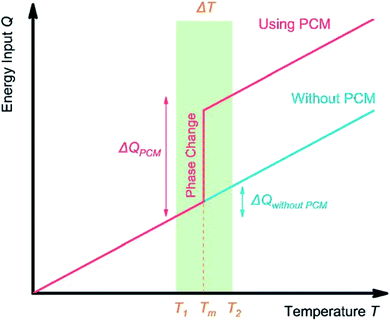 | ||
| Fig. 2 TES process in a solid–liquid PCM. Near the melting point Tm of PCM, the TES system containing PCM has a higher TES capacity compared with a system without PCM. | ||
2. Phase-change materials
2.1. PCM selection criteria
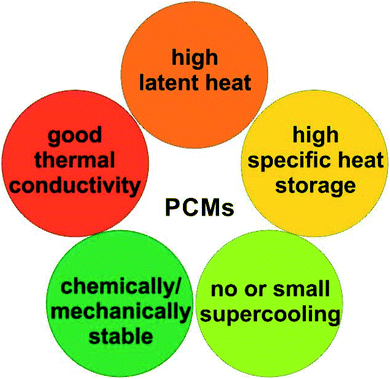
An ideal PCM for TES should possess the desired properties (Fig. 3) to meet the demands of a specific application.8 Below the main requirements are discussed in brief. | (6) |
Meanwhile, PCMs with high specific heat are expected to provide additional SHS in the same temperature range. Importantly, a high thermal conductivity is desired for rapid heat storage and release and reduces the area of the heat-exchange surface.
2.2. Classification of PCMs
PCMs are classified into solid–solid, solid–liquid, liquid–liquid, liquid–gas, and solid–gas PCMs based on the physical state of PCMs before and after phase transition. For TES, liquid–gas and solid–gas PCMs are not preferred as they entail drastic volume changes. Meanwhile, solid–solid PCMs9,10 generally show a small latent heat of phase transition though they exhibit minimal volume changes. Solid–liquid PCMs, hereafter simply referred to as ‘PCMs’, are the most studied and used media for TES. Table 2 lists the main types, examples and properties of solid–liquid PCMs.11–29| Sub-category | Example of materials | T m °C | C p kJ kg−1 K−1 | ρ kg m−3 | λ W m−1 K−1 | ΔHm kJ kg−1 | Ref. | |
|---|---|---|---|---|---|---|---|---|
| a T m: melting point, Cp: specific heat capacity, ρ: density, λ: thermal conductivity, ΔHm: melting enthalpy, “l” and “s” (lower case) are “liquid” and “solid” state, respectively. | ||||||||
| Organics | Paraffin | n-C19H40 | 32 | 2.27l | 785 | 0.213–0.152 | 222 | 11–13 |
| n-C30H62 | 65.4 | 1.30 | 775 | 0.571–0.153 | 252 | 11–14 | ||
| Fatty acid | n-C10H20O2 | 32.0 ± 1.5 | 850 ± 80 | 0.15 | 145 ± 15 | 15 and 16 | ||
| n-C18H36O2 | 68.4 ± 1.5 | 2.830 | 840 ± 80 | 0.30 | 211 ± 21 | 15 and 17 | ||
| Ester | n-C18H35O2CH3 | 37.0 | 1.75 × 10⁻³ | 852 | 160.7 | 18 and 19 | ||
| Polymer | PEG-400 | 5.8 ± 0.8 | 1126 | 0.185 | 84.1 ± 7.7 | 20 and 21 | ||
| PEG-6000 | 62.1 ± 0.6 | 0.187 ± 0.002s | 180.1 ± 4.5 | 21 | ||||
| Inorganics | Salt hydrate | CaCl2·6H2O | 24 | 1.4s | 1470 | 1.09s | 140 | 22 |
| 2.1l | 0.54l | |||||||
| Moten salt | NaNO3 | 309.3 | 1.798–1.812 | NA | 0.514 | 174.13 | 23–25 | |
| Eutectic salt | 53% NaNO3, 40% NaNO2, 7% NaNO3 (wt%) | 142 | 1.40s | 1790 | 0.7 | ∼65–67 | 26 and 27 | |
| 1.56l | ||||||||
| Metal | Ga | 29.8 | 0.37 | 5907 | 29.4l | 80.12 | 28 | |
| Alloy | Bi58Sn42 | 138 | 0.201 | 8560 | 19l | 44.8 | 28 | |
| Sn–Bi–Pb–Zn | 90.78–171.75 | 0.137–0.277 | 7720–10![[thin space (1/6-em)]](https://www.rsc.org/images/entities/char_2009.gif) 110 110 |
9.54–41.76 | 19.59–59.8 | 29 | ||
Salt hydrates are inorganic salts containing crystallised water, such as calcium chloride hexahydrate (CaCl2·6H2O). Their solid–liquid phase-change process is accompanied by salt dehydration and hydration.11,33 However, a major chunk of the currently available salt hydrates undergo incongruent melting, that is, the dehydrated salts cannot dissolve in water at the melting temperature, causing sedimentation and phase separation. Besides, their poor nucleation ability causes supercooling.11,34,35
Molten salts can also function as PCMs for low to high-temperature TES (∼100 to 1000 °C).36 They have a high volume expansion ratio during phase transition, and can corrode metallic containers.38–40 Although salt hydrates and molten salts have low thermal conductivity (below ∼1.0 W m−1 K−1), they possess high TES density, acceptable price, and abundant reserve for being applied in TES.31–33,37–40
Metal and alloy PCMs with high melting temperatures (>300 °C) are usually used as PCMs in high-temperature LHS systems. Metals and alloys that can melt below 300 °C are referred to as low melting-point metals and used for low-temperature PCMs. For TES, their superior thermal conductivity (∼1.0 W m−1 K−1, Table 2) is advantageous, as it eliminates the need for large heat-exchange surfaces. Moreover, metallic PCMs have high density and larger TES volumetric densities than other types of PCMs, good cycling stability41,42 and low volume expansion.
Examples of high-temperature metallic PCMs include binary and ternary alloys containing Al, Cu, Mg, and Zn, such as Al–Si, Al–Si–Mg, Al–Si–Cu, and Al–Mg–Zn alloys. They exhibit the highest enthalpy of fusion at a given volume.42–44 High-temperature metallic PCMs have been proposed for application in solar power-generation systems.45,46 While several low-melting-point metals such as Bi, Ga, Sn, In, Zn, Cd, Te, Sb, Tl, Hg, and Pb, can function as PCMs, Sn, Bi, In, and Ga are often preferred due to their low toxicity and good physical and chemical properties. The physiothermal properties of various low melting-point metals and alloys are listed in Table 3.28,29,47–49
| Metals and alloys | T m °C | T b °C | C p,l kJ kg−1 K−1 | ρ kg m−3 | λ l W m−1 K−1 | ΔHm kJ kg−1 | TES density MJ m−3 | Ref. |
|---|---|---|---|---|---|---|---|---|
| a T m: melting temperature; Tb: boiling temperature; Cp,l: specific heat capacity (in liquid); ρ: density; λl: thermal conductivity (liquid); ΔHm: melting enthalpy. | ||||||||
| Ga73.5In15.4Sn11.1 | 10.6 | 69.03 | 47 | |||||
| Ga78.4In14.9Sn6.7 | 10.9 | 71.2 | 47 | |||||
| Ga83.5In16.5 | 15 | 71.68 | 47 | |||||
| Ga91.6Sn8.4 | 19.8 | 78.29 | 47 | |||||
| Ga95Sn5 | 19.9 | 79.22 | 47 | |||||
| Ga97.9Al2.1 | 26.5 | 82.59 | 47 | |||||
| Cs | 28.7 | 2023.8 | 0.236 | 1796 | 17.4 | 16.4 | 29.45 | 28 |
| Ga | 29.8 | 2204.8 | 0.37 | 5907 | 29.4 | 80.12 | 473.27 | 28 |
| Rb | 38.9 | 685.73 | 0.363 | 1470 | 29.3 | 25.74 | 37.84 | 28 |
| Bi44.7Pb22.6In19.1Sn8.3Cd5.3 | 47 | 0.197 | 9160 | 15 | 36.8 | 337.09 | 28 | |
| Bi35.5In64.5 | 54.1 | 30.82 | 47 | |||||
| Bi49In21Pb18Sn12 | 58 | 0.201 | 9010 | 10 | 28.9 | 260.39 | 28 | |
| Cerrolow | 58 | 90.9 | 48 | |||||
| Bi38.7Sn16.7Pb14.4In30.2 | 58.3 | 28.98 | 47 | |||||
| Bi32In51.2Sn16.8 | 60.8 | 25.4 | 48 | |||||
| Bi–Cd–In eutectic | 61 | 25 | 48 | |||||
| Bi41.8In58.2 | 61.4 | 29.88 | 48 | |||||
| K | 63.2 | 756.5 | 0.78 | 664 | 54 | 59.59 | 39.57 | 28 |
| Bi50Pb26.7Sn13.3Cd10 | 70 | 0.184 | 9580 | 18 | 39.8 | 381.28 | 28 | |
| Cerrobend | 70 | 32.6 | 48 | |||||
| Bi–Pb–In eutectic | 70 | 29 | 48 | |||||
| Bi41.6Sn19.4Pb23.2Cd15.8 | 71.7 | 24.51 | 47 | |||||
| Bi–In eutectic | 72 | 25 | 48 | |||||
| Bi21.8In78.2 | 73.1 | 22.46 | 47 | |||||
| Bi38.5Sn22.2Pb25.3In14 | 75 | 25.36 | 47 | |||||
| Bi40.5Sn28.5Pb16.3In14.7 | 75.7 | 21.71 | 47 | |||||
| Bi53.8In27Sn19.2 | 76.6 | 32.6 | 49 | |||||
| Bi42.5In35.2Sn22.3 | 79.2 | 36.91 | 47 | |||||
| Sn9.5Bi56Pb34.5 | 90.8 | 0.161 | 19.54 | 29 | ||||
| Bi71.2Pb28.8 | 94.9 | 28.99 | 47 | |||||
| Bi52Pb30Sn18 | 96 | 0.167 | 9600 | 24 | 34.7 | 333.12 | 28 | |
| Bi–Pb–Sn eutectic | 96 | 49 | ||||||
| Na | 97.8 | 881.4 | 1.38 | 926.9 | 86.9 | 113.2 | 104.95 | 28 |
| Bi–Pb | 125 | 49 | ||||||
| Bi55Pb43Zn2 | 127 | 0.154 | 20.44 | 29 | ||||
| Sn48Bi50Zn2 | 135 | 0.198 | 47.62 | 29 | ||||
| Bi58Sn42 | 138 | 0.201 | 8560 | 19 | 44.8 | 383.49 | 28 | |
| In | 157 | 2023.8 | 0.23 | 7030 | 36.4 | 28.59 | 200.99 | 28 |
| Sn73.5Pb22Zn4.5 | 172 | 0.247 | 59.8 | 29 | ||||
| Li | 186 | 1342.3 | 4.389 | 515 | 41.3 | 433.8 | 223.4 | 28 |
| Sn91Zn9 | 199 | 0.272 | 7270 | 61 | 32.5 | 236.28 | 28 | |
| Sn | 232 | 2622.8 | 0.221 | 730 | 59.6 | 60.5 | 44.17 | 28 |
| Bi | 271 | 1560 | 0.122 | 979 | 8.1 | 53.3 | 52.18 | 28 |
Sn can be applied in solar power plants for TES. Lai et al. demonstrated enhanced solar-thermal storage by exploiting the latent heat of Sn/SiOx core–shell nanoparticles (NPs) embedded in HITEC salt, a eutectic mixture of 53 wt% KNO3, 40 wt% NaNO2 and 7 wt% NaNO3. The heat capacity of HITEC containing Sn/SiOx was increased by 30% compared to that of HITEC solar salt.50
Low-melting-point metal PCMs can be used in thermal comfort applications. For instance, the melting temperature of Ga is ∼29.8 °C, which is close to room and body temperatures. Its TES volumetric density (∼473.27 MJ m−3) is much larger than that of a paraffin material with a similar phase-change temperature, n-nonadecane (174.27 MJ m−3; 32.0 °C).51 More importantly, Ga exhibits a large thermal conductivity of 29.28 W m−1 K−1 in the liquid state, which enables temperature control. Moreover, it is relatively non-toxic, non-flammable, non-explosive, and shows stable cyclic energy storage and release characteristics with small volume expansion.
Low-melting-point metal PCMs have been investigated for heat dissipation in electronic devices. Ge et al. used Ga to keep a smartphone cool during operation and demonstrated that 3.4 mL of Ga maintains the module at a temperature below 45 °C for 16 min at 2.832 W. This holding time for maintaining operational temperature was longer than that of most conventional organic PCMs.52 Yang et al. developed a finned heat pipe-assisted passive heat sink based on low-melting-point metal PCMs for buffering thermal shock with a heat generation rate of up to 1000 W (10 W cm−2); this resulted in longer operation times (1.4–2.4 times) in high-power electronics when compared to cases in which conventional organic PCMs were used.53
However, there is still much scope for improving metals and alloys as high-performance PCMs for the storage and management of thermal energy. For example, the corrosion of metal PCMs and the sintering of liquid–metal particles may lead to changes in their structure or morphology of PCMs during operation, inhibiting their use in the form of nanofluids or slurries.54,55 Therefore, the encapsulation of metal PCMs in macro-, micro-, or nano-scale vessels should be considered to improve their utility.
3. Micro/nano encapsulation of PCMs
Compared to their bulk counterparts, PCMs in micro- or nano-size exhibit much larger surface areas. For example, as for two samples (same weight and density) of spherical particles with two different diameters: 1 cm and 100 nm, the surface area of the latter sample is 100![[thin space (1/6-em)]](https://www.rsc.org/images/entities/char_2009.gif) 000 times larger than that of the former one. Hence, PCMs of micro- or nano-size particles can allow for faster heat transfer through their large surface area during charge/discharge between PCMs and the matrix. The encapsulation is important to protect the high surface area of micro- or nano-PCMs from sintering. Further, the surface modification of micro/nano-size PCMs is easy to achieve and they can be dispersed in a heat transfer fluid (HTF), which enhances the application potential of PCMs.
000 times larger than that of the former one. Hence, PCMs of micro- or nano-size particles can allow for faster heat transfer through their large surface area during charge/discharge between PCMs and the matrix. The encapsulation is important to protect the high surface area of micro- or nano-PCMs from sintering. Further, the surface modification of micro/nano-size PCMs is easy to achieve and they can be dispersed in a heat transfer fluid (HTF), which enhances the application potential of PCMs.
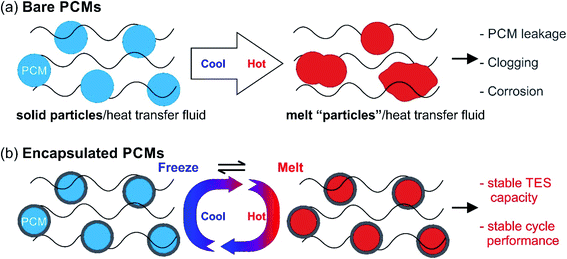
Despite the suitability of PCMs in many thermal applications, the practical use of solid–liquid PCMs is still limited due to several issues. Liquid PCMs might leak during the heat-storage process (Fig. 4a), which decreases their TES capacity and cyclic stability. In particular, when using acids and molten salts as PCMs, corrosion may occur on key parts of the devices or facilities, reducing their service life or even causing safety problems (Fig. 4a).
One solution to these issues is to encapsulate PCMs at the micro- or nano-scale (Fig. 4b). The encapsulated PCMs are called micro-encapsulated PCMs (MEPCMs) or nano-encapsulated PCMs (NEPCMs), depending on PCM dimensions (MEPCMs: 0.1–1000 μm; NEPCMs: 1–100 nm). Encapsulation refers to the process of embedding PCM cores (can be single-core or multi-core) into a shell or layer (protection structure). This shell thus isolates and protects PCM cores from the external environment. By micro/nano encapsulation, PCMs can be transformed into powder or paste form. By using the porous shell structure the volume expansion of PCMs can be no longer an issue. Several reports have been published on the synthesis of MEPCMs and NEPCMs.56–60 The materials used for encapsulation (encapsulant) vary from organics (such as polystyrene, urea formaldehyde, and polymethyl methacrylate) to inorganic materials (such as calcium carbonate, silica, sodium silicate, and metal oxides).61 The typical preparation methods of MEPCMs and NEPCMs are discussed in the rest of this section.62
3.1. Approaches for micro/nano encapsulation of PCMs
The methods available for PCM micro/nano encapsulation can be classified into three main categories, viz. polymerisation methods (sometimes also named as ‘chemical methods’), physico-chemical methods, and physical methods.Emulsion polymerisation. In emulsion polymerisation, one phase containing the monomer is uniformly dispersed in the continuous phase using a surfactant and an emulsifier via mechanical stirring to form an emulsion. The encapsulating shell is then grown on the surface of the PCM core.63,64 The emulsion droplet size is in the range of 1–10 mm and can be further decreased to 20–200 nm by providing higher external energy. Stable isotropic liquids with two or more separated phases in equilibrium are also called microemulsions. Meanwhile, nanoemulsions (droplet size < 100 nm) can be formed by adding a large amount of surfactant to overcome the interfacial energy. While the size of the droplet does not provide a clear distinction between nano- and micro-emulsions, their thermodynamic stability does. Compared to microemulsions, nanoemulsions are thermodynamically unstable.63
Interfacial polymerisation. In interfacial polymerisation, the first reactive monomer in one phase is dispersed in an immiscible phase containing the second monomer. The monomers react at the interface to form a polymeric membrane that encapsulates PCMs.65 Usually, interfacial polymerisation yields MEPCMs.66
In situ polymerisation. In in situ polymerisation, two immiscible phases containing organic intermediates react with each other to yield the encapsulant.67 Unlike in the case of interfacial polymerisation, there are no reactants in the core material during in situ polymerisation and all polymerisation reactions occur in the continuous phase.59 Usually, in situ polymerisation yields particles in the size range of 5–100 μm.67
Coacervation. In the coacervation process, liquid–liquid phase separation (bottom: polymer-rich dense phase; top: transparent solution) is induced in a homogeneous solution of charged macromolecules by the addition of natural salt or alcohol.68–73
Sol–gel encapsulation. The sol–gel method of PCM encapsulation often starts with a suspension of PCM nanoparticles or microparticles in an aqueous solution. The formation of the encapsulating shell (hydrated metal or semi-metal oxide, such as TiO2 and SiO2) is induced by hydrolysing shell precursors to produce soluble hydroxylated monomers, followed by polymerisation and phase separation to form the encapsulating shell (for example, SiO2 and TiO2).74
Self-assembly method. The self-assembly method is sometimes also called as the ‘one-step method’. When this method is used to encapsulate PCMs, system components such as molecules, polymers, colloids, or macroscopic particles are organised into shells or other confinement structures by promoting local interactions among these components, without external direction.75–77
Solvent evaporation. PCM encapsulation by solvent evaporation generally consists of four steps: (1) dissolution of hydrophobic PCM in an organic solvent containing the polymer to be coated, (2) emulsification of the organic phase containing the PCM in a continuous aqueous phase, (3) solvent extraction from the organic phase containing the PCM by evaporation and transforming the droplets into solid PCM particles with polymer encapsulation, and (4) removal of residual solvent.61,78
Supercritical CO2-assisted methods. The easily accessible supercritical conditions of CO2, when CO2 stays as a liquid at or above its critical temperature and pressure, are 73.8 bar and 31.1 °C, which is close to the ambient temperature. Supercritical CO2, which is non-toxic, non-flammable, exhibits gas-like viscosity and liquid-like density, and is readily soluble, can be used as a solvent, antisolvent, solute, drying medium, and foaming agent.66,79
Among three methods for PCM encapsulation, polymerisation can provide uniform coating (in situ polymerisation), which is versatile in particle size and cost effective with good size control for PCMs.66 The method has been applied for organic PCMs, which results in particle size of 1–4000 μm. Physio-chemical method can also allow for good size control (sol–gel encapsulation, coacervation), but it is more suitable for small scale synthesis. The aggregation after coating should be considered. Sol–gel encapsulation is often used for inorganic coating of metal and alloy PCMs. The method can be used for PCMs of nanoscale size (<100 nm) and form uniform shell. The physical method is advantageous in terms of scaling up, simplicity, and low-cost for PCMs.66 The method, however, is not able to produce thin coating layer in nanoscale.
3.2. Micro/nano encapsulation of metals and alloys
A large number of studies have concentrated on the micro- and nano-encapsulation of organic compounds as conventional PCMs. In contrast, there are only a few studies on the micro- or nano-encapsulation of low-melting-point and high-melting-point metals/alloys. This section is devoted to reviewing these studies.Metal oxides such as SiO2 and Al2O3 are among the most commonly used materials for coating PCMs. They are stable against oxidation, exhibit minimal corrosion, and are thermally stable over a large temperature range with relatively good thermal conductivity. There are two main approaches to synthesise encapsulated metal/alloy PCMs: (i) metal particles, which act as the cores, are prepared first, followed by coating with an oxide shell and (ii) reduction of the metal source distributed in the preformed oxide shell/matrix (Fig. 5). The metal cores used in the first approach can be synthesised by different methods and the core size can be tailored to yield different phase-change temperatures and heat capacities in different working environments (Fig. 5a). The dispersibility, reactivity in the solution used for coating (e.g., water, alcohol, other organics, and biphasics), and surface properties of metal cores should be considered when choosing the coating method to ensure a complete coating without oxidation. This is especially important when coating is conducted on active metal nanoparticles, such as Sn and Bi. The hydrolysis of hydroxides in controlled pH conditions or thermal decomposition of hydroxide and/or nitrate is often used to generate oxide shells. Meanwhile, cores can be reduced in the presence of the shell using the second method. Cavities/voids can be expected in the resulting structure, which is beneficial for buffering volume changes and mechanical stress during the phase-change process in metal cores (Fig. 5b). In this case, the size and number of metal–core particles are not only controlled by the synthesis conditions but also by the oxide shell matrix.
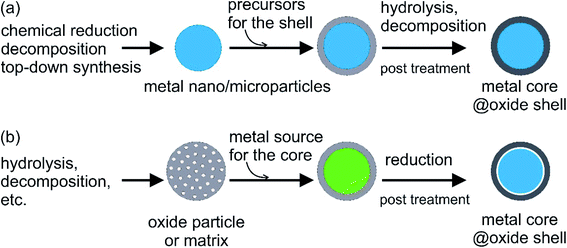 | ||
| Fig. 5 General approaches for oxide encapsulation of metal PCMs: (a) oxide coating on metal core and (b) reduction of metal source in the preformed oxide shell. | ||
Metal oxides or semi-metal oxides. In general, stable metal oxides or semi-metal oxides, such as SiO2, TiO2, and Al2O3, are often used to encapsulate low-melting-point metal nanoparticles and microparticles. Hong et al.83 used an emulsion method to prepare In nanoparticles by boiling commercial In powder in poly-α-olefin (PAO). The In nanoparticles thus produced were collected by centrifugation and encapsulated with silica (SiO2) using a sol–gel method. These SiO2-encapsulated nanoparticles were then suspended in PAO, which enhanced the heat-transfer properties of PAO for high-temperature applications. The SiO2 shell not only prevented the leakage and agglomeration of In in the liquid state, but also enhanced the dielectric properties of In nanoparticles, thus making them suitable for the cooling of electronic devices. The viscosity of PAO-containing SiO2-encapsulated In nanoparticles at 45 °C (9.49 cP) is close to the viscosity of PAO (4.68 cP). Therefore, the heat-transfer coefficient of PAO containing 30 at% In nanoparticles is 1.6 times higher than that of the original PAO.
Cingarapu et al. synthesised Sn nanoparticles (Fig. 6a) using a modified polyol reduction method followed by sol–gel SiO2 encapsulation on the surface (Sn@SiO2) (Fig. 6b).84 The high-resolution TEM image of the encapsulated Sn@SiO2 nanoparticles (Fig. 6c) shows crystalline silica shell with a thick grain boundary between the shell and the Sn core whereas the unencapsulated Sn nanoparticles have an amorphous SnOx layer formed on the surface (Fig. 6d). The SiO2 shell ensures the chemical and structural stability of Sn nanoparticles during melt-freeze cycling (Fig. 6e and f). By dispersing Sn@SiO2 core–shell phase-change nanoparticles (5 vol%) in a synthetic HTF, therminol 66 (TH66), enhanced thermal properties could be achieved. As for the thermal conductivity of the nanofluid, it increased by ∼13%, which agrees with Maxwell's effective medium theory. The volumetric TES of the nanofluid increased by ∼11% by cycling in the temperature range of 100–270 °C. This increase was attributed to the latent heat generated by the melting of Sn cores; this value might be further increased if thermal cycling is conducted in a narrower temperature range. In the range of 25–125 °C, the viscosities of the modified nanofluids and base fluid were quite similar. In addition, no changes were observed in Sn@SiO2 (5 vol%) during 20 heat-cool cycles, indicating the good thermal stability of this system. These experimental results thus illustrate the beneficial effects of Sn nanoparticles on both the thermal conductivity and TES density of base HTFs and highlight their potential for use in CSP systems.
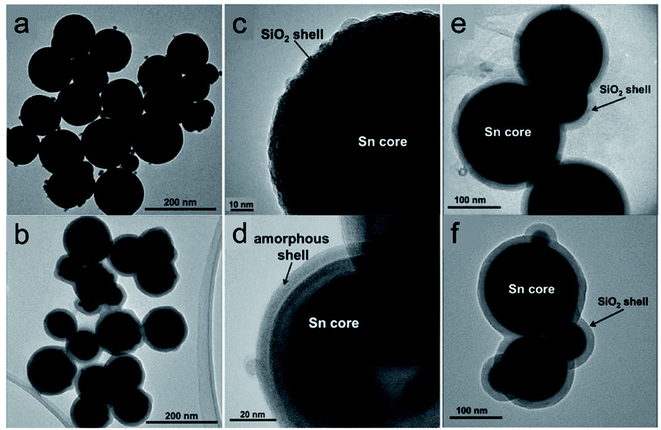 | ||
| Fig. 6 Silica encapsulated Sn nanoparticles (Sn@SiO2) for heat transfer and TES.84 TEM images of (a) as-prepared Sn and (b) Sn@SiO2 nanoparticles; high-resolution TEM images of (c) Sn@SiO2 and (d) Sn nanoparticles. TEM images of encapsulated Sn@SiO2 nanoparticles (e) before and (f) after 20 heating and cooling cycles. Reproduced from ref. 84 with permission from Wiley, USA, Copyright 2013 John Wiley & Sons, Ltd. | ||
Hsu et al. prepared Zn@TiO2, Zn@Al2O3, and Zn@SiO2 core–shell microparticles by hydrolysis (Zn@TiO2 and Zn@SiO2) and thermal decomposition (Zn@Al2O3), as shown in Fig. 7.85 Zn–Sn@SiO2 core–shell microparticles by hydrolysis (for SiO2 coating) and thermal annealing (for Zn–Sn alloying).86 Zn@Al2O3 microparticles were dispersed in HITEC salt,87 which is designed as a HTF in CSP plants.85 The heat capacity of the salt could be enhanced by 6.7% by doping with 10 wt% Zn@Al2O3 microparticles, while its viscosity increased from 1.3 to 3 cP in the temperature range of 350–550 °C.85 The authors defined thermal hysteresis (TH) in phase-change core–shell microparticles as the difference between the melting and crystallisation temperatures and it increased with an increase in shell thickness and heat-ramping rate. A discussion on TH is important because the latent heat of PCMs cannot be released and restored during cycling if the TH is beyond the operating temperature range of a TES system. Moreover, among Zn@TiO2, Zn@Al2O3, and Zn@SiO2, Zn@Al2O3 exhibited the smallest TH owing to the higher thermal conductivity of Al2O3 when compared to TiO2 and SiO2.
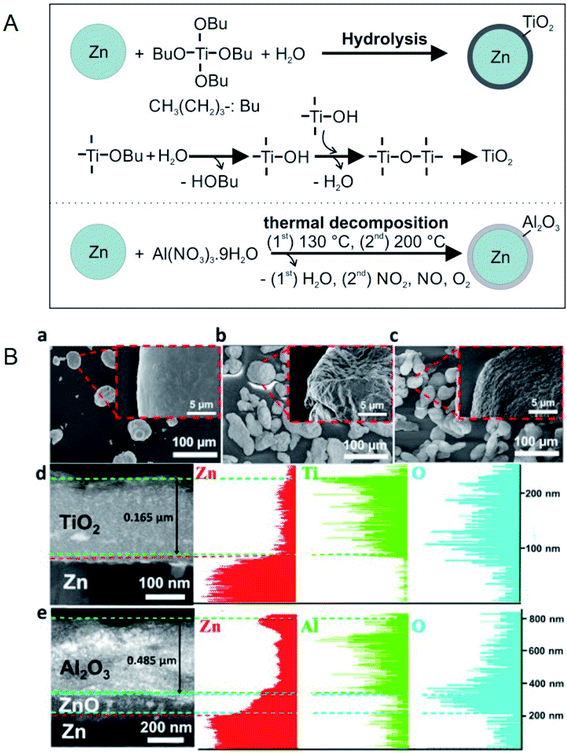 | ||
| Fig. 7 (A) Synthesis method for Zn/TiO2 microparticles and Zn/Al2O3 microparticles. (B) SEM images of (a) pure Zn, (b) Zn/TiO2, and (c) Zn/Al2O3 microparticles. (d and e) TEM cross-sectional images and EDS analysis for Zn/TiO2 and Zn/Al2O3 microparticles, respectively. Reproduced from ref. 85 with permission of Elsevier, Copyright 2018. | ||
Because low-melting-point metal particles, especially nanoparticles, are easily oxidised during synthesis and encapsulation, the direct encapsulation of pre-synthesised microparticles and nanoparticles may cause serious oxidation. Moreover, the synthesis and coating of metal nanoparticles involves complex procedures, which are not suitable for large-scale production. Previously, our group presented an encapsulation strategy, in which formation of oxide shell or other treatments were conducted on oxide shells before the formation of metal microparticles and nanoparticles.88,89 By maintaining the designated form and avoiding the leakage or sintering of Sn-based PCMs at the nano- and micro-level, the isolation/protection of oxide structures effectively enhanced the thermal stability of PCMs in melt-freeze cyclic working conditions. SiO2 (ref. 88) and Al2O3 (ref. 89) were chosen for the stabilisation of low-melting-point metal nano- or micro-PCMs (Fig. 8). Sn nanoparticles encapsulated in porous SiO2 particles, Sn NPs@p-SiO2, were prepared by the hydrogen reduction of SnCl2-absorbed porous SiO2 (p-SiO2) spheres. This resulted in Sn nanoparticles (∼30 nm) uniformly distributed in spherical SiO2 (Fig. 8A). The porous SiO2 matrix effectively prevented the coalescence of Sn nanoparticles and maintained the morphology and melting characteristics of the system with negligible changes during freeze-melt cycling. Size-tunable Sn@Al2O3 PCM particles with a core–shell structure (Fig. 8B) were fabricated using a 3-step method, including hydrothermal synthesis of SnO2 particles, boehmite treatment and air calcination, and hydrogen reduction. The as-obtained Sn@Al2O3 showed a core–shell structure; metallic Sn core located at the centre was covered with an Al2O3 shell with small Sn nanoparticles distributed inside. These Sn@Al2O3 particles exhibited a high PCM content (92.37 wt%) and showed stable thermal behaviour and morphology during 100 melt-freeze cycles in air. Our results showed that both the SnO2 matrix and Al2O3 shell effectively enhanced the thermal storage stability of Sn-based PCMs, which is indicative of their excellent potential in applications involving high temperatures (where organic PCMs are not suitable).
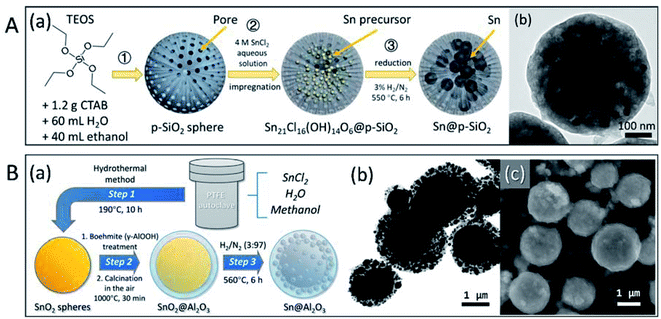 | ||
| Fig. 8 Micro and nano encapsulated Sn-based PCM particles. (A) Sn NPs@p-SiO2: (a) 3-step synthesis method, (b) TEM image; (B) size-tunable Sn@Al2O3: (a) 3-step synthesis method, (b) TEM and (c) SEM images of Sn@Al2O3. Reproduced from ref. 88 and 89 with permission of The American Chemical Society, Copyright 2018 and 2019, respectively. | ||
Self-encapsulation. To protect low-melting-point metal PCMs, self-encapsulation is another approach that may be employed. Navarrete et al. used Sn@SnOx nanoparticles as self-encapsulated NEPCMs using the oxide shell that is formed on these entities when they are exposed to air (Fig. 9).90 When Sn@SnOx was dispersed in commercial thermal oil (Therminol 66) to form nanofluids, the thermal conductivity and heat capacity of the base fluid increased. This was possible due to the high thermal conductivity of Sn and the latent heat generated by the melting of Sn nanoparticles. The thermal stability of Sn@SnOx in both powder and nanofluid forms was verified by melt-freeze cyclic tests. Meanwhile, non-eutectic metal alloy (Sn/Pb) nanoparticles, in which solid and liquid phases coexisted during heating, exhibited heterogeneous crystallisation, which reduced their tendency to undergo supercooling when compared to completely melted nanoparticles.
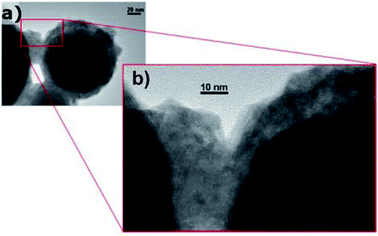 | ||
| Fig. 9 TEM images of self-encapsulated Sn@SnO2 particles. Reproduced from ref. 90. Published by Springer Nature. Copyright 2017. | ||
Polymers. Polymer shells can also be applied for the microencapsulation of low-melting-point metals and alloys. Blaiszik et al. prepared a liquid metal alloy of Ga–In microencapsulated in urea-formaldehyde (UF) by in situ polymerisation.91 The obtained microcapsules exhibited a 73 nm-thick shell and an ellipsoidal shape with major and minor diameter aspect ratios ranging from 1.64 to 1.08 (major diameters in the range of 3–245 μm). The major and minor diameters decreased with an increase in the agitation rate (stirring speed) of the reaction mixture containing liquid metals, monomers, and copolymer, and the aspect ratio decreased to 1.08 with further increase in the shear rate.
Carbon encapsulation. Owing to their superior thermal conductivity, carbon materials are good candidates for encapsulating low-melting-point metals and alloys. Zhong et al. submerged graphite foams in a melted Wood's alloy (eutectic alloy of 50% Bi, 26.7% Pb, 13.3% Sn, and 10% Cd by weight)92 to form graphite foam/Wood's alloy composites (Fig. 10).93 The resultant composites exhibited a thermal conductivity (193.74 W m−1 K−1) twice as high as that of the alloy and graphite foam. In addition, the composite exhibited a significantly reduced thermal expansion coefficient (7.82 ppm K−1) when compared to the alloy (24.81 ppm K−1) (Fig. 10); however, there were no significant changes in latent heat. In addition, the composites exhibited enhanced mechanical properties (with the alloy in both solid and liquid phases) when compared to graphite foam.93 The researchers also impregnated compressed expanded natural graphite (CENG) with Wood's alloy; the thermal conductivity of the resultant composites was 2.8–5.8 times higher than that of Wood's alloy (58.88 W m−1 K−1). The latent heat of these composites (29.27–34.20 J g−1) makes them suitable for heat management in electronic devices.94
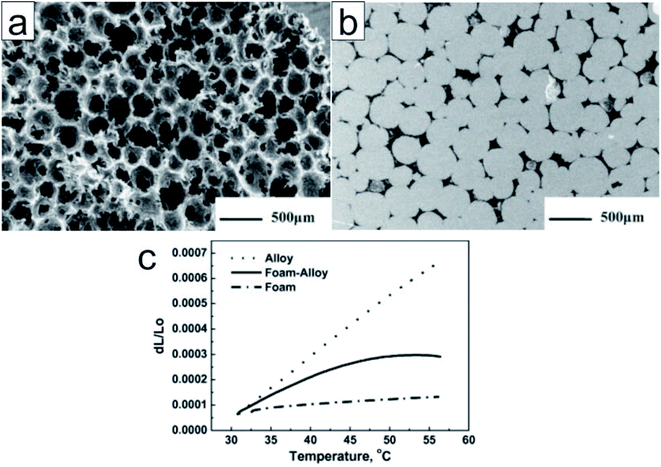 | ||
| Fig. 10 SEM image of (a) the unfilled graphite foam (b) the polished surface of the alloy filled graphite foam. (c) Thermal expansion of the Wood's alloy, graphite foam, and graphite foam/Wood's alloy composite. Reproduced from ref. 93 with permission of Elsevier, Copyright 2010. | ||
Tran et al. synthesised composites in which ligand-free metal nanoparticles (Bi or Pb) were distributed in a mesoporous carbon matrix to design form-stable PCMs (Fig. 11).95 The embedded metal nanoparticles helped in controlling the melting temperature of these composites (this was achieved by changing the size of the metal nanoparticles by tuning the amount of metal loaded inside the composites). A decrease in the melting temperature of both Bi and Pb nanoparticles in the composite materials compared to their bulk counterparts was observed. During 18 melt–freeze cycles, the phase-change temperature of the composites was found to be stable. Carbon, when used as an encapsulating material for metal nanoparticles, prevented the aggregation of metal nanoparticles, accommodated volume changes, and prevented leakage of liquid-state PCMs. In addition, porous channels in the carbon matrix served as containers for melted Pb nanoparticles.
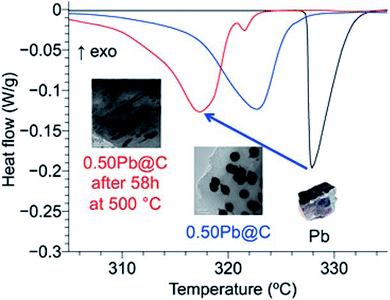 | ||
| Fig. 11 Pb nanoparticle–carbon matrix composites with tunable melting temperature as PCMs for TES. Reproduced from ref. 95 with permission of The American Chemical Society, Copyright 2018. | ||
After micro/nano encapsulation of low-melting-point metal PCMs, oxide shell thickness of tens to hundreds of nanometer has been observed.83–86,88–90 The observation of the surface of the core suggests that oxidation of the core occurred slightly during and possibly after the encapsulation.83–86,88–90 The decrease of melting enthalpy of the encapsulated PCMs over melt-freeze cycle in the air to a certain extent indicates additional oxidation occurred, especially, when the core size is below 100 nm,88 and the shell is not dense enough.88,89 Thicker and denser shells with bigger core sizes show less oxidation (or not report and better cycle performance (LHS)).84–86,89 Meanwhile, coating with oxide is advantageous for the cycle test in air. Having the metal PCMs in a carbon matrix, which has good thermal conductivity, allows for attaining encapsulated PCMs with high thermal conductivity.76 However, the method is reported for a core size of several hundreds of micron and it may be challenging for nano encapsulation. The summary of the particle size and thermos-physical properties of the encapsulated metal PCMs is given in Table 4. It can be seen that majority of the PCMs and encapsulating shells in the nanoscale are for low-melting-point metal PCMs. Studies for using the nano encapsulated PCMs in heat dissipation, TES or HTFs are expected to evaluate the performance of the metal PCMs for practical applications.
| Encapsulated metal PCMs | d core | t shell | T m °C | T c °C | λ W m−1 K−1 | ΔHm kJ kg−1 | Cycle number | Ref. |
|---|---|---|---|---|---|---|---|---|
| a d core: diameter of the core; tshell: thickness of the shell; *diameter of the shell; Tm: melting temperature; Tc: freezing temperature; Cp,l: specific heat capacity; λl: thermal conductivity (liquid); ΔHm: melting enthalpy. Italic value for ΔHm is for ΔHm after cycle test. | ||||||||
| In@SiO2 (68.8 wt% In) 30%/HTF-PAO | 165–90 nm | 10–80 nm | 155.3 | 135 | 19.6 | 100 | 83 | |
| Sn@SiO2 (68.8 wt% In) 5%/HTF-therminol 66 | 50–100 nm | 5 nm | 228.3 | 98.3 | 48 | 20 | 84 | |
| 232 | ||||||||
| Zn@TiO2 | 45.6 μm | 160 nm | ∼100 | 40 | 85 | |||
| Zn@Al2O3 1–20 wt%/HITEC salt | 45.6 μm | 450 nm | ∼97 | 40 | 85 | |||
| +0.68–+13.6% | ||||||||
| SnxZn1−x@SiO2 5%/HITEC salt | 57.7 μm | 278–429 | 67.41–96.09 | 86 | ||||
| Sn@SiO2 | 30 nm | 400 nm* | 229.1 | 8.46 | 100 | 88 | ||
| 6.62 | ||||||||
| Sn@Al2O3 (92.37 wt% Sn) | 1–2 μm | 100–700 nm | 229.1 | 130.5; 142.7; 160.9 | 54.49 | 100 | 89 | |
| Sn@SnO2 | 103 nm | 10 nm | 225.5 | 106.6 | 90 | |||
| 184 nm | 10 nm | 232.1 | 139.1 | |||||
| Eutectic Sn–Pb@SnO2 5%/HTF-therminol 66 | 184.14–284.48 | 175.64–173.76 (1st peak) | 27.48–44.62 | 90 | ||||
| In–Ga@urea-formaldehyde | 245–3 μm | 91 | ||||||
| 50Bi/27Pb/13Sn/10Cd@graphite foam | 193.74 | 29.20 | 93 | |||||
| 50Bi/27Pb/13Sn/10Cd@compressed expanded natural graphite | λ X 164–344 | 29.27–34.20 | 94 | |||||
| λ Y 56–93 | ||||||||
| Bi@C (0.25/1–2/1 w/w) | 84–16 nm | 265.4–238.8 | 5.04–16.90 | 18 | 95 | |||
| Pb@C (0.5/1–1/1 w/w) | 105–31 nm | 322.8–310.1 | 5.67–2.42 | 95 | ||||
Al–Cu (56.6![[thin space (1/6-em)]](https://www.rsc.org/images/entities/char_2009.gif) : :![[thin space (1/6-em)]](https://www.rsc.org/images/entities/char_2009.gif) 43.4 w/w)@Al2O3 (53 43.4 w/w)@Al2O3 (53![[thin space (1/6-em)]](https://www.rsc.org/images/entities/char_2009.gif) : :![[thin space (1/6-em)]](https://www.rsc.org/images/entities/char_2009.gif) 47 w/w) 0.5–10% NPs/(NaNO3–KNO3 60/40 w/w) 47 w/w) 0.5–10% NPs/(NaNO3–KNO3 60/40 w/w) |
85 nm | 6–8 nm | 546.74 | 540.95 | 0.480–0.335, 300 °C | ∼146–161 | 150 | 96 |
| ∼9–11 (10% NPs) | ||||||||
Al–Si@α-Al2O3 (45![[thin space (1/6-em)]](https://www.rsc.org/images/entities/char_2009.gif) : :![[thin space (1/6-em)]](https://www.rsc.org/images/entities/char_2009.gif) 30 30![[thin space (1/6-em)]](https://www.rsc.org/images/entities/char_2009.gif) : :![[thin space (1/6-em)]](https://www.rsc.org/images/entities/char_2009.gif) 25 w/w) 25 w/w) |
40.7 μm | 2.2 μm | 573 | 247 | 10 | 58 | ||
| 573 | 245 | |||||||
| Al-25 wt% Si@Al2O3 | 36.3 μm | 1 μm | 579 | 530 | 233 | 300 | 41 | |
| 578 | 251 | |||||||
| Al-30 wt% Si@Al2O3 | 44 μm | 578 | 241 | 100 | 97 | |||
| Al-20 wt% Si@Al2O3 | 29 μm | 578 | 237 | |||||
| Al-17 wt% Si@Al2O3 | 29 μm | 578 | 272 | |||||
| Al-12 wt% Si@Al2O3 | 37 μm | 579 | 298 | |||||
| Al–25Si@Al2O3 | 577 μm | 6.9 μm (grain size) | 183 | 3000 | 98 | |||
| Al@α-Al2O3 | 36 μm | 661–660 | 273–301 | 100 | 99 | |||
| Al-12 wt% Si@Al2O3 | 100 μm | 575.02 | 307.21 | 100 | ||||
| Al-12 wt% Si@Al2O3 | 100 μm | ∼570–580 | 303.21 | 20 | 101 | |||
| 271.90 | ||||||||
| Al–Si@Al2O3 | 416.92–307.21 | 102 | ||||||
| Al@Al2O3 (60–68 wt% core) | 23.1 μm | 1.4 μm | 663.5 | 601.3–566.4 | 289–312 | 50 | 103 | |
| Al@Al2O3–C | 20–50 μm | 660.3 | 638.6 | 8 | 266 | 20 | 104 | |
| Al-25 wt% Si@Al2O3@Cu | 36 μm | 570 | 99.42, 570 °C | 100 | 105 | |||
| 518 | 25, 570 °C | |||||||
| 41, 518 °C | ||||||||
Metal-oxide nanoencapsulation. Navarrete et al. encapsulated commercial Al–Cu alloy nanoparticles in an Al2O3 layer that is formed naturally when the nanoparticles are exposed to oxygen.96 The encapsulated Al–Cu nanoparticles were added to the so-called solar salt (60 wt% NaNO3 and 40 wt% KNO3) to form nanofluids with improved TES performance. Thermal cycling analysis showed that the Al–Cu NEPCMs were chemically compatible with the solar salt and the oxide shell allowed for cycling up to 570 °C. Although the specific heat that contributes to SHS decreased with an increase in solids content, latent heat contributed by the enthalpy of fusion of Al–Cu NEPCMs increased the total TES to 17.8% within the same volume. Moreover, Al–Cu NEPCM incorporation increased the thermal conductivity of the nanofluids, which improved the heat-transfer performance of the solar salt-based HTF.
Metal-oxide microencapsulation. Nomura et al. first developed Al–Si alloy microsphere MEPCMs covered by α-Al2O3 shells (Fig. 12A and B) through a two-step procedure.58 In the first step, boehmite treatment was conducted to form an AlOOH shell on Al-25 wt% Si alloy microparticles. This was followed by heat-oxidation treatment of the resulting particles in an O2 atmosphere to transform the AlOOH shell into a more stable α-Al2O3 shell.58 The spherical Al-25 wt% Si microparticles (36.3 μm in diameter), which were used as raw materials, were produced by spinning-disk atomisation. This Al–Si-based MEPCM exhibited phase change at 573 °C with a latent heat of 247 J g−1 (Fig. 12C). In addition, melt-freeze testing for 10 cycles in air illustrated the protective effect of the encapsulating layer (Fig. 12D). In another study, Nomura et al. reported that in Al–Si alloy MEPCMs, voids inside the alloy core allowed for volume expansion of the PCMs during solid–liquid phase transition.41 In addition, the MEPCM exhibited excellent durability for up to 300 heating–cooling cycles in an O2 atmosphere and hence can be used in next-generation LHS-based high-temperature TES and transportation systems.
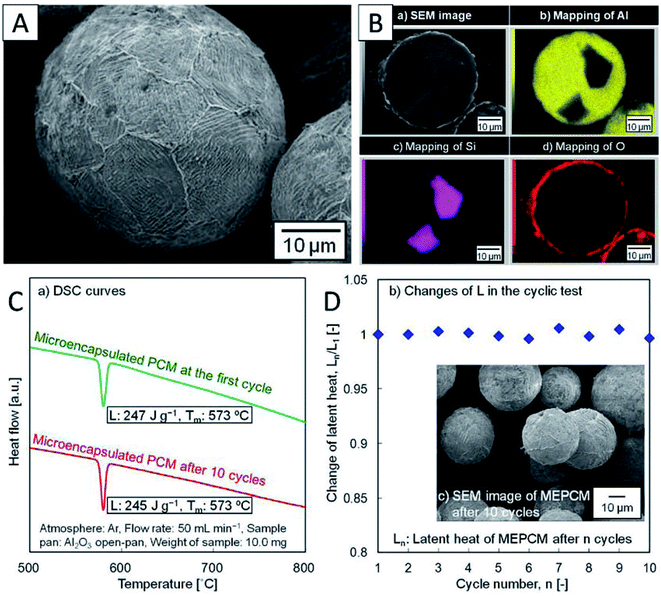 | ||
| Fig. 12 (A) SEM and (B) cross-section EDS elemental mapping images of Al–Si MEPCM. (C) DSC curves and (D) the changes in the latent heat of MEPCM during melt-freeze cyclic test in air. The inset is SEM of MEPCM after 10 melt-freeze cycles. Reproduced from ref. 58. Published by Springer Nature. Copyright 2015. | ||
Furthermore, to understand the impact of Si content in the Si–Al alloy cores of the MEPCMs on their thermal storage properties, Nomura et al. examined MEPCMs with four different Al–Si compositions (Al-12 wt% Si, Al-17 wt% Si, Al-20 wt% Si, and Al-30 wt% Si).97 Their results revealed that the TES capacity of the MEPCMs increased and the heat-oxidation temperature decreased with a decrease in Si content near the eutectic composition. This is because when the alloy composition is different from the eutectic composition, the fraction of eutectic phase/primary Si solid in the MEPCM depends on Si content and a greater proportion of the primary Si phase reduces heat capacity. In addition, larger supercooling was observed in samples with higher Si content.
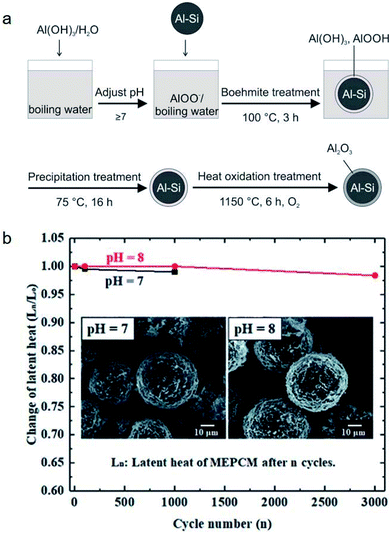
It was found that leakage from MEPCMs occurred after 300 melt-freeze cycles owing to the non-compact, non-uniform, and cracked Al2O3 shells.41,58,97 To improve the shell stability of MEPCMs in high-temperature conditions, Nomura et al. developed Al–Si alloy MEPCM microspheres with high-temperature stability and good cycling durability using a 3-step method (Fig. 13a) consisting of (1) boehmite treatment of Al–Si microparticles at pH 8, (2) additional Al(OH)3 precipitation on the surface of Al–Si microparticles, and (3) heat oxidation in an O2 atmosphere. The newly formed boehmite and precipitation pre-treatment resulted in the formation of a thick and compact Al2O3 shell containing small α-Al2O3 and θ-Al2O3 grains. This resulted in good durability of Al–Si alloy MEPCMs over 3000 melt-freeze cycles in the air (Fig. 13b) by dispersing thermal stresses at high temperatures and restraining crack propagation in the Al2O3 shell.98
 | ||
| Fig. 13 (a) Preparation of Al–Si/Al2O3 core/shell MEPCM particles. (b) Evolution of latent heat of MEPCMs for 3000 melting–solidification cycles. Inset shows the SEM images of the MEPCMs after 1000 melting–solidification cycles. Reproduced from ref. 98 with permission of The Royal Society of Chemistry, Copyright 2018. | ||
Apart from Al–Si-based NEPCMs, Nomura et al. also studied only Al (Tm = 660 °C) as the PCM to prepare core–shell MEPCMs composed of a stable α-Al2O3 shell and an Al core using the same two-step method as that used for Al–Si alloy MEPCMs. The heat-storage capacity of the Al MEPCMs decreased (273–301 J g−1) while the repetition durability improved with an increase in heat-oxidation temperature.99
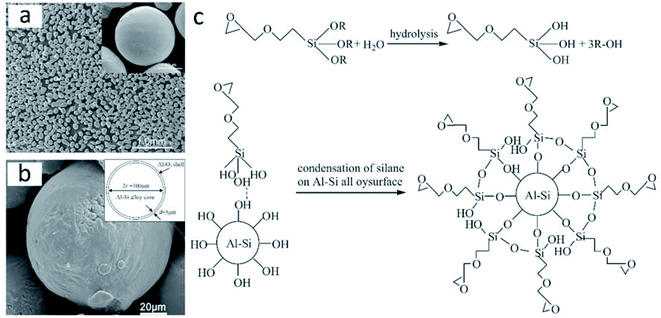
Using a sol–gel process based on the modification of a silane coupling agent (SCA), He et al. prepared Al–Si/Al2O3 core–shell microparticles with a dense α-Al2O3 shell (3–5 μm thickness; Fig. 14a).100 Commercial Al–Si eutectic alloy microparticles were washed with ethanol, followed by surface modification with SCA, and finally, treated with alumina sols. The obtained Al–Si/Al2O3 core–shell microparticles exhibited a latent heat of 307.21 kJ kg−1. SCA on the surface of Al–Si alloy microparticles played a key role in microencapsulation by promoting the condensation reaction between boehmite sols and silanol groups (Fig. 14b) to yield a dense Al2O3 shell. Fig. 14c shows the mechanism of the silane coupling agent treatment to Al–Si alloy. The researchers also studied the structural and phase-change characteristics of Al–Si/Al2O3 core–shell systems during melt-freeze cycling from room temperature to 1000 °C.101 The latent heat of the Al–Si/Al2O3 core–shell microparticles reduced to 271.90 kJ kg−1 after 20 melt-freeze cycles. The ruptured structure obtained at the end of the cycling period was attributed to the mismatch in the thermal stresses of the core and shell; it has been suggested that the presence of cracks at the core–shell interface can release thermal stresses during cycling and thus preserve the core–shell structure.
 | ||
| Fig. 14 Inorganic microencapsulated core–shell structure of Al–Si alloy microparticles with silane coupling agent. SEM images of Al–Si alloy microparticles (a) after surface modification and (b) after surface modification and heating at 400 °C. The inset figure in (b) shows the sketch of Al–Si/Al2O3 core/shell particles. (c) Reaction mechanism of the coating process. Reproduced from ref. 100 with permission of Elsevier, Copyright 2014. | ||
He et al. compared two methods for the synthesis of inorganic microencapsulated core–shell Al–Si alloy microparticles using the sol–gel process. These are (1) a pre-oxidation process and (2) modification of the original Al–Si alloy microparticles with an SCA.102 They found that both methods could be used for microencapsulation and resulted in a stable and dense α-Al2O3 shell. The pre-oxidation process usually generated a nonuniform shell, while modification with SCA resulted in more uniform microencapsulation. Moreover, according to zeta-potential measurements, both methods change the surface electric behaviour of Al–Si alloy microparticles; modification with SCA was more likely to result in the absorption of alumina sols on the surfaces, thus rendering thicker and more uniform Al2O3 shells.
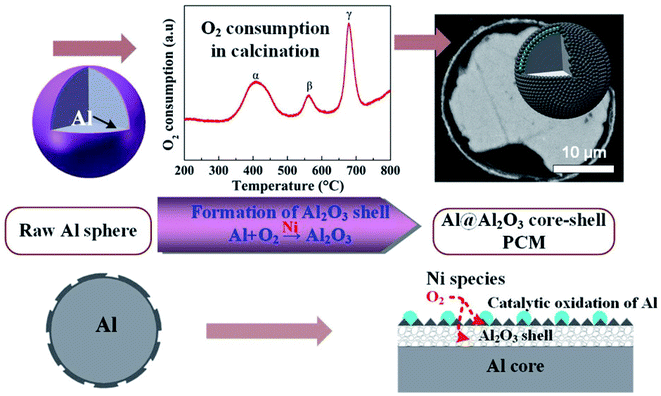
Li et al. reported the microencapsulation of Al microspheres via an induced oxidation method.103 Nano-Ni species loaded on the surfaces of Al microspheres acted as catalysts to accelerate the oxidation of surface Al layer in air. Compared to unmodified Al, the oxidation activation energy (149–156 kJ mol−1) of nano-Ni-modified Al was much lower. By monitoring oxygen consumption and exothermic changes during the oxidation process, the researchers found that a 3-step oxidation of surface Al resulted in a layered Al2O3 shell (Fig. 15). Along with voids in the core, the layered Al2O3 shell helped in improving the elasticity of the core–shell structure, thus enhancing the thermal stability of the system during melt-freeze cycling.
 | ||
| Fig. 15 Synthesis of Al@Al2O3 microcapsule for high-temperature TES.103 Reproduced from ref. 103 with permission of The American Chemical Society, Copyright 2018. | ||
Carbon may be used for surface modification to increase the thermal conductivity of metal-oxide encapsulated metal PCMs. Tian et al. used an in situ methane-decomposition method to deposit carbon on Al@Al2O3 microspheres.104 This method improved both the thermal conductivity and thermal stability of PCM particles.
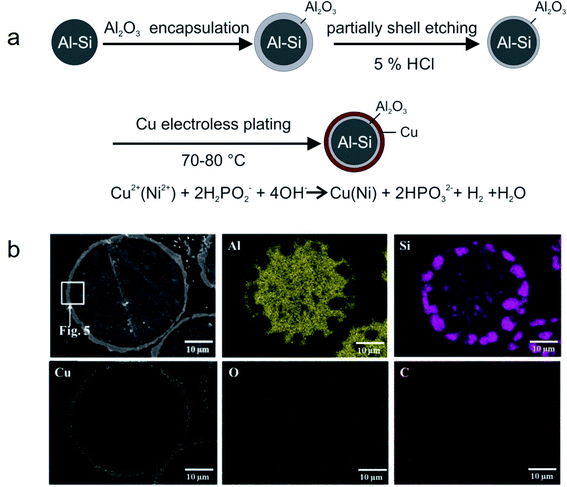
Metal microencapsulation. Owing to their good ductility, high thermal conductivity, and high melting temperature, some metals are good candidates as encapsulation materials for high-melting-point metal/alloy PCMs. Nomura and co-workers synthesised MEPCMs with spherical Al-25 wt% Si cores (average diameter of 36 μm) and Al2O3@Cu double-layered shells, as shown in Fig. 16a.105 The Al-25 wt% Si microparticles covered with Al2O3 shell were prepared by boehmite treatment followed by heating at 500 °C. Subsequently, HCl was used to etch the Al2O3-covered microparticles and electroless plating of a Cu layer was carried out to form multi-layered MEPCMs (Fig. 16b). The core–shell Al-25 wt% Si@Al2O3@Cu particles exhibited a low breakage ratio of ∼1.7% after 100 melt-freeze cycles.
 | ||
| Fig. 16 (a) Synthesis method to obtain Al-25 wt% Si@Al2O3@Cu MEPCMs for high temperature TES. (b) EDS elemental mapping on the cross-section of the resulting MEPCMs. Reproduced from ref. 105 with permission of Elsevier, Copyright 2019. | ||
Overall, Al2O3 and SiO2 are the most studied shell materials for encapsulation of the high-melting-point metal and alloy PCMs.96–105 Thermal annealing is often required to obtain dense and crystalline shells, which are desired for cycle stability. The core PCM particle for high-temperature PCMs is mostly in the micrometre scale.96–105 For high-melting-point metallic PCMs, a high value of LHS can be compromised for high cycle stability (oxidation of the core, shell thickness, shell materials).98,105 Further, there is still open room for nano encapsulation of high-melting-point metal and alloy PCMs.
3.3. Other applications of encapsulated metal and alloy PCMs
Aside from applications in TES, the encapsulated metal and alloy PCMs have been utilised for catalysis, sensing and barcoding.106–112 Li et al. proposed an idea of using the latent heat of the core PCMs to manage the catalytic reaction of the catalysts on the surface of PCMs.106 The encapsulated metal PCM coupled catalyst (SiAl@Al2O3 PCM/Co3O4 catalyst) has been proved to allow for the conversion of methane after turning off the heat source for a long time (Fig. 17a).107 The methane conversion efficiency on PCM/catalyst was enhanced compared to Co3O4 itself. This is a promising direction for heat waste recovery and applications.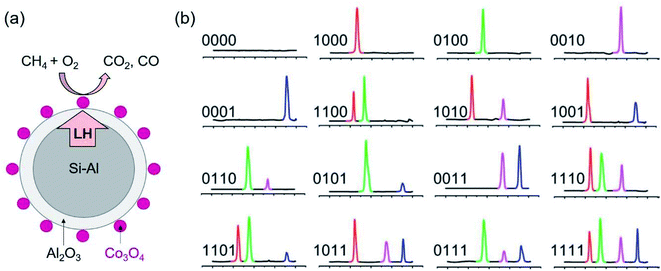 | ||
| Fig. 17 (a) Co3O4 deposited on the surface of Si–Al@Al2O3 PCM. The latent heat of PCM supplies to the catalytic reaction to burn methane on Co3O4 catalyst. (b) DSC curve of thermal barcodes.111 The scale (left to right) is from 100 to 300 °C. The presence of melting peaks of In, Pb–Sn, Sn and Bi at 156, 183, 232, 271 °C is used for barcoding. Reproduced from ref. 111 with permission of the American Institute of Physics, Copyright 2009. | ||
Su and co-workers reported low-melting-point metal and alloy PCMs (Sn, In, Pb, etc.) coated with SiO2 for biomarker detection.108–110 In this application, the PCMs were captured by biomarkers of different concentrations and types. The melting enthalpy of the PCMs-biomarker was found highly sensitive to the concentration of a biomarker in a large concentration range.110 The method allows for quantitative analysis of the biomarker concentration. Further, Su and co-workers could detect multiple DNA biomarkers with high sensitivity.108–110
Also utilising the latent heat of SiO2 encapsulated metal and alloy PCMs of different phase change temperatures, Su and co-workers demonstrated the capability of barcoding.111 At each melting temperature (peak of melting) the measured latent heat is written as 1 if the heat flux is detectable and otherwise as 0. In this way, they proved the concept of coding using thermal properties of a mixture of PCMs of different metals or alloys with distinct melting points. Mixtures of 4 types of nanoparticle PCMs, that is, SiO2 encapsulated In, Pb–Sn, Sn and Bi PCMs with the peak melting of 156, 183, 232, 271 °C, respectively, are used for barcoding. This allows for 16 combinations, thus, 16 barcodes (Fig. 17b). Other emerging applications of PCMs have also been reviewed.112
4. Conclusions and prospective outlook
High-density TES using PCMs is required in many industrial applications such as waste-heat recovery and in the harvesting of solar thermal energy. In addition, PCMs enable target-oriented discharging and control over the thermal sink temperature by enabling a constant phase-change temperature. Metals and alloys are considered as promising PCMs owing to their high thermal conductivity and volumetric heat-storage density. Moreover, micro- and nano-sized PCMs can be easily transformed into various forms, such as powders, pastes, slurries, and nanofluids. In this article, we reviewed recent research on micro- and nano-encapsulated metal PCMs for TES and highlighted the development of encapsulation approaches for metal and alloy PCMs with low and high melting points at micro- and nano-scales to achieve excellent thermal properties.Most of the studies on the micro- and nano-encapsulation of metal and alloy PCMs are focused on preventing changes in PCM structure and protecting them from external environments. In addition, single-layer or single-shell encapsulation has been extensively studied. With the development of modern material chemistry, novel encapsulation structures, such as multi-shell structures and yolk–shell structures, can be finely designed for PCMs to achieve structural stability and high thermal storage performance. This aspect of micro- and nano-encapsulated metal PCMs is poorly explored, but offers great potential for new applications of these materials in thermal energy utilisation. One example is using structurally designed micro- or nano-encapsulated PCMs, which can not only deliver temperature maintenance but also provide venues for catalytic reactions.
Author contributions
SZ composed the initial draft with consultation with MTN and TY. MTN and TY drew illustration and data presentation. MTN and TY revised the draft and completed the manuscript. All authors reviewed the manuscript. TY conducted overall management.Conflicts of interest
There is no conflict of interest to declare.References
- I. E. Agency, Key World Energy Statistics, 2018, p. 14 Search PubMed.
- L. D. Trusel, S. B. Das, M. B. Osman, M. J. Evans, B. E. Smith, X. Fettweis, J. R. McConnell, B. P. Y. Noël and M. R. van den Broeke, Nature, 2018, 564, 104–108 Search PubMed.
- S. Sharma, A. Tahir, K. S. Reddy and T. K. Mallick, Sol. Energy Mater. Sol. Cells, 2016, 149, 29–39 Search PubMed.
- L. F. Cabeza, Advances in thermal energy storage systems: methods and applications, Woodhead Publishing, Elsevier, 2014 Search PubMed.
- T. Yan, R. Z. Wang, T. X. Li, L. W. Wang and I. T. Fred, Renewable Sustainable Energy Rev., 2015, 43, 13–31 Search PubMed.
- B. Bogdanović, A. Ritter, B. Spliethoff and K. Straβburger, Int. J. Hydrogen Energy, 1995, 20, 811–822 Search PubMed.
- P. Pardo, A. Deydier, Z. Anxionnaz-Minvielle, S. Rougé, M. Cabassud and P. Cognet, Renewable Sustainable Energy Rev., 2014, 32, 591–610 Search PubMed.
- G. Wei, G. Wang, C. Xu, X. Ju, L. Xing, X. Du and Y. Yang, Renewable Sustainable Energy Rev., 2018, 81, 1771–1786 Search PubMed.
- D. Chandra, R. Chellappa and W.-M. Chien, J. Phys. Chem. Solids, 2005, 66, 235–240 Search PubMed.
- Q. Cao and P. Liu, Eur. Polym. J., 2006, 42, 2931–2939 Search PubMed.
- K. Pielichowska and K. Pielichowski, Prog. Mater. Sci., 2014, 65, 67–123 Search PubMed.
- C. Vélez, J. M. O. de Zárate and M. Khayet, Int. J. Therm. Sci., 2015, 94, 139–146 Search PubMed.
- F. P. Fleming, L. d. A. Silva, G. d. S. V. Lima, I. Herzog, H. R. B. Orlande, J.-L. Daridon, J. Pauly and L. F. A. Azevedo, Fluid Phase Equilib., 2018, 477, 78–86 Search PubMed.
- G. W. H. Höhne, Polym. Bull., 1981, 6, 41–46 Search PubMed.
- S. Kahwaji, M. B. Johnson, A. C. Kheirabadi, D. Groulx and M. A. White, Sol. Energy Mater. Sol. Cells, 2017, 167, 109–120 Search PubMed.
- P. Liu, X. Gu, L. Bian, X. Cheng, L. Peng and H. He, ACS Omega, 2019, 4, 2964–2972 Search PubMed.
- A. Karaipekli, A. Sarı and K. Kaygusuz, Renewable Energy, 2007, 32, 2201–2210 Search PubMed.
- M. W. Babich, S. W. Hwang and R. D. Mounts, Thermochim. Acta, 1992, 210, 77–82 Search PubMed.
- R. M. Saeed, J. P. Schlegel, C. Castano, R. Sawafta and V. Kuturu, J. Energy Storage, 2017, 13, 418–424 Search PubMed.
- M. A. Marcos, D. Cabaleiro, S. Hamze, L. Fedele, S. Bobbo, P. Estellé and L. Lugo, Nanomaterials, 2020, 10, 19 Search PubMed.
- R. Paberit, E. Rilby, J. Göhl, J. Swenson, Z. Refaa, P. Johansson and H. Jansson, ACS Appl. Energy Mater., 2020, 3, 10578–10589 Search PubMed.
- V. V. Tyagi and D. Buddhi, Sol. Energy Mater. Sol. Cells, 2008, 92, 891–899 Search PubMed.
- Y. Xiong, Z. Wang, P. Xu, C. Hongbing and Y. Wu, Energy Procedia, 2019, 158, 5551–5556 Search PubMed.
- R. Tufeu, J. P. Petitet, L. Denielou and B. Le Neindre, Int. J. Thermophys., 1985, 6, 315–330 Search PubMed.
- Q.-G. Zhao, C.-X. Hu, S.-J. Liu, H. Guo and Y.-T. Wu, Energy Procedia, 2017, 143, 774–779 Search PubMed.
- X. Xiao and D. Wen, 2018 7th International Conference on Renewable Energy Research and Applications (ICRERA), Paris, France, 2018, pp. 1445–1449 Search PubMed.
- M. S. Sohal, M. A. Ebner, P. Sabharwall and P. Sharpe, Engineering Database of Liquid Salt Thermophysical and Thermochemical Properties, 2013-03-01 Search PubMed.
- H. Ge, H. Li, S. Mei and J. Liu, Renewable Sustainable Energy Rev., 2013, 21, 331–346 Search PubMed.
- Q.-M. Wang, X.-M. Cheng, Y.-Y. Li, G.-M. Yu and Z. Liu, Rare Met., 2019, 38, 350–358 Search PubMed.
- M. M. Kenisarin, J. Sol. Energy, 2014, 107, 553–575 Search PubMed.
- F. Kleiner, K. Posern and A. Osburg, Appl. Therm. Eng., 2017, 113, 1189–1193 Search PubMed.
- N. Xie, Z. Huang, Z. Luo, X. Gao, Y. Fang and Z. Zhang, Appl. Sci., 2017, 7, 1317 Search PubMed.
- M. Kenisarin and K. Mahkamov, Sol. Energy Mater. Sol. Cells, 2016, 145, 255–286 Search PubMed.
- K. Nagano, T. Mochida, S. Takeda, R. Domański and M. Rebow, Appl. Therm. Eng., 2003, 23, 229–241 Search PubMed.
- L. F. Cabeza, G. Svensson, S. Hiebler and H. Mehling, Appl. Therm. Eng., 2003, 23, 1697–1704 Search PubMed.
- M. M. Kenisarin, Renewable Sustainable Energy Rev., 2010, 14, 955–970 Search PubMed.
- Q. Peng, X. Yang, J. Ding, X. Wei and J. Yang, Appl. Energy, 2013, 112, 682–689 Search PubMed.
- Y. Nagasaka and A. Nagashima, Int. J. Thermophys., 1991, 12, 769–781 Search PubMed.
- R. Santini, L. Tadrist, J. Pantaloni and P. Cerisier, Int. J. Heat Mass Transfer, 1984, 27, 623–626 Search PubMed.
- T. Nomura and T. Akiyama, Int. J. Energy Res., 2017, 41, 240–251 Search PubMed.
- T. Nomura, N. Sheng, C. Zhu, G. Saito, D. Hanzaki, T. Hiraki and T. Akiyama, Appl. Energy, 2017, 188, 9–18 Search PubMed.
- J. Q. Sun, R. Y. Zhang, Z. P. Liu and G. H. Lu, Energy Convers. Manage., 2007, 48, 619–624 Search PubMed.
- R. Fukahori, T. Nomura, C. Zhu, N. Sheng, N. Okinaka and T. Akiyama, Appl. Energy, 2016, 163, 1–8 Search PubMed.
- Z. G. Huang, G. Z. Wu, S. L. Xiao and S. H. Mei, Cast Met., 1989, 2, 203–206 Search PubMed.
- N. Maruoka and T. Akiyama, Energy, 2006, 31, 1632–1642 Search PubMed.
- X. Wang, J. Liu, Y. Zhang, H. Di and Y. Jiang, Energy Convers. Manage., 2006, 47, 2211–2222 Search PubMed.
- A. Pan, J. Wang and X. Zhang, Rare Met. Mater. Eng., 2016, 45, 874–880 Search PubMed.
- W. Su, J. Darkwa and G. Kokogiannakis, Renewable Sustainable Energy Rev., 2015, 48, 373–391 Search PubMed.
- I. Manasijević, L. Balanović, T. H. Grgurić, D. Minić and M. Gorgievski, Mater. Res., 2018, 21, e20180501 Search PubMed.
- C.-C. Lai, W.-C. Chang, W.-L. Hu, Z. M. Wang, M.-C. Lu and Y.-L. Chueh, Nanoscale, 2014, 6, 4555–4559 Search PubMed.
- J. Paris, M. Falardeau and C. Villeneuve, Energy Sources, 1993, 15, 85–93 Search PubMed.
- H. S. Ge and J. Liu, J. Heat Transfer, 2013, 135, 054503 Search PubMed.
- X.-H. Yang, S.-C. Tan, Z.-Z. He and J. Liu, Energy Convers. Manage., 2018, 160, 467–476 Search PubMed.
- J. Q. Sun, R. Y. Zhang, Z. P. Liu and G. H. Lu, Energy Convers. Manage., 2007, 48, 619–624 Search PubMed.
- A. Ghadimi, R. Saidur and H. S. C. Metselaar, Int. J. Heat Mass Transfer, 2011, 54, 4051–4068 Search PubMed.
- M. N. A. Hawlader, M. S. Uddin and M. M. Khin, Appl. Energy, 2003, 74, 195–202 Search PubMed.
- Z. Qiu, X. Ma, P. Li, X. Zhao and A. Wright, Renewable Sustainable Energy Rev., 2017, 77, 246–262 Search PubMed.
- T. Nomura, C. Zhu, N. Sheng, G. Saito and T. Akiyama, Sci. Rep., 2015, 5, 9117 Search PubMed.
- W. Aftab, X. Huang, W. Wu, Z. Liang, A. Mahmood and R. Zou, Energy Environ. Sci., 2018, 11, 1392–1424 Search PubMed.
- E. M. Shchukina, M. Graham, Z. Zheng and D. G. Shchukin, Chem. Soc. Rev., 2018, 47, 4156–4175 Search PubMed.
- A. Hassan, M. S. Laghari and Y. Rashid, Sustainability, 2016, 8, 1046 Search PubMed.
- Y. Wang, Z. Liu, X. Niu and X. Ling, Energy Fuels, 2019, 33, 1631–1636 Search PubMed.
- D. J. McClements, Soft Matter, 2012, 8, 1719–1729 Search PubMed.
- L. Weinstock, R. A. Sanguramath and M. S. Silverstein, Polym. Chem., 2019, 10, 1498–1507 Search PubMed.
- C. Perignon, G. Ongmayeb, R. Neufeld, Y. Frere and D. Poncelet, J. Microencapsulation, 2015, 32, 1–15 Search PubMed.
- J. Giro-Paloma, M. Martínez, L. F. Cabeza and A. I. Fernández, Renewable Sustainable Energy Rev., 2016, 53, 1059–1075 Search PubMed.
- C. Y. Zhao and G. H. Zhang, Renewable Sustainable Energy Rev., 2011, 15, 3813–3832 Search PubMed.
- S. Sawant and R. Shegokar, in Nanobiomaterials in Hard Tissue Engineering, ed. A. M. Grumezescu, William Andrew Publishing, 2016, ch. 5, pp. 155–187 Search PubMed.
- S. S. Deveci and G. Basal, Colloid Polym. Sci., 2009, 287, 1455–1467 Search PubMed.
- S. Demirbağ and S. A. Aksoy, Fibers Polym., 2016, 17, 408–417 Search PubMed.
- M. Malekipirbazari, S. M. Sadrameli, F. Dorkoosh and H. Sharifi, Int. J. Energy Res., 2014, 38, 1492–1500 Search PubMed.
- Y. Konuklu, M. Unal and H. O. Paksoy, Sol. Energy Mater. Sol. Cells, 2014, 120, 536–542 Search PubMed.
- E. Onder, N. Sarier and E. Cimen, Thermochim. Acta, 2008, 467, 63–72 Search PubMed.
- C. J. Brinker and G. W. Scherer, in Sol-Gel Science, ed. C. J. Brinker and G. W. Scherer, Academic Press, San Diego, 1990, ch. 1, pp. xvi-18 Search PubMed.
- L. Geng, S. Wang, T. Wang and R. Luo, Energy Fuels, 2016, 30, 6153–6160 Search PubMed.
- M. Varga, in Fabrication and Self-Assembly of Nanobiomaterials, ed. A. M. Grumezescu, William Andrew Publishing, 2016, ch. 3, pp. 57–90 Search PubMed.
- A. R. Akhiani, M. Mehrali, S. T. Latibari, M. Mehrali, T. M. I. Mahlia, E. Sadeghinezhad and H. S. C. Metselaar, J. Phys. Chem. C, 2015, 119, 22787–22796 Search PubMed.
- M. Li, O. Rouaud and D. Poncelet, Int. J. Pharm., 2008, 363, 26–39 Search PubMed.
- S. H. Soh and L. Y. Lee, Pharmaceutics, 2019, 11, 21 Search PubMed.
- A. Gharsallaoui, G. Roudaut, O. Chambin, A. Voilley and R. Saurel, Food Res. Int., 2007, 40, 1107–1121 Search PubMed.
- J.-Y. Kim, S.-H. An, Y.-S. Rhee, C.-W. Park and E.-S. Park, Drying Technol., 2014, 32, 935–945 Search PubMed.
- S. De, M. Pritchett, M. K. Mazumder, C. U. Yurteri and O. Egorov, Part. Sci. Technol., 2002, 20, 169–185 Search PubMed.
- Y. Hong, S. Ding, W. Wu, J. Hu, A. A. Voevodin, L. Gschwender, E. Snyder, L. Chow and M. Su, ACS Appl. Mater. Interfaces, 2010, 2, 1685–1691 Search PubMed.
- S. Cingarapu, D. Singh, E. V. Timofeeva and M. R. Moravek, Int. J. Energy Res., 2014, 38, 51–59 Search PubMed.
- T.-H. Hsu, C.-H. Chung, F.-J. Chung, C.-C. Chang, M.-C. Lu and Y.-L. Chueh, Nano Energy, 2018, 51, 563–570 Search PubMed.
- C.-C. Lai, S.-M. Lin, Y.-D. Chu, C.-C. Chang, Y.-L. Chueh and M.-C. Lu, Nano Energy, 2016, 25, 218–224 Search PubMed.
- A. G. Fernández, H. Galleguillos, E. Fuentealba and F. J. Pérez, J. Therm. Anal. Calorim., 2015, 122, 3–9 Search PubMed.
- S. Zhu, M. T. Nguyen, K. Fumoto, K. Kanie, A. Muramatsu and T. Yonezawa, ACS Appl. Nano Mater., 2018, 1, 4073–4082 Search PubMed.
- S. Zhu, M. T. Nguyen, T. Tokunaga and T. Yonezawa, ACS Appl. Nano Mater., 2019, 2, 3752–3760 Search PubMed.
- N. Navarrete, A. Gimeno-Furio, R. Mondragon, L. Hernandez, L. Cabedo, E. Cordoncillo and J. E. Julia, Sci. Rep., 2017, 7, 17580 Search PubMed.
- B. J. Blaiszik, A. R. Jones, N. R. Sottos and S. R. White, J. Microencapsulation, 2014, 31, 350–354 Search PubMed.
- G. W. Milne, Gardner's commercially important chemicals: synonyms, trade names, and properties, John Wiley & Sons, 2005 Search PubMed.
- Y. Zhong, Q. Guo, S. Li, J. Shi and L. Liu, Carbon, 2010, 48, 1689–1692 Search PubMed.
- Y. Zhong, Q. Guo, L. Li, X. Wang, J. Song, K. Xiao and F. Huang, Sol. Energy Mater. Sol. Cells, 2012, 100, 263–267 Search PubMed.
- N. Tran, W. Zhao, F. Carlson, J. H. Davidson and A. Stein, ACS Appl. Nano Mater., 2018, 1, 1894–1903 Search PubMed.
- N. Navarrete, R. Mondragón, D. Wen, M. E. Navarro, Y. Ding and J. E. Juliá, Energy, 2019, 167, 912–920 Search PubMed.
- T. Nomura, J. Yoolerd, N. Sheng, H. Sakai, Y. Hasegawa, M. Haga, G. Saito and T. Akiyama, Sol. Energy Mater. Sol. Cells, 2018, 187, 255–262 Search PubMed.
- N. Sheng, C. Zhu, G. Saito, T. Hiraki, M. Haka, Y. Hasegawa, H. Sakai, T. Akiyama and T. Nomura, J. Mater. Chem. A, 2018, 6, 18143–18153 Search PubMed.
- T. Nomura, J. Yoolerd, N. Sheng, H. Sakai, Y. Hasegawa, M. Haga and T. Akiyama, Sol. Energy Mater. Sol. Cells, 2019, 193, 281–286 Search PubMed.
- F. He, S. Chao, X. He and M. Li, Ceram. Int., 2014, 40, 6865–6874 Search PubMed.
- F. He, G. Song, X. He, C. Sui and M. Li, Ceram. Int., 2015, 41, 10689–10696 Search PubMed.
- F. He, C. Sui, X. He and M. Li, J. Sol-Gel Sci. Technol., 2015, 76, 1–10 Search PubMed.
- K. Z. Li, Z. Gu, X. Zhu, Y. Wei and H. Wang, ACS Sustainable Chem. Eng., 2018, 6, 13226–13236 Search PubMed.
- M. Tian, K. Li, X. Zhu, Y. Wei, Y. Zheng, L. Zhang, Y. Long and H. Wang, Sol. Energy Mater. Sol. Cells, 2019, 200, 109924 Search PubMed.
- N. Sheng, C. Y. Zhu, H. Sakai, T. Akiyama and T. Nomura, Sol. Energy Mater. Sol. Cells, 2019, 191, 141–147 Search PubMed.
- K. Li, X. Cheng, N. Li, X. Zhu, Y. Wei, K. Zhai and H. Wang, J. Mater. Chem. A, 2017, 5, 24232–24246 Search PubMed.
- D. Li, R. Xu, M. Tian, Y. Jia, Z. Gu, X. Zhu and K. Li, Appl. Therm. Eng., 2020, 181, 116012 Search PubMed.
- C. Wang, L. Ma, L.-M. Chen, K. X. Chai and M. Su, Anal. Chem., 2010, 82, 1838–1843 Search PubMed.
- L. Ma, Y. Hong, Z. Ma, C. Kaittanis, J. M. Perez and M. Su, Appl. Phys. Lett., 2009, 95, 043701 Search PubMed.
- C. Wang, Z. Sun, L. Ma and M. Su, Anal. Chem., 2011, 83, 2215–2219 Search PubMed.
- Z. Ma, Y. Hong, M. Zhang and M. Su, Appl. Phys. Lett., 2009, 95, 233101 Search PubMed.
- D. C. Hyun, N. S. Levinson, U. Jeong and Y. Xia, Angew. Chem., Int. Ed., 2014, 53, 3780–3795 Search PubMed.
| This journal is © The Royal Society of Chemistry 2021 |


