 Open Access Article
Mie theory and the dichroic effect for spherical gold nanoparticles: an experimental approach†
Emma G.
Wrigglesworth
 *ab and
James H.
Johnston
 ab
ab
aSchool of Chemical and Physical Sciences, Victoria University of Wellington, Wellington 6140, New Zealand. E-mail: emma.wrigglesworth@vuw.ac.nz
bNZ Product Accelerator, The University of Auckland, Auckland 1142, New Zealand
First published on 13th May 2021
Abstract
The attractive optical properties of metallic nanoparticles include the optically interesting but surprisingly not well understood dichroic effect, defined in this research as when particle colloids display different colours in transmitted and reflected light. Here we use a systematic experimental approach supplemented by theoretical Mie theory analysis to study the origin of this effect. The CloudSpec spectrophotometer has been utilised to produce quantitative scattering and absorption spectra for monodisperse spherical gold nanoparticles, allowing precise links to be made between the optical spectra and the colours observed. The source of the dichroic effect has been conclusively linked to particle size with no special particle shapes or size distributions required. These results experimentally demonstrate the relationship between particle size and the ratio of scattering to absorption predicted by Mie theory, which has important implications for users of Mie theory calculations.
Introduction
For centuries gold nanoparticles have been well-known and often utilised for their optical properties. Deviating from their 17th century use to provide red shades to glass for decorative purposes,1,2 today gold nanoparticle colour is regularly employed in valuable sensing and imaging applications.3,4 This colour arises from localised surface plasmon resonance (LSPR) effects; incoming light induces a displacement of the particle's negatively charged free conduction electrons away from the positively charged core, and this net charge difference acts as a restoring force resulting in oscillation of the electron cloud.5,6 When the frequency of the electromagnetic radiation is resonant with the electron oscillation then the light absorption and/or scattering at this energy is greatly enhanced, dictating the colour that the nanoparticles display.The interaction between light and spherical nanoparticles that undergo LSPR can be described using Mie theory. With input parameters of nanoparticle size, the dielectric function of the metal, and the dielectric function of the medium, Mie theory can be used to calculate the extinction cross section of a particle and effectively describe its theoretical colour. Mie theory calculations are also regularly used to determine the theoretical absorption and scattering cross sections, the sum of which is equal to the total extinction. A highly referenced report by El-Sayed and co-workers has solved Mie theory calculations to compute the theoretical ratio of scattering to absorption for spherical gold nanoparticles of three different sizes, and shown that this ratio increased with increasing particle size.7 Knowledge of the relative magnitude of scattering compared to absorption is critical to many gold nanoparticle applications. For example, particles that strongly absorb are required for photothermal therapies,8–13 as well as for types of cell and tissue imaging including photoacoustic imaging,14–18 whereas those that scatter strongly are useful in biological imaging such as optical coherence tomography.19–22 A thorough understanding of the relative contributions of absorption and scattering for specific particles can indicate their usefulness in particular applications.
The ability of gold nanoparticles to both scatter and absorb light results in the observation in of the dichroic effect for some particle systems. The most famous example of this effect is the 4th century Lycurgus cup, currently on display in the British Museum, which appears red in transmitted light but green in reflected light.23 The glass of the cup has been found to contain alloyed nanoparticles 50–100 nm in diameter, with a composition of 66.2 ± 2.5 at% silver, 31.2 ± 1.5 at% gold, and 2.6 ± 0.3 at% copper, which effectively absorb and scatter light to produce the effect. However due to the small number of particles able to be examined, and the precious nature of the cup precluding any further study, the exact nature between the size, shape, and composition of the particles and the observation of the two different colours is still poorly understood. Although the dichroic effect in gold nanoparticles has been observed and described a number of times,24–32 explanations for the source of the effect have ranged from the presence of specific unique particle shapes (e.g. elliptical24,25,29 and hexagonal30), to bimodal size distributions,26,29 to the presence of large scattering particles.29 The exact nature of the origin of the dichroic effect has not before been comprehensively demonstrated.
Typically, when information on the magnitude of absorption and scattering is required for spherical nanoparticles it is estimated using Mie theory calculations. Experimental analysis is possible but is much rarer due to its complexity. For example, techniques utilising photoacoustic imaging,33 darkfield microscopy,34,35 integrating sphere technology,36–38 and others,39,40 have been developed to measure absorption and scattering spectra of nanoparticle systems. Despite the significant and valuable information obtained with these techniques, they have not yet achieved widespread use. Therefore, lacking from the area of metallic nanoparticle optical research is a fundamental and systematic experimental investigation of the relationship between nanoparticle size and the relative contributions of absorption and scattering to the total extinction, linked to the colours displayed by the particles.
In the presented work we have utilised the CloudSpec spectrophotometer41 to accurately measure the quantitative absorption and scattering spectra of synthesised spherical gold nanoparticles of different sizes. The spectrophotometer, which utilises integrating sphere technology, is simple to use and provides immediate results with trivial sample preparation. This has allowed links to be made between the obtained spectra and the colours displayed by dichroic samples in transmitted and reflected light, systematically demonstrating the origin of the dichroic effect for these samples. An experimental relationship between particle size and the ratio of scattering to absorption has further been developed. The excellent comparison of these results to the theoretical relationship produced with Mie theory has provided confidence in both the use of the CloudSpec spectrophotometer to obtain scattering and absorption information about experimental systems, and equally in the use of theory to estimate this information when measurement is not possible. This work effectively acts as a fundamental experimental proof of this aspect of Mie theory.
Experimental
Materials
Hydrogen tetrachloroaurate trihydrate (HAuCl4·3H2O), trisodium citrate dihydrate (TSC), sodium borohydride (NaBH4), polyvinylpyrrolidone (PVP) (average mol weight 40![[thin space (1/6-em)]](https://www.rsc.org/images/entities/char_2009.gif) 000), and L-ascorbic acid were all purchased from Sigma-Aldrich. Potassium iodide (KI) was purchased from Pure Science. All chemicals were used as received without further purification. Distilled water was produced in-house using a laboratory water distiller and was used throughout.
000), and L-ascorbic acid were all purchased from Sigma-Aldrich. Potassium iodide (KI) was purchased from Pure Science. All chemicals were used as received without further purification. Distilled water was produced in-house using a laboratory water distiller and was used throughout.
Synthesis of spherical gold nanoparticles
Spherical gold nanoparticles were synthesised using a reported seed-mediated methodology with few changes.42 All glassware was cleaned prior to synthesis using aqua regia.First a gold seed solution was prepared. Solutions of HAuCl4 (20 μL, 0.25 M) and TSC (1 mL, 5 mM) were added to 18.98 mL of distilled water at room temperature. With vigorous stirring, a freshly prepared NaBH4 solution (600 μL, 0.1 M) was then added. An immediate colour change to red/brown was observed. The seed solution was allowed to stir at room temperature for a further five hours. Seed synthesis resulted in a red/brown coloured solution of particles with an average diameter of 6 ± 3 nm (determined using TEM and DLS analysis, Fig. S1†).
In a typical synthesis, solutions of PVP (500 μL, 5 wt%), L-ascorbic acid (250 μL, 0.1 M), and potassium iodide (200 μL, 0.2 M) were added to 2 mL of distilled water. The resulting solution was set stirring vigorously at room temperature before adding a HAuCl4 solution (60 μL, 0.25 M) followed immediately by a volume of the seed solution (200, 20, 5, 2.5, or 1.5 μL for samples A, B, C, D, and E respectively). A colour change was observed within one minute and the colour grew darker over the next five minutes. The colloid was allowed to stir for 10 minutes following the seed addition. Particles were then immediately centrifuged and re-dispersed in water via sonication.
Characterisation
Extinction spectra were measured using a Shimadzu UV-2600 spectrophotometer. A JEOL 2010 transmission electron microscope (TEM), operated at 200 kV, was used to visualise the particles. Colloids were drop cast onto 200 mesh copper grids and plasma treated with a JEOL EC-52000IC ion cleaner prior to TEM analysis. A Zetasizer Nano ZS instrument was used for dynamic light scattering (DLS) measurements.Extinction and absorption spectra were measured simultaneously using the CloudSpec-UV spectrophotometer (version v-0.8), developed by Marama Labs (New Zealand).41 The use of CloudSpec to measure extinction and absorption spectra of nanoparticle solutions is described elsewhere.38,43 Briefly, the CloudSpec employs two optical pathways to collect both the extinction and the absorption spectrum of the sample. The instrument measures the sample in a standard extinction (transmission) mode and an absorption mode respectively, against a suitable solvent blank. The absorption mode uses an integrating sphere to remove any contribution of scattering from the measurement. The transmission then depends non-linearly on the absorption coefficient of the sample.44 The CloudSpec utilises a proprietary calibration algorithm to transform the measured absorbance in the integrating sphere mode to an absorbance normalised to a path length of 1 cm. Both extinction and absorption are then given in units of cm−1, allowing the scattering spectrum to be calculated by taking the difference between extinction and absorbance. The validity of the CloudSpec calibration has been investigated in previous studies.38
Mie theory simulations
The program Mieplot (v4.6.13, Philip Laven)45 was used to simulate the extinction, scattering, and absorption cross sections of spherical gold nanoparticles embedded in water at 20 °C. The refractive index of gold (Johnson and Christy)46 and water (The International Association for the Properties of Water and Steam)47 were applied. For disperse particle calculations, the mean particle diameter, standard deviation, and type of distribution function, were obtained via TEM analysis and used as input parameters.Results and discussion
Particle size and morphology
To confidently make connections between particle features and the observed optical properties, it was necessary to obtain well characterised and highly monodisperse particles of only one morphology. Five gold nanoparticle colloids containing spherical particles of different sizes (samples A to E) were synthesised using a methodology based off a previously reported seed-based synthesis.42 TEM analysis has shown that the particles increased in size from sample A to E, with direct size analysis of more than 500 individual particles per sample giving average diameters of 32 ± 3, 53 ± 4, 81 ± 6, 94 ± 9, and 127 ± 10 nm for samples A, B, C, D, and E respectively (Fig. 1). The particle size distributions were normal (as confirmed via normal probability plots with the condition R2 > 0.9), and narrow with coefficient of variation values of less than 10% for all samples. DLS has provided bulk data to complement the TEM results, showing a consistent increase in hydrodynamic diameter for samples A to E (Fig. S2†). It should be noted that the average hydrodynamic diameter values were larger than the average diameters obtained from TEM analysis (Table S1†), due to the adsorption of large PVP molecules on the surface of the nanoparticles. TEM data have also confirmed the spherical/quasi-spherical morphology of the particles, with no other shapes observed via microscopy.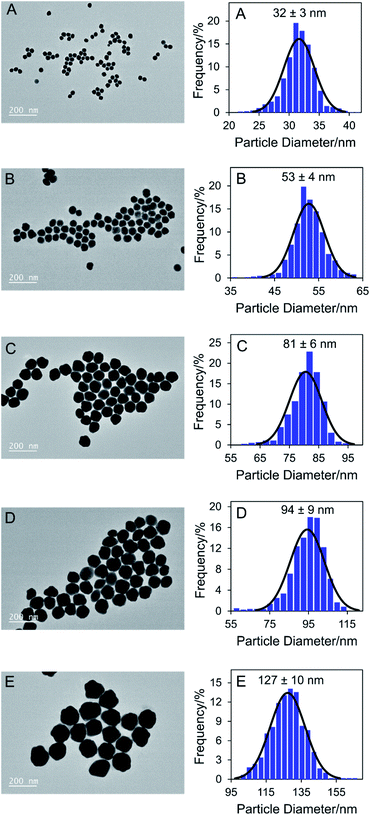 | ||
| Fig. 1 Representative TEM micrographs (left) and corresponding histograms (right) showing size and morphology of synthesised gold nanoparticle samples A to E. | ||
Optical characterisation
Gold nanoparticle colloid sample A appeared pink in colour in transmitted light, and as the particle size increased (from sample A to E) the colour changed from pink to purple to blue (Fig. 2(a)). The measured extinction spectra were consistent with these colour changes (Fig. 2(b)). Sample A, containing 32 nm diameter nanoparticles, gave a narrow peak with a λmax of 528 nm which corresponds to green light. Consumption of green light has rendered the sample the complementary colour, i.e. red/violet or pink. As the particle size increased (sample A to E), the extinction spectrum peak has red-shifted and broadened significantly to that for sample E (average particle diameter 127 nm) (λmax = 612 nm corresponding to orange light and therefore consistent with the complementary blue colour displayed). The peak in the extinction spectrum of sample E was also not symmetrical but possessed a small shoulder at approximately 535 nm which has been attributed to the quadrupole resonance that appears for large particles.48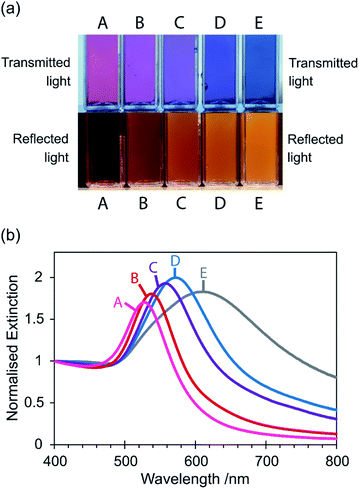 | ||
| Fig. 2 (a) Photograph showing colours of synthesised gold nanoparticle colloid samples A to E in transmitted light (samples observed under daylight) and reflected light (samples held against a dark background, illuminated by fluorescent lighting). Also see Movie S1.† (b) Extinction spectra of synthesised gold nanoparticle colloid samples A to E, normalised at 400 nm to facilitate comparison. | ||
This dependence of the LSPR peak and the resulting colour on the size of the particles was first proposed for gold nanoparticles in 1857, and then shown systematically in 1954, in seminal works by Faraday and Turkevich respectively.49,50 Since then it has been observed and reported countless times and has become a fundamental nanoparticle study often taught to students.48 Interestingly, the colour observed in reflected light has been reported on considerably less. Fig. 2(a) shows that an orange/brown colour appeared in reflected light at a certain nanoparticle size and then increased in intensity with increasing size. We believe this visible phenomenon is well known amongst gold nanoparticle chemists and it can often be seen in photographs included in articles, however it is very rarely explicitly commented on. This change in colour between transmitted and reflected light, also shown in Movie S1,† is an example of the dichroic effect made famous by the 4th century Lycurgus cup. In this report we demonstrate that this colour can be directly explained by the scattering of light by the particles, which increases with increasing particle size.
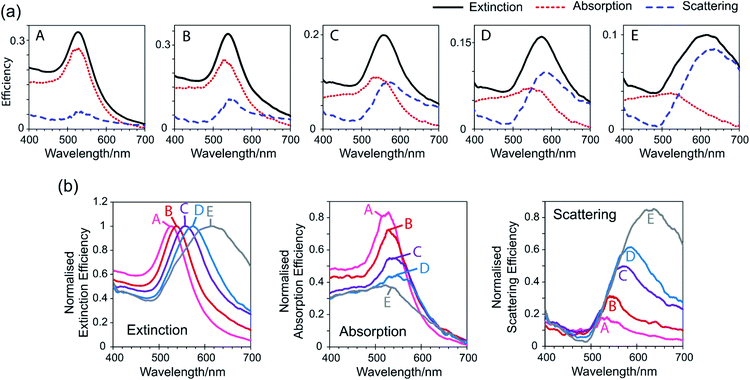
The extinction spectra shown in Fig. 2(b) are often referred to as absorption spectra, however what is actually being measured is the sum of both absorption and scattering. Therefore an extinction spectrum is only equivalent to an absorption spectrum for small particles where scattering is negligible. For larger particles, the CloudSpec spectrophotometer quantitatively measures the absorption spectrum of a solution, which when combined with the extinction spectrum (measured simultaneously) allows the calculation of the scattering spectrum. In this work this instrument has enabled the experimental extinction spectrum of each colloid to be effectively divided into its absorption and scattering components (Fig. 3(a)). For sample A (the smallest 32 nm diameter particles), the scattering spectrum has shown a small peak but the extinction was mostly dominated by absorption. As the particle size increased (sample A to E), the peak in the absorption spectrum decreased in efficiency and the scattering peak grown, until sample E (127 nm diameter particles) where the extinction was largely dominated by scattering. By transforming the extinction, absorption, and scattering data for each sample such that the extinction efficiency at λmax was normalised, the absorption and scattering of each sample can be quantitatively compared (Fig. 3(b)). It can clearly be seen that the absorption has fallen and the scattering increased with increasing nanoparticle size. This increase in scattering processes explains the increasing intensity of the orange/brown colour observed in reflected light and the resulting dichroic effect. In the absence of any unique particle shapes or bimodal size distributions, the dichroic effect can be exclusively linked to particle size.
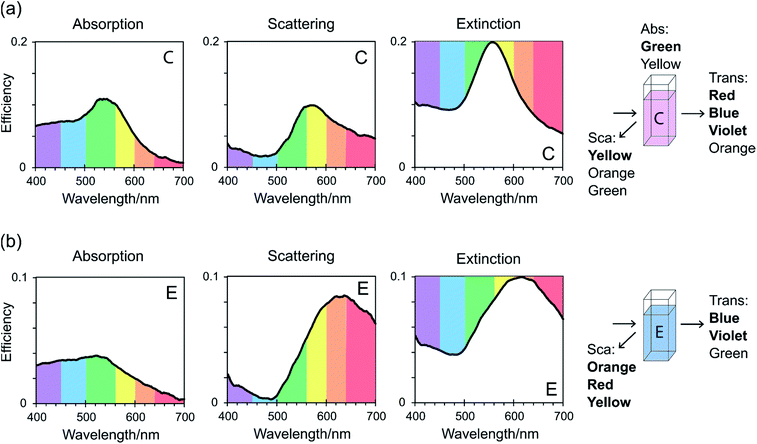
From CloudSpec data, and considering a simplification of visible light in which it is divided into six colours according to wavelength, the colours of the colloids observed in reflected and transmitted light have been rationalised (Fig. 4). Consider sample C which appeared purple in transmitted light but orange in reflected light (Fig. 4(a)). The peak in the scattering spectrum of sample C consisted mostly of yellow light, which when combined with smaller amounts of orange, green, and red light, gave the orange colour observed in reflected light. The colloid also absorbed light, and the peak in the absorption spectrum consisted primarily of green light. The colour that was then observed in transmitted light consisted of the light that was not scattered or absorbed, which is equivalent to the inverse of the extinction spectrum. For sample C, red, blue, violet, and orange light were not absorbed or scattered which combined to give the colour purple. Sample E scattered orange, red, and yellow light (Fig. 4(b)), giving the orange/brown colour observed in reflected light, however the absorption was overall too low to contribute significantly to the colours displayed. Blue, violet, and green light were not absorbed or scattered, giving a blue colour in transmitted light. This colour analysis has included significant approximations and simplifications, in that it has not considered the fractions of colours that were absorbed or scattered as represented by the heights of the peaks, or colours that were partially absorbed/scattered and were on the fringes of peaks. Additionally, the division of visible light into colours is itself an approximation. Despite this, it has worked well to explain the colours that were observed in these dichroic colloids.
Comparison to theory
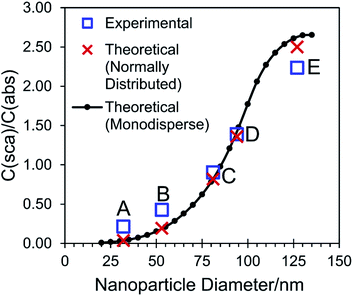
Because the synthesised gold nanoparticles were spherical with a narrow size distribution, their interaction with light could be modelled using Mie theory. The standard deviation of the particle diameter calculated from TEM analysis was incorporated into the Mie theory calculations to better model the experimental colloidal samples. The resulting theoretical extinction, scattering, and absorption spectra have compared well to those experimentally measured using the CloudSpec spectrophotometer (Fig. S3 and Table S2†). A small red-shift was observed in the majority of the experimental spectra compared to the theoretical spectra. This is commonly observed and often attributed to inaccurately measured particle diameters/distributions or particle imperfections (the presence of non-spherical or imperfectly spherical particles in the experimental samples will red-shift the spectra as compared to theory, which models a perfect sphere).48,51,52 Further, the conjugation of large molecules to gold nanoparticles is known to influence the LSPR peak position,53 but the PVP molecules adsorbed onto the surface of the particles synthesised in this research are not accounted for in the theoretical calculations. The PVP effectively increases the refractive index in the immediate vicinity of the nanoparticle, red-shifting the position of the peaks as compared to in the theoretical spectra. Lastly, the refractive index for gold utilised in this research was that measured by Johnson and Christy, and was chosen because of its extensive use in gold nanoparticle Mie theory calculations.7,54 However it should be noted that various other refractive index profiles have been measured for gold which disagree with the Johnson and Christy values, and which if utilised would result in theoretical LSPR peaks with different positions.43,53 Determination of the most appropriate refractive index data to use for gold nanoparticle calculations is unresolved.By the same method as El-Sayed and co-workers,7 the ratio of the scattering cross section to the absorption cross section has been calculated for the theoretical Mie theory results (red crosses and black circles in Fig. 5). Briefly, C(sca)/C(abs) was calculated for each sample as the ratio of the scattering efficiency at λmax (in the scattering cross section) to the absorption efficiency at λmax (in the absorption cross section). As was found in the referenced report,7 the C(sca)/C(abs) ratio increased with increasing particle size up to a diameter of ∼100 nm. However above this size the relationship has changed in that there was a smaller increase in C(sca)/C(abs) with each increase in diameter, until it remained approximately constant between 130 nm and 135 nm. This is due to the appearance of the quadrupolar resonance mode for large nanoparticles, for which the ratio of scattering to absorption is lower than for the respective dipolar resonance mode.
Because of the ability to quantitatively extract the absorption and scattering spectra from the extinction spectrum, a C(sca)/C(abs) ratio was also able to be calculated for the experimental spectra (blue squares in Fig. 5). A plot of these ratios against particle size shows that experimental and theory are in good agreement (Fig. 5), effectively acting as an experimental proof of this aspect of Mie theory and providing validation of the analysis and the conclusions drawn from experimental results. The small mismatch between experiment and theory at small and large particle sizes may have resulted from imperfectly spherical particles, the presence of PVP, or the choice of refractive index used in calculations (as previously discussed), however, the influence of these factors on the magnitude of scattering and absorption is not well understood and requires further investigation. The overall good agreement between theory and experiment shown in Fig. 5 has consequences for researchers who need accurate scattering information and who can be confident that the application of Mie theory gives reliable and accurate results for bulk nanoparticle colloids. Additionally, it has provided evidence that the CloudSpec spectrophotometer accurately measures the absorption and scattering profiles of a nanoparticle colloid. The instrument could therefore be utilised to measure the spectra of non-spherical nanoparticles that cannot be modelled using Mie theory and would usually require more complicated numerical calculations using, for example, finite-difference time-domain (FDTD) or discrete dipole approximation (DDA) methods.
Conclusions
In this article, the optical properties of synthesised spherical gold nanoparticle colloids with narrow size distributions have been extensively characterised. The extinction spectrum of each colloid has quantitatively been divided into its absorption and scattering components, which has enabled a systematic explanation of the different colours displayed by dichroic samples. The colour displayed in reflected light corresponds to the wavelengths of light that are scattered, whereas the colour in transmitted light corresponds to the wavelengths of light neither scattered nor absorbed.A relationship between the ratio of scattering to absorption and the particle size has been developed from experimental results and compared to the theoretical relationship with good agreement. This simultaneously gives confidence in the use of the CloudSpec spectrophotometer to gain this information, and in the use of Mie theory to estimate this information in the absence of the instrument.
Conflicts of interest
There are no conflicts to declare.Acknowledgements
This project was supported by the NZ Product Accelerator (Research subcontract to Victoria University of Wellington E3151-2582) and a Victoria University of Wellington Doctoral Scholarship. We are grateful to MaramaLabs for use of the CloudSpec spectrophotometer, and to Prof. Eric Le Ru for his advice on this manuscript.References
- A. Ruivo, C. Gomes, A. Lima, M. L. Botelho, R. Melo, A. Belchior and A. P. de Matos, J. Cult. Herit., 2008, 9, e134–e137 CrossRef.
- C. Louis, in Gold Nanoparticles for Chemistry, Physics and Biology, ed. C. Louis and O. Pluchery, Imperial College Press, London, 2012, pp. 1–27 Search PubMed.
- K. Saha, S. S. Agasti, C. Kim, X. Li and V. M. Rotello, Chem. Rev., 2012, 112, 2739–2779 CrossRef CAS.
- Y. Wu, M. R. K. Ali, K. Chen, N. Fang and M. A. El-Sayed, Nano Today, 2019, 24, 120–140 CrossRef CAS.
- C. Burda, X. Chen, R. Narayanan and M. A. El-Sayed, Chem. Rev., 2005, 105, 1025–1102 CrossRef CAS PubMed.
- K. L. Kelly, E. Coronado, L. L. Zhao and G. C. Schatz, J. Phys. Chem. B, 2003, 107, 668–677 CrossRef CAS.
- P. K. Jain, K. S. Lee, I. H. El-Sayed and M. A. El-Sayed, J. Phys. Chem. B, 2006, 110, 7238–7248 CrossRef CAS PubMed.
- W. Yang, H. Liang, S. Ma, D. Wang and J. Huang, Sustainable Mater. Technol., 2019, 22, e00109 CrossRef CAS.
- D. Jaque, L. Martínez Maestro, B. del Rosal, P. Haro-Gonzalez, A. Benayas, J. L. Plaza, E. Martín Rodríguez and J. García Solé, Nanoscale, 2014, 6, 9494–9530 RSC.
- S. Hwang, J. Nam, S. Jung, J. Song, H. Doh and S. Kim, Nanomedicine, 2014, 9, 2003–2022 CrossRef CAS PubMed.
- M. R. K. Ali, Y. Wu and M. A. El-Sayed, J. Phys. Chem. C, 2019, 123, 15375–15393 CrossRef CAS.
- R. S. Riley and E. S. Day, Wiley Interdiscip. Rev.: Nanomed. Nanobiotechnol., 2017, 9, e1449 Search PubMed.
- H. S. Kim and D. Y. Lee, J. Pharm. Invest., 2017, 47, 19–26 CrossRef CAS.
- W. Li and X. Chen, Nanomedicine, 2015, 10, 299–320 CrossRef CAS PubMed.
- R. García-Álvarez, L. Chen, A. Nedilko, A. Sánchez-Iglesias, A. Rix, W. Lederle, V. Pathak, T. Lammers, G. von Plessen and K. Kostarelos, ACS Photonics, 2020, 7, 646–652 CrossRef.
- S. Han, R. Bouchard and K. V Sokolov, Biomed. Opt. Express, 2019, 10, 3472–3483 CrossRef CAS PubMed.
- A. Agarwal, S. W. Huang, M. O'donnell, K. C. Day, M. Day, N. Kotov and S. Ashkenazi, J. Appl. Phys., 2007, 102, 64701 CrossRef.
- Y.-S. Chen, Y. Zhao, S. J. Yoon, S. S. Gambhir and S. Emelianov, Nat. Nanotechnol., 2019, 14, 465–472 CrossRef CAS PubMed.
- Y. Ponce de León, J. L. Pichardo-Molina, N. Alcalá Ochoa and D. Luna-Moreno, J. Nanomater., 2012, 2012, 571015 Search PubMed.
- T. S. Troutman, J. K. Barton and M. Romanowski, Opt. Lett., 2007, 32, 1438–1440 CrossRef PubMed.
- P. Si, S. Shevidi, E. Yuan, K. Yuan, Z. Lautman, S. S. Jeffrey, G. W. Sledge and A. de la Zerda, Nano Lett., 2019, 20, 101–108 CrossRef PubMed.
- J. Hu, F. Rivero, R. A. Torres, H. Loro Ramírez, E. M. Rodríguez, F. Alfonso, J. García Solé and D. Jaque, J. Biophotonics, 2017, 10, 674–682 CrossRef CAS PubMed.
- I. Freestone, N. Meeks, M. Sax and C. Higgitt, Gold Bull., 2007, 40, 270–277 CrossRef CAS.
- T. Som and B. Karmakar, Chem. Phys. Lett., 2009, 479, 100–104 CrossRef CAS.
- T. Som and B. Karmakar, Plasmonics, 2010, 5, 149–159 CrossRef CAS.
- S. P. Singh, M. Nath and B. Karmakar, Mater. Chem. Phys., 2014, 146, 198–203 CrossRef CAS.
- C.-C. Liu, W.-Z. Lin, S.-T. Tsai, J.-H. Chang, Y.-W. Hung and S.-Y. Hou, J. Nanosci. Nanotechnol., 2018, 18, 7197–7202 CrossRef CAS PubMed.
- M. Gajc, H. B. Surma, A. Klos, K. Sadecka, K. Orlinski, A. E. Nikolaenko, K. Zdunek and D. A. Pawlak, Adv. Funct. Mater., 2013, 23, 3443–3451 CrossRef CAS.
- L. Kool, A. Bunschoten, A. H. Velders and V. Saggiomo, Beilstein J. Nanotechnol., 2019, 10, 442–447 CrossRef CAS PubMed.
- T. Som and B. Karmakar, J. Opt. Soc. Am. B, 2009, 26, B21–B27 CrossRef CAS.
- G. Molina, S. Murcia, J. Molera, C. Roldan, D. Crespo and T. Pradell, J. Nanopart. Res., 2013, 15, 1932 CrossRef.
- A. Jakhmola, R. Vecchione, V. Onesto, F. Gentile, M. Celentano and P. A. Netti, Nanomaterials, 2021, 11, 236 CrossRef CAS PubMed.
- E. C. Cho, C. Kim, F. Zhou, C. M. Cobley, K. H. Song, J. Chen, Z.-Y. Li, L. V Wang and Y. Xia, J. Phys. Chem. C, 2009, 113, 9023–9028 CrossRef CAS PubMed.
- A. Gnerucci, F. Ratto, S. Centi, A. Conti, R. Pini, F. Fusi and G. Romano, Microsc. Res. Tech., 2014, 77, 886–895 CrossRef CAS PubMed.
- R. Mercatelli, G. Romano, F. Ratto, P. Matteini, S. Centi, F. Cialdai, M. Monici, R. Pini and F. Fusi, Appl. Phys. Lett., 2011, 99, 131113 CrossRef.
- D. D. Evanoff and G. Chumanov, J. Phys. Chem. B, 2004, 108, 13957–13962 CrossRef CAS.
- C. Langhammer, B. Kasemo and I. Zorić, J. Chem. Phys., 2007, 126, 194702 CrossRef PubMed.
- J. Grand, B. Auguié and E. C. Le Ru, Anal. Chem., 2019, 91, 14639–14648 CrossRef CAS PubMed.
- C. Ungureanu, A. Amelink, R. G. Rayavarapu, H. J. C. M. Sterenborg, S. Manohar and T. G. van Leeuwen, ACS Nano, 2010, 4, 4081–4089 CrossRef CAS PubMed.
- B.-J. Liu, K.-Q. Lin, S. Hu, X. Wang, Z.-C. Lei, H.-X. Lin and B. Ren, Anal. Chem., 2015, 87, 1058–1065 CrossRef CAS PubMed.
- MaramaLabs, CloudSpec™—a new era for UV-VIS spectroscopy, https://maramalabs.com/, accessed 2 October 2020 Search PubMed.
- C. Gao, J. Vuong, Q. Zhang, Y. Liu and Y. Yin, Nanoscale, 2012, 4, 2875–2878 RSC.
- A. Djorović, S. J. Oldenburg, J. Grand and E. C. Le Ru, ACS Nano, 2020, 14, 17597–17605 CrossRef PubMed.
- Y. Villanueva, C. Veenstra and W. Steenbergen, Appl. Opt., 2016, 55, 3030–3038 CrossRef PubMed.
- P. Laven, MiePlot (v4.6.13), 2018 Search PubMed.
- P. B. Johnson and R. W. Christy, Phys. Rev. B: Solid State, 1972, 6, 4370–4379 CrossRef CAS.
- Release on the Refractive Index of Ordinary Water Substance as a Function of Wavelength, Temperature and Pressure, The International Association for the Properties of Water and Steam, Erlangen, 1997 Search PubMed.
- J. Rodríguez-Fernández, J. Pérez-Juste, F. J. de Abajo and L. M. Liz-Marzán, Langmuir, 2006, 22, 7007–7010 CrossRef PubMed.
- M. Faraday, Philos. Trans. R. Soc. London, 1857, 147, 145–181 CrossRef.
- J. Turkevich, G. Garton and P. C. Stevenson, J. Colloid Sci., 1954, 9, 26–35 CrossRef.
- C. Ziegler and A. Eychmüller, J. Phys. Chem. C, 2011, 115, 4502–4506 CrossRef CAS.
- S. Mühlig, C. Rockstuhl, V. Yannopapas, T. Bürgi, N. Shalkevich and F. Lederer, Opt. Express, 2011, 19, 9607–9616 CrossRef PubMed.
- V. Amendola and M. Meneghetti, J. Phys. Chem. C, 2009, 113, 4277–4285 CrossRef CAS.
- N. G. Khlebtsov, Anal. Chem., 2008, 80, 6620–6625 CrossRef CAS PubMed.
Footnote |
| † Electronic supplementary information (ESI) available. See DOI: 10.1039/d1na00148e |
| This journal is © The Royal Society of Chemistry 2021 |

