 Open Access Article
Pt3Sn nanoparticles enriched with SnO2/Pt3Sn interfaces for highly efficient alcohol electrooxidation†
Zichen
Wang
a,
Liang
Wang
a,
Wangbin
Zhu
a,
Tang
Zeng
a,
Wei
Wu
a,
Zhao
Lei
a,
Yangyang
Tan
a,
Haifeng
Lv
 *bc and
Niancai
Cheng
 *a
*a
aCollege of Materials Science and Engineering, Fuzhou University, Fuzhou 350108, Fujian, China. E-mail: niancaicheng@fzu.edu.cn
bPEM Fuel Cell Catalyst Research and Development Center, Shenzhen, Guangdong 518057, China
cMaterials Science Division, Argonne National Laboratory, Argonne, IL 60439, USA. E-mail: lvhaifenganl@gmail.com
First published on 3rd July 2021
Abstract
Pt3Sn nanoparticles (NPs) enriched with Pt3Sn/ultra-small SnO2 interfaces (Pt3Sn@u-SnO2/NG) were synthesized through a thermal treatment of Pt2Sn/NG in a H2 atmosphere, followed by annealing under H2 and air conditions. The unique structure of Pt3Sn NPs enriched with Pt3Sn/SnO2 interfaces was observed on the Pt3Sn@u-SnO2/NG catalyst based on HRTEM. The optimized Pt3Sn@u-SnO2/NG catalyst achieves high catalytic activity with an ethanol oxidation reaction (EOR) activity of 366 mA mgPt−1 and a methanol oxidation reaction (MOR) activity of 503 mA mgPt−1 at the potential of 0.7 V, which are eight-fold and five-fold higher than those for the commercial Pt/C catalyst (44 and 99 mA mgPt−1, respectively). The Pt3Sn@u-SnO2/NG catalyst is found to be 3 times more stable and have higher CO tolerance than Pt/C. The outstanding performance of the Pt3Sn@u-SnO2/NG catalyst should be ascribed to the synergetic effect induced by the unique structure of Pt3Sn NPs enriched with Pt3Sn/SnO2 interfaces. The synergetic effect between Pt3Sn NPs and ultra-small SnO2 increases the performance for alcohol oxidation because the Sn in both Pt3Sn and SnO2 favors the removal of COads on the nearby Pt by providing OHads species at low potentials. The present work suggests that the Pt3Sn@u-SnO2 is indeed a unique kind of efficient electrocatalyst for alcohol electrooxidation.
1. Introduction
During the past few decades, direct alcohol fuel cells (DAFCs) have emerged as an attractive alternative energy technology for portable electronics and vehicles due to their high energy density, low pollutant emission and easy storage and transportation.1–3 Pt/C catalysts are the most popular electrocatalysts to accelerate the kinetics of the methanol oxidation reaction (MOR) and ethanol oxidation reaction (EOR) at the anode in DAFCs.4–6 However, the practical adoption of DAFCs is limited by the high cost, low activities and poor durability of Pt/C catalysts.6,7 Furthermore, Pt is highly susceptible to being poisoned by intermediates such as CO, which easily adsorb on Pt and block the active sites of Pt catalysts, thus leading to the deactivation of Pt NPs.8,9To address the above issues, Pt alloying with other transition metals is an effective strategy to promote the oxidation of methanol/ethanol.2,10–12 Different bimetallic PtM (M = Ru, Rh, Co, Ni, Fe, Sn) catalysts with different structures have been explored to improve the Pt activity and stability towards oxidation of methanol/ethanol.13–19 The improvement in the performance of Pt alloys is attributed to a bifunctional and/or electronic effect of transition metals on Pt.20–22 Among these Pt alloys, Pt alloyed with Sn has received considerable attention for alcohol oxidation mainly due to its superior performance with high CO-poisoning tolerance.23–26 For example, compared with pure nanowires, ultrathin PtxSn1−x nanowires were found to not only achieve superior activity and stability towards the MOR and EOR, but also exhibit much lower onset potentials.27–29 Furthermore, Pt3Sn NPs are reported to have higher EOR activity than PtSn NPs.30
The design of interfacial Pt–metal oxide structures in DAFC anode catalytic systems is believed to be another effective strategy.31–34 The interfacial Pt–metal oxide structures not only improve the stability resulting from the strong metal–support interaction (SMSI) effect, but also improve the Pt activity through the bifunctional mechanism, wherein metal oxides provide adsorbed hydroxyl groups for adjacent Pt active sites to facilitate the oxidation and removal of the reaction intermediates (e.g., CHx and CO) at a lower potential and thus improve the Pt activity towards the MOR and EOR.35 For example, SnO2 NPs were widely used to provide hydroxyl groups for helping the removal of adsorbed CO on the surface of Pt, leading to improved electrocatalytic performance for methanol/ethanol oxidation.36,37 Recently, Cheng et al.38 annealed Pt–Sn on N-doped graphene under air conditions to ensure that each generated Pt3Sn NP is in close contact with one or more SnO2 NPs, resulting in high activity towards the MOR and EOR due to the formation of the interfacial Pt3Sn–SnO2 structures. However, designing enough interfacial Pt–metal oxides around Pt-based catalysts is still a big challenge.
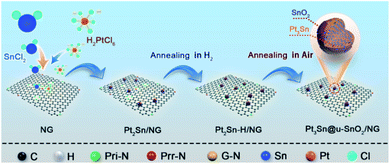
In this work, we developed highly active and stable Pt3Sn NPs enriched with SnO2/Pt3Sn interfaces through surface restructuring in Pt2Sn NPs under H2 and air conditions. As shown in Scheme 1, Pt2Sn/NG catalysts were firstly obtained by deposition of Pt2Sn NPs on nitrogen-doped graphene (NG) using the polyol method39 with the nominal Pt/Sn atomic ratio of 2![[thin space (1/6-em)]](https://www.rsc.org/images/entities/char_2009.gif) :
:![[thin space (1/6-em)]](https://www.rsc.org/images/entities/char_2009.gif) 1. The Pt3Sn NPs enriched with SnO2/Pt3Sn interfaces on the NG (Pt3Sn@u-SnO2/NG) were achieved through thermal treatment of Pt2Sn/NG in a H2 atmosphere, followed by annealing under air conditions. Pt3Sn@u-SnO2/NG catalysts display superior activity and excellent stability for the EOR and MOR.
1. The Pt3Sn NPs enriched with SnO2/Pt3Sn interfaces on the NG (Pt3Sn@u-SnO2/NG) were achieved through thermal treatment of Pt2Sn/NG in a H2 atmosphere, followed by annealing under air conditions. Pt3Sn@u-SnO2/NG catalysts display superior activity and excellent stability for the EOR and MOR.
2. Results and discussion
2.1 Structure of the catalyst
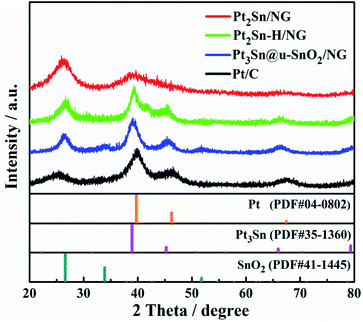
X-ray diffraction (XRD) was firstly applied to monitor the transformation of Pt2Sn/NG to Pt3Sn@u-SnO2/NG. Three broad peaks centered at 38.9°, 45.2° and 66.5° were detected for the Pt2Sn/NG catalyst (Fig. 1), owing to the reflections of (111), (200) and (220) planes of Pt NPs with a face-centered cubic (fcc) structure, respectively.40 After treatment of Pt2Sn/NG in H2/N2 at 300 °C for 1 h, stronger and sharper diffraction peaks appear, which indicates the formation of a large particle size in the Pt2Sn–H/NG catalyst. Compared with commercial Pt/C and Pt2Sn–H/NG catalysts, it is obvious that diffraction peaks in the Pt3Sn@u-SnO2/NG catalyst negatively shift to 38.8°, 45.5° and 66.1°, which are close to (111), (200) and (220) planes of the Pt3Sn NPs (PDF# 35-1360). Furthermore, small and broadened diffraction peaks of SnO2 were observed, which demonstrate the ultra-small feature of SnO2 NPs. A strong diffraction peak at about ca. 25.5° was observed, originating from the (002) reflections of NG.Transmission electron microscopy (TEM) was further performed to investigate the structural evolution upon the thermal treatment of the Pt2Sn/NG sample. Fig. S1† shows that Pt2Sn NPs with 2–4 nm in diameter were highly dispersed on NG. A larger particle size of Pt2Sn NPs is found to be formed after treatment of Pt2Sn/NG in H2/N2 at 300 °C for 1 h as shown in Fig. S2.† After contiguous annealing of the Pt2Sn–H/NG sample in air at 300 °C for 1 h, the interplanar spacings were measured to be 0.200 and 0.231 nm, as shown in Fig. 2b, corresponding to the spacings between the (200) and (111) facets of fcc Pt3Sn, respectively. The Pt3Sn formation in Pt3Sn@u-SnO2/NG was further displayed by the selected diffraction pattern as shown in Fig. S3.† In addition to the typical (111) and (200) planes, we found Pt3Sn specific superlattice diffraction rings with diameters of 11.17 nm−1, 14.08 nm−1 and 16.65 nm−1. The corresponding crystal plane spacing was 0.179 nm, 0.142 nm and 0.120 nm, respectively, which are attributed to (210), (220) and (311) of Pt3Sn, respectively. More importantly, ultra-small SnO2 NPs on the Pt3Sn NPs were found, in accordance with the analysis of XRD. This result suggests the formation of the interfacial Pt3Sn–SnO2 structures on Pt3Sn NPs through surface restructuring in Pt2Sn NPs under air conditions. Pt-based catalysts enriched with Pt/metal oxides have proved to increase the EOR due to the enhanced C–C bond cleavage.41 The elemental mapping images as shown in Fig. 2c also indicate that the Sn element is distributed around the Pt3Sn NPs, which confirms that there are abundant ultra-small SnO2 NPs around the Pt3Sn NPs.
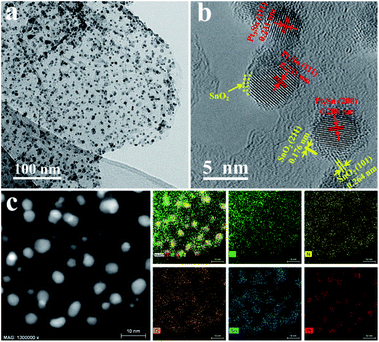 | ||
| Fig. 2 (a) TEM and (b) HRTEM images of the Pt3Sn@u-SnO2/NG catalyst. (c) STEM image and the corresponding elemental maps of C, N, O, Sn and Pt. | ||
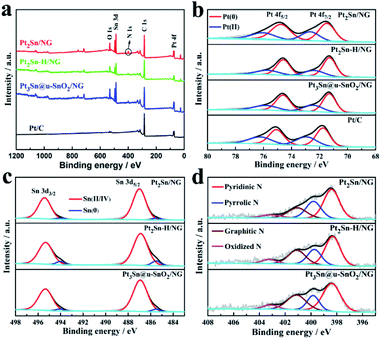
X-ray photoelectron spectroscopy (XPS) was carried out to observe the effect of thermal treatment in H2 and air on the surface properties of the Pt2Sn/NG sample shown in Fig. 3. The high resolution XPS spectrum of Pt2Sn/NG in the Pt 4f region (Fig. 3b) clearly shows the binding energies of Pt 4f5/2 at 74.77 eV and Pt 4f7/2 at 71.49 eV, which are a little lower than those of the Pt/C catalyst (75.10 and 71.76 eV). After thermal treatment of the Pt2Sn/NG sample in H2, the binding energies of Pt 4f5/2 and Pt 4f7/2 for the Pt2Sn–H/NG sample were negatively shifted to 74.59 eV and 71.23 eV. The thermal treatment in H2 changed the crystal structure and degree of ordering of the alloy, which leads to the tuning of the Pt surface electronic structure and thus the downshift of Pt 4f.42 After annealing of the Pt2Sn–H/NG sample in air, the binding energies of Pt 4f5/2 and Pt 4f7/2 for the Pt3Sn@u-SnO2/NG sample positively shift to 74.61 eV and 71.32 eV. The deconvoluted Pt 4f spectrum of the Pt3Sn@u-SnO2/NG sample as shown in Fig. 3b indicates that two doublets are located at binding energies of 71.32/74.61 eV and 72.50/75.90 eV, corresponding to metal Pt and the bivalent Pt ion, respectively. The binding energies of Pt 4f5/2 and Pt 4f7/2 for the other samples are summarized in Table S2.†Fig. 3c shows the deconvoluted Sn 3d spectra of Pt2Sn/NG, Pt2Sn–H/NG and Pt3Sn@u-SnO2/NG samples. The main two bands located at about 486.93/495.34 eV and 485.51/494.04 eV were observed for these three samples (Table S3†), which should be attributed to Sn(II/IV) and Sn(0). As given in Table S4,† the Sn(0) content in Pt2Sn–H/NG is higher than that of Pt2Sn/NG, which is mainly due to the change in the crystal structure and degree of ordering of the alloy.43 Compared with Pt2Sn–H/NG, the Pt3Sn@u-SnO2/NG sample has a lower content of Sn(0) due to the formation of SnO2. There is no significant change observed for N configurations and content in NG after the thermal treatment at 300 °C in H2 and air atmospheres (Fig. 3d).
2.2 Evaluation of electrochemical activity
The cyclic voltammograms (CVs) of the as-prepared Pt3Sn@u-SnO2/NG were recorded prior to evaluating its EOR activity. The CVs of Pt3Sn@u-SnO2/NG, Pt2Sn–H/NG and Pt2Sn/NG as shown in Fig. S4a† showed different adsorption/desorption peaks compared with the Pt/C catalyst, which arise from the insertion of Sn into the Pt lattice.42 The EOR performance of our samples was characterized as shown in Fig. 4 and the current densities were normalized with respect to the Pt loading. It is observed from polarization curves for ethanol oxidation in Fig. 4a that the peak EOR current densities of different catalysts decrease in the order of Pt3Sn@u-SnO2/NG > Pt2Sn–H/NG > Pt2Sn/NG > Pt/C (30%, JM). We also find that the onset potential of the EOR on different catalysts follows the same trend as shown in Fig. S4.† More importantly, Pt3Sn@u-SnO2/NG shows higher EOR activity compared with the other samples during 0.45–0.7 V vs. RHE (Fig. S5†) for the practical applications of direct ethanol fuel cells (DEFCs).44 The mass activity of 366 mA mgPt−1 was achieved on Pt3Sn@u-SnO2/NG at 0.7 V (Fig. 4b), which is 1.4, 1.9, and 8.3 times greater than that of Pt2Sn–H/NG (256 mA mgPt−1), Pt2Sn/NG (197 mA mgPt−1) and Pt/C (44 mA mgPt−1), respectively. The high EOR activity of Pt3Sn@u-SnO2/NG was further confirmed by the Tafel plots as shown in Fig. 4e. The Tafel slope on Pt3Sn@u-SnO2/NG is 284 mV dec−1, much lower than that of commercial Pt/C (319 mV dec−1), indicating that Pt3Sn@u-SnO2/NG prepared by our strategy can obviously promote the EOR kinetics on the Pt surface. The very high EOR activity of the Pt3Sn@u-SnO2/NG catalyst mainly should be attributed to the unique structure of Pt3Sn NPs enriched with Pt3Sn/SnO2 interfaces, which make the Pt3Sn@u-SnO2/NG catalyst one of the most promising EOR catalysts towards the EOR compared with the most recently reported catalysts (Table S5†).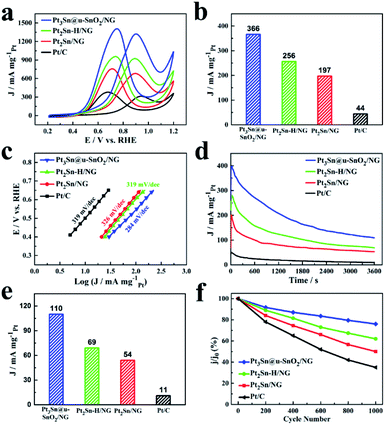 | ||
| Fig. 4 (a) CV curves of different catalysts in 0.5 M H2SO4 + 1 M CH3CH2OH solution with a sweep rate of 50 mV s−1. (b) The current density of different catalysts at 0.7 V in 0.5 M H2SO4 + 1 M CH3CH2OH solution. (c) Corresponding Tafel plots for the EOR on different catalysts. (d) Chronoamperometric curves of t of different catalysts in N2-saturated 0.5 M H2SO4 + 1 M CH3CH2OH solution at constant voltage 0.7 V for 3600 s. (e) The current density at 0.7 V at 3600 s for different catalysts obtained from Fig. 4d. (f) Changes of peak current densities of the EOR during potential cycling of different catalysts. | ||
The chronoamperometric technique was firstly applied to monitor the stabilities of different electrocatalysts. As shown in Fig. 4c, the EOR activities on all catalysts running at the potential of 0.7 V gradually decay with time because the generated intermediates like CO poison the active sites of Pt-based catalysts during the ethanol oxidation. The Pt3Sn@u-SnO2/NG catalyst achieves higher mass activity in comparison with the Pt2Sn–H/NG, Pt2Sn/NG and Pt/C catalysts during a period of 3600 s (Fig. 4d). After operating the reaction for 3600 s, the retained mass activity on the Pt3Sn@u-SnO2/NG catalyst is found to be 110 mA mgPt−1 at the potential of 0.7 V, outperforming the Pt2Sn–H/NG (69 mA mgPt−1), Pt2Sn/NG (54 mA mgPt−1) and Pt/C (11 mA mgPt−1), respectively. The stability of the Pt3Sn@u-SnO2/NG catalyst was further investigated by the accelerated durability tests (ADTs). The Pt3Sn@u-SnO2/NG catalyst retains the highest proportion of its initial activity among all catalysts after 1000 cycles (Fig. 4f and S6†). The Pt3Sn@u-SnO2/NG catalyst exhibits superior long-term stability with the loss of 24% of its initial activity, which is about 2.7 times higher than that of the Pt/C catalyst (65%). The Pt3Sn@u-SnO2/NG did not show significant agglomeration, and the ultra-small SnO2 around Pt3Sn NPs was still visible (Fig. S7†). These findings indicate that the Pt3Sn@u-SnO2/NG catalyst possesses excellent performance due to the formation of the interfacial Pt3Sn–SnO2 structures on Pt3Sn NPs.
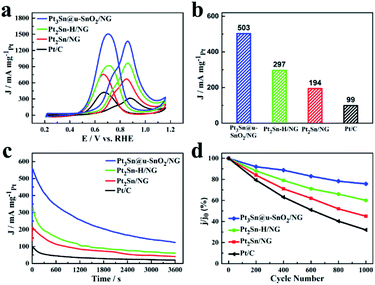
In addition to the high EOR activity, the Pt3Sn@u-SnO2/NG catalyst also shows excellent performance for methanol oxidation as shown in Fig. 5 and Table S6.† The Pt3Sn@u-SnO2/NG catalyst has higher MOR peak activity compared with the Pt2Sn–H/NG, Pt2Sn/NG and Pt/C catalysts (Fig. 5a). Pt3Sn@u-SnO2/NG is found to have higher MOR activity compared with the other samples during 0.45–0.7 V vs. RHE (Fig. S8†). Besides the main oxidation peak at about 0.84 V for the MOR, a shoulder peak at 0.72 V was observed for the methanol oxidation reaction, attributed to the different types of active sites for methanol oxidation.45 As shown in Fig. 5b, the mass activity of the MOR on the Pt3Sn@u-SnO2/NG catalyst is 503 mA mgPt−1 at the potential of 0.7 V, outperforming Pt2Sn–H/NG (297 mA mgPt−1), Pt2Sn/NG (194 mA mgPt−1) and Pt/C (99 mA mgPt−1), respectively. The MOR mass activity on the Pt3Sn@u-SnO2/NG catalyst is 5.1 times higher than that of the Pt/C catalyst. The excellent MOR activity of Pt3Sn@u-SnO2/NG was also supported by the Tafel plots (Fig. S9†). The chronoamperometric measurements (Fig. 5c) show that the Pt3Sn@u-SnO2/NG catalyst has higher current density and lower current decay in comparison with the other samples, indicating the high stability of the Pt3Sn@u-SnO2/NG catalyst for methanol oxidation. The high stability of the Pt3Sn@u-SnO2/NG catalyst during the MOR is also confirmed by the ADTs. After ADT (Fig. 5d, S10 and S11†), the Pt3Sn@u-SnO2/NG catalyst losses only 25% of its initial activity while the activity of the Pt/C catalyst decreases by 68% under the same operating conditions.
The ability of the CO tolerance on different catalysts was evaluated by CO stripping voltammograms as shown in Fig. 6. It is obvious that the onset potential for CO oxidation on the Pt3Sn@u-SnO2/NG catalyst is 0.36 V, lower than that of Pt2Sn–H/NG (0.55 V), Pt2Sn/NG (0.64 V) and Pt/C (0.81 V), respectively. The lowest onset potential of Pt3Sn@u-SnO2/NG (0.36 V) should be ascribed to the unique structure of Pt3Sn decorated with ultra-small SnO2, helping the CO oxidation on the Pt surface at relatively low potentials by the bifunctional effects. Furthermore, the main peak of CO oxidation on the Pt3Sn@u-SnO2/NG catalyst has the lowest potential of 0.73 V compared with the other catalysts. This result indicates that the Pt3Sn@u-SnO2/NG catalyst possesses high CO tolerance.
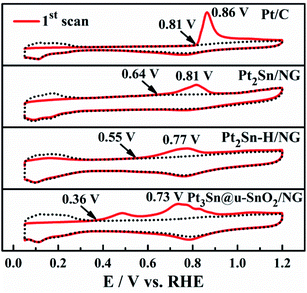 | ||
| Fig. 6 CO stripping patterns recorded on Pt2Sn/NG, Pt2Sn–H/NG, Pt3Sn@u-SnO2/NG and Pt/C in 0.5 M H2SO4. | ||
The enhanced activity and stability of the Pt3Sn@u-SnO2/NG catalyst may be related to the unique structure of Pt3Sn NPs enriched with Pt3Sn/SnO2 interfaces. The Pt3Sn NPs not only possesses high activity but also stability during the MOR and EOR process. The incorporation of Sn into Pt lattices is believed to not only tune the Pt electronic structure but also increase the Pt–Pt distance, which results in the enhanced performance for alcohol oxidation by inhibiting CO adsorption and lowering the CO affinity on Pt active sites.46 Furthermore, the surface decorated ultra-small SnO2 can generate OH species at low potentials, which can improve the kinetics of CO electro-oxidation on the Pt NPs.
3. Conclusion
In conclusion, we have successfully synthesized Pt3Sn NPs enriched with Pt3Sn/SnO2 interfaces on NG through thermal treatment of Pt2Sn/NG in a H2 atmosphere, followed by annealing under H2 and air conditions. The Pt3Sn@u-SnO2/NG catalyst exhibits superior mass activities of 366 mA mgPt−1 for the EOR and 503 mA mgPt−1 for the MOR at 0.7 V, which are 8.3 and 5.1 times better than those of commercial Pt/C, respectively. CO-stripping profiles obtained on the Pt3Sn@u-SnO2/NG catalyst showed higher CO tolerance in comparison with Pt/C. The outstanding performance of Pt3Sn@u-SnO2/NG catalysts should be ascribed to the synergetic effect induced by the unique structure of Pt3Sn NPs enriched with Pt3Sn/SnO2 interfaces.4. Methods
4.1 Chemicals
All chemicals were utilized as received without further purification. Chloroplatinic acid hexahydrate [H2PtCl6·6H2O], tin(II) chloride dehydrate [SnCl2·2H2O], urea [CO(NH2)2] and ethylene glycol (EG) were of analytical reagent (A.R.) grade and purchased from Sinopharm Chemical Reagent Co., Ltd. Commercial 30 wt% Pt/C was purchased from Johnson Matthey. Deionized water (DI water, Millipore, 18.2 MΩ at 25 °C) was used in all processes.4.2 Synthesis of the Pt3Sn@u-SnO2/NG
The N-doped GO (NG) was synthesized by pyrolysis of the mixture of graphene oxide (GO) prepared by a modified Hummers method47 and urea in an N2 atmosphere at 600 °C for 30 minutes. Pt2Sn/NG was prepared using SnCl2·2H2O and H2PtCl6·6H2O as precursors with the Sn/Pt atomic ratio of 1![[thin space (1/6-em)]](https://www.rsc.org/images/entities/char_2009.gif) :
:![[thin space (1/6-em)]](https://www.rsc.org/images/entities/char_2009.gif) 2 by the polyol method.39 The Pt2Sn–H/NG catalyst was obtained by direct heat treatment of Pt2Sn/NG at 300 °C for 1 h in a 10% H2/90% N2 atmosphere. The Pt3Sn@u-SnO2/NG catalyst was obtained by direct heat treatment of Pt2Sn–H/NG at 300 °C for 1 h in an air atmosphere. The Pt loading on Pt3Sn@u-SnO2/NG, Pt2Sn–H/NG and Pt2Sn/NG catalysts was 14.5 wt%, 16.2 wt% and 15.8 wt%, respectively according to the ICP test.
2 by the polyol method.39 The Pt2Sn–H/NG catalyst was obtained by direct heat treatment of Pt2Sn/NG at 300 °C for 1 h in a 10% H2/90% N2 atmosphere. The Pt3Sn@u-SnO2/NG catalyst was obtained by direct heat treatment of Pt2Sn–H/NG at 300 °C for 1 h in an air atmosphere. The Pt loading on Pt3Sn@u-SnO2/NG, Pt2Sn–H/NG and Pt2Sn/NG catalysts was 14.5 wt%, 16.2 wt% and 15.8 wt%, respectively according to the ICP test.
4.3 Material characterization and electrochemical measurements
The composition, structure and morphology of the prepared catalysts were investigated by transmission electron microscopy (TEM, TECNAL G2F2O) and X-ray powder diffraction (XRD, ULTIMA III). X-ray photoelectron spectroscopy (XPS) spectra were studied with a K-Alpha spectrometer. The Pt loading was obtained using an Inductively Coupled Plasma Mass Spectrometer (ICP-MS) (iCAP7000, Thermo Fisher Scientific). Electrochemical measurements were performed with an Autolab electrochemistry station using a standard three-electrode cell at 25 °C. More detailed information regarding electrochemical testing is provided in the ESI.†Conflicts of interest
There are no conflicts to declare.Acknowledgements
This work was supported by the National Natural Science Foundation of China (Grant No. 21875039), Minjiang Professorship (XRC-1677), and Fujian Province's High Level Innovative and Entrepreneurial Talents (50012709).References
- R. Chang, L. Zheng, C. Wang, D. Yang, G. Zhang and S. Sun, Appl. Catal., B, 2017, 211, 205–211 CrossRef CAS.
- J. Bai, D. Liu, J. Yang and Y. Chen, ChemSusChem, 2019, 12, 2117–2132 CrossRef CAS PubMed.
- R. Rizo, S. Pérez-Rodríguez and G. García, ChemElectroChem, 2019, 6, 4725–4738 CrossRef CAS.
- X. Yue, Y. Pu, W. Zhang, T. Zhang and W. Gao, J. Energy Chem., 2020, 49, 275–282 CrossRef.
- X. L. Tian, L. Wang, P. Deng, Y. Chen and B. Y. Xia, J. Energy Chem., 2017, 26, 1067–1076 CrossRef.
- Y. Zheng, X. Wan, X. Cheng, K. Cheng, Z. Dai and Z. Liu, Catalysts, 2020, 10, 166 CrossRef CAS.
- G. L. Zhang, Z. Z. Yang, C. D. Huang, W. Zhang and Y. X. Wang, Nanoscale, 2015, 7, 10170–10177 RSC.
- S. Xue, W. Deng, F. Yang, J. Yang, I. S. Amiinu, D. He, H. Tang and S. Mu, ACS Catal., 2018, 8, 7578–7584 CrossRef CAS.
- X. Wang, M. Sun, S. Xiang, M. Waqas, Y. Fan, J. Zhong, K. Huang, W. Chen, L. Liu and J. Yang, Electrochim. Acta, 2020, 337, 135742 CrossRef CAS.
- Z. Xia, X. Zhang, H. Sun, S. Wang and G. Sun, Nano Energy, 2019, 65, 104048 CrossRef CAS.
- J. Li, S. Z. Jilani, H. Lin, X. Liu, K. Wei, Y. Jia, P. Zhang, M. Chi, Y. J. Tong, Z. Xi and S. Sun, Angew. Chem., Int. Ed., 2019, 131, 11651–11657 CrossRef.
- H. Liu, J. Li, L. Wang, Y. Tang, B. Y. Xia and Y. Chen, Nano Res., 2017, 10, 3324–3332 CrossRef CAS.
- S. Yin, Z. Wang, X. Qian, D. Yang, Y. Xu, X. Li, L. Wang and H. Wang, ACS Sustainable Chem. Eng., 2019, 7, 7960–7968 CrossRef CAS.
- S. Dai, T.-H. Huang, X. Yan, C.-Y. Yang, T.-Y. Chen, J.-H. Wang, X. Pan and K.-W. Wang, ACS Energy Lett., 2018, 3, 2550–2557 CrossRef CAS.
- Q. Lu, J. Huang, C. Han, L. Sun and X. Yang, Electrochim. Acta, 2018, 266, 305–311 CrossRef CAS.
- Y. Zhang, F. Gao, T. Song, C. Wang, C. Chen and Y. Du, Nanoscale, 2019, 11, 15561–15566 RSC.
- J. Bai, X. Xiao, Y. Y. Xue, J. X. Jiang, J. H. Zeng, X. F. Li and Y. Chen, ACS Appl. Mater. Interfaces, 2018, 10, 19755–19763 CrossRef CAS.
- S. Yin, R. D. Kumar, H. Yu, C. Li, Z. Wang, Y. Xu, X. Li, L. Wang and H. Wang, ACS Sustainable Chem. Eng., 2019, 7, 14867–14873 CrossRef CAS.
- Y. Bao, F. Wang, X. Gu and L. Feng, Nanoscale, 2019, 11, 18866–18873 RSC.
- L. Yang, J. J. Ge, C. P. Liu, G. L. Wang and W. Xing, Curr. Opin. Electrochem., 2017, 4, 83–88 CrossRef CAS.
- L. Zheng, D. Yang, R. Chang, C. Wang, G. Zhang and S. Sun, Nanoscale, 2017, 9, 8918–8924 RSC.
- F. Zhao, Q. Yuan, B. Luo, C. Li, F. Yang, X. Yang and Z. Zhou, Sci. China Mater., 2019, 62, 1877–1887 CrossRef CAS.
- M. Roca-Ayats, O. Guillén-Villafuerte, G. García, M. Soler-Vicedo, E. Pastor and M. V. Martínez-Huerta, Appl. Catal., B, 2018, 237, 382–391 CrossRef CAS.
- Y. Ma, H. Wang, S. Ji, V. Linkov and R. Wang, J. Power Sources, 2014, 247, 142–150 CrossRef CAS.
- F. Wu, D. Zhang, M. Peng, Z. Yu, X. Wang, G. Guo and Y. Sun, Angew. Chem., Int. Ed., 2016, 55, 4952–4956 CrossRef CAS PubMed.
- J. Yu, M. Jia, T. Dai, F. Qin and Y. Zhao, J. Solid State Electrochem., 2016, 21, 967–974 CrossRef.
- H. Sun, Y. Lian, C. Yang, L. Xiong, P. Qi, Q. Mu, X. Zhao, J. Guo, Z. Deng and Y. Peng, Energy Environ. Sci., 2018, 11, 2363–2371 RSC.
- M. Chen, Y. Han, T. W. Goh, R. Sun, R. V. Maligal-Ganesh, Y. Pei, C. K. Tsung, J. W. Evans and W. Huang, Nanoscale, 2019, 11, 5336–5345 RSC.
- W. Chen, Z. Lei, T. Zeng, L. Wang, N. Cheng, Y. Tan and S. Mu, Nanoscale, 2019, 11, 19895–19902 RSC.
- Y. Uemura, Y. Inada, K. K. Bando, T. Sasaki, N. Kamiuchi, K. Eguchi, A. Yagishita, M. Nomura, M. Tada and Y. Iwasawa, Phys. Chem. Chem. Phys., 2011, 13, 15833–15844 RSC.
- J. W. Magee, W.-P. Zhou and M. G. White, Appl. Catal., B, 2014, 152–153, 397–402 CrossRef CAS.
- L. Zheng, S. Zheng, Z. Zhu, Q. Xu, G. Zhang, S. Sun and D. Yang, Adv. Mater. Interfaces, 2018, 5, 1800748 CrossRef.
- Z. Yang, M. Li, P. Cui, G. Zhang, X. Jiang and Y. Wang, ACS Sustainable Chem. Eng., 2018, 6, 14026–14032 CrossRef CAS.
- Z.-Y. Li, J. Zhou, L.-S. Tang, X.-P. Fu, H. Wei, M. Xue, Y.-L. Zhao, C.-J. Jia, X.-M. Li, H.-B. Chu and Y. Li, J. Mater. Chem. A, 2018, 6, 2318–2326 RSC.
- G. Yang, A. I. Frenkel, D. Su and X. Teng, ChemCatChem, 2016, 8, 2876–2880 CrossRef CAS.
- Y. Qu, Y. Gao, L. Wang, J. Rao and G. Yin, Chem.–Eur. J., 2016, 22, 193–198 CrossRef CAS PubMed.
- X. Fan, M. Tang, X. Wu, S. Luo, W. Chen, X. Song and Z. Quan, J. Mater. Chem. A, 2019, 7, 27377–27382 RSC.
- L. Wang, W. Wu, Z. Lei, T. Zeng, Y. Tan, N. Cheng and X. Sun, J. Mater. Chem. A, 2020, 8, 592–598 RSC.
- L. Jiang, G. Sun, Z. Zhou, W. Zhou and Q. Xin, Catal. Today, 2004, 93–95, 665–670 CrossRef CAS.
- C. Chen, H. Xu, H. Shang, L. Jin, T. Song, C. Wang, F. Gao, Y. Zhang and Y. Du, Nanoscale, 2019, 11, 20090–20095 RSC.
- W. Du, G. Yang, E. Wong, N. A. Deskins, A. I. Frenkel, D. Su and X. Teng, J. Am. Chem. Soc., 2014, 136, 10862–10865 CrossRef CAS PubMed.
- J. Zhu, X. Zheng, J. Wang, Z. Wu, L. Han, R. Lin, H. L. Xin and D. Wang, J. Mater. Chem. A, 2015, 3, 22129–22135 RSC.
- W. Chen, Z. Lei, T. Zeng, L. Wang, N. Cheng, Y. Tan and S. Mu, Nanoscale, 2019, 11, 19895–19902 RSC.
- F. J. Rodríguez Varela and O. Savadogo, J. Electrochem. Soc., 2008, 155, B618–B624 CrossRef.
- L. Ma, X. Zhao, F. Si, C. Liu, J. Liao, L. Liang and W. Xing, Electrochim. Acta, 2010, 55, 9105–9112 CrossRef CAS.
- J. Shim, J. Lee, Y. Ye, J. Hwang, S. K. Kim, T. H. Lim, U. Wiesner and J. Lee, ACS Nano, 2012, 6, 6870–6881 CrossRef CAS.
- N. C. Cheng, J. Liu, M. N. Banis, D. S. Geng, R. Y. Li, S. Y. Ye, S. Knights and X. L. Sun, Int. J. Hydrogen Energy, 2014, 39, 15967–15974 CrossRef CAS.
Footnote |
| † Electronic supplementary information (ESI) available. See DOI: 10.1039/d1na00314c |
| This journal is © The Royal Society of Chemistry 2021 |

