 Open Access Article
Electrical response of organic molecule supported preformed and in situ formed antimony sulfide nanoparticles under frequency conditions†
Sarit K.
Ghosh
,
Venkata K.
Perla
and
Kaushik
Mallick
 *
*
Department of Chemical Sciences, University of Johannesburg, P. O. Box: 524, Auckland Park, 2006, South Africa. E-mail: kaushikm@uj.ac.za
First published on 6th August 2021
Abstract
A complexation route mediated synthesis of orthorhombic antimony sulfide nanoparticles is described in this report where uniformly distributed particles within the size range of 2–12 nm are stabilized within the aniline matrix. The organic–inorganic hybrid system was investigated for dielectric capacitance and electric field-induced polarization performances under varying temperature and frequency conditions. The AC-conductivity revealed a correlated barrier hopping conduction mechanism in the hybrid system. A fatigue free polarization was achieved under the electric field of 9 kV mm−1 for the preformed antimony sulfide system with a stable value of 0.18 μC cm−2. The in situ dielectric capacitance and field dependent polarization measurements were also performed for the in situ synthesized antimony sulfide using the antimony–aniline complex as the precursor.
1. Introduction
The organic–inorganic hybrid system has received extensive attention for a wide range of applications, such as energy storage, chemical sensors and catalysis.1–3 The hybrid material represents the interface between two separate types of material that can demonstrate better properties compared with their individual components. The system acquires good stability and different physical properties from the inorganic counterpart and easy processing and flexibility from the organic counterpart.4Among the various inorganic systems, metal oxides and sulfides are often reported for diverse applications. Several metal oxide nanomaterials exhibited outstanding physical, chemical and biological properties and play an important role in gas sensors, fuel cells, advanced ceramics, chemical sensors, biosensors, batteries, solar cells, pyroelectrics, supercapacitors, catalysts, and anticorrosion coating applications.5 In a similar way, nanostructured metal sulfides have been extensively studied and their potential applications have been reported in a variety of fields, such as solar cells, light-emitting diodes, sensors, thermoelectric devices, lithium-ion batteries, fuel cells and nonvolatile memory devices.6–8 Some of the metallic sulfides, such as one dimensional zinc and cadmium sulfides have been reported for various optoelectronic applications, such as optical waveguides, field-effect transistors, lasers, solar cells, photodetectors, and light emitting diodes.9,10 The magnetic susceptibility measurement of various phases of cobalt sulfides exhibited temperature-independent paramagnetism.11 Gallium doped zinc sulfide nanomaterials have the potential to serve as photocatalysts for the degradation of organic pollutants in water.12 It has been reported that nickel sulfide and copper sulfide nanowire arrays grown on a metal current collector substrate can function as a working cathode for lithium-ion batteries.13,14 A copper sulfide embedded carbon nitride thin film based device exhibited nonvolatile resistive switching behaviour and the transport mechanism of the device was followed by Poole–Frenkel and ohmic behaviour for the OFF-state and ON-state, respectively, with an ON to OFF ratio of 104.15
The sulfides of other non-transition elements, such as tin, lead and bismuth sulfides are well explored and exhibited good photocatalytic, photovoltaic and energy storage performances.16–21 Apart from those, antimony sulfide has also received attention as a potential candidate for the anode material in sodium and lithium ion battery applications due to its high specific capacity value.22–25 Antimony sulfide was reported as a Janus catalyst for the selective nitrogen reduction reaction26 and also as a photovoltaic absorber material.27 There are some reports also available in the literature where antimony based hybrid systems are employed for electronic applications. The antimony–phosphorus based field effect transistor has been reported for light detecting sensor application.28 The effectiveness of solar cells has been improved for light induced electrical signals by using an antimony doped perovskite halide system.29,30 Our recent studies also demonstrated the light sensitive resistive switching behaviour of antimony-sulfide based materials where the device exhibited unipolar and bipolar switching behaviour under two different optical conditions with a moderately high ON to OFF ratio.31
The dielectric capacitance and field induced polarization behaviour of antimony based materials either in the bulk or nano-form has been neglected in the literature. In this study, we report a complexation mediated synthesis of aniline stabilized antimony sulfide nanoparticles by applying a one pot, two step preparation protocol. The synthesis method involved the formation of the antimony(III)–aniline complex followed by the addition of sodium sulfide (sulphur source). The aniline molecule stabilized antimony sulfide, preformed antimony sulfide, was investigated for dielectric capacitance and field induced polarization performances under varying temperature and frequency conditions. The dielectric capacitance and polarization performances of the antimony–aniline complex during the addition of sodium sulfide (in situ formation of antimony sulfide) were also investigated.
2. Experimental
2.1 Materials
In this study, all chemical chemicals (SbCl3, Na2S and aniline) were purchased from Sigma-Aldrich and applied without further purification.2.2 Synthesis of aniline stabilized antimony sulfide nanoparticles
For the synthesis of aniline stabilized antimony sulfide nanoparticles, 1.0 mL of aniline was diluted in 10 mL of methanol. To this methanolic solution, 0.456 g of SbCl3 (dissolved in methanol with a concentration of 0.2 mol dm−3) was added and a white precipitate, antimony–aniline complex, was formed, immediately. A solution of sodium sulfide (0.047 g in 3.0 mL of distilled water) was added dropwise to the above precipitate and the colour of the precipitate turned orange. The orange coloured precipitate was filtered, and the solid mass was dried at 80 °C for 2 h under vacuum. The dried powder material (aniline stabilized antimony sulfide) was used for microscopy, surface and electrical characterization.2.3 Device fabrication
Initially, a slurry, made with aniline stabilized antimony sulfide and chloroform (as a solvent), was deposited using a drop and dry method in the form of a film (∼100 μm) on a copper plate. The copper plate was dried on a hot plate for 30 minutes and then a gold electrode was printed on the top of the film using the physical vapour deposition technique (EMSCOPE SC 500).2.4 Material characterization
Microscopy study was performed using a JEOL (JEM-2100) transmission electron microscope (TEM). The X-ray diffraction (XRD) pattern of the synthesized material was obtained using a Philips PANalytical X'pert diffractometer using Cu-Kα radiation. The dielectric constant, AC-conductivity and impedance spectra were measured with an HP 4284A LCR meter under varying temperature (from 30 to 70 °C) and frequency (from 100 Hz to 1 MHz) conditions. Polarization hysteresis studies were performed using a modified Sawyer–Tower circuit (PolyK Technologies), where the sample was subjected to a triangular wave with a varying frequency from 1–10 Hz.3. Results and discussion
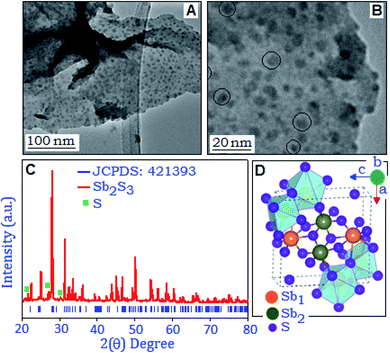
Fig. 1(A and B) show the transmission electron microscopy images of the synthesized product with different magnifications. The dark spots in the TEM images are antimony sulfide nanoparticles stabilized by the organic matrix. The uniformly distributed particles are within the size range of 2–12 nm and some of the individual nanoparticles are displayed within the circles (Fig. 1B). The X-ray diffraction pattern of the aniline stabilized antimony sulfide was recorded within the range (2θ) from 20° to 80°, Fig. 1C. From the figure it is evident that the major diffraction peaks are matched with the orthorhombic phase of Sb2S3, (JCPDS: 421393, space group: Pbnm) with lattice constant values of 11.23, 11.31 and 3.84 Å for a, b and c, respectively. Some low intensity diffraction peaks, positioned at 21.6°, 27.1° and 30.1°, correspond to the orthorhombic phase of sulphur (JCPDS: 740791), formed during the synthesis process. For the current system, the evidence of any secondary peak was not observed within the detection limit of the XRD spectra, suggesting that the final composition belongs to the Sb2S3. The sharp and well defined diffraction peaks revealed the crystalline nature of the synthesized material. Fig. 1D illustrates the unit cell representation of the layered structure of Sb2S3 which is projected perpendicular along the b-axis.32 In the structure, the cations Sb3+ are present at two different Wyckoff sites (Sb1 and Sb2) and coordinated with the sulfide (S2−) ion in a distorted seven fold SbS7 network.3.1Field induced polarization and electrical studies of the preformed antimony sulfide system
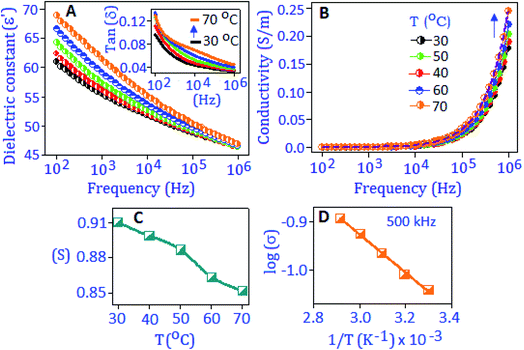
The broadband dielectric spectroscopic technique was applied to measure the dielectric constant (ε′), dielectric loss factor (tan![[thin space (1/6-em)]](https://www.rsc.org/images/entities/char_2009.gif) δ), and conductivity (σac) performance of the synthesized material. The dielectric constant, ε′ = Cd/ε0A was extracted from the capacitance (C) value, where ε0 is the dielectric constant of free space, ‘d’ is the thickness of the material and ‘A’ is the area of the working electrode. Fig. 2A exhibits the dielectric constant of the preformed Sb2S3 nanomaterial, measured under different temperature conditions (from 30 °C to 70 °C) within the frequency range from 100 Hz to 1 MHz. It was observed that at low frequency the dielectric constant value was enhanced with temperature and attained a maximum value of ∼68 at 70 °C. The high value of dielectric constant at lower frequencies is due to the different types of polarization contributions (interfacial, dipolar, ionic and electronic) in the material.33 At high temperature, the space charge between the grain and grain boundary region is thermally activated and has switched the response along the direction of applied frequency.34 With increasing frequency, the dielectric constant value decreased, and this behavior indicates that the charge species were unable to follow the variation of high frequency. A similar behavior was observed for the dielectric loss factor with rising temperature and frequency conditions, as illustrated in Fig. 2A, inset. A hump like feature is observed at 70 °C in tan
δ), and conductivity (σac) performance of the synthesized material. The dielectric constant, ε′ = Cd/ε0A was extracted from the capacitance (C) value, where ε0 is the dielectric constant of free space, ‘d’ is the thickness of the material and ‘A’ is the area of the working electrode. Fig. 2A exhibits the dielectric constant of the preformed Sb2S3 nanomaterial, measured under different temperature conditions (from 30 °C to 70 °C) within the frequency range from 100 Hz to 1 MHz. It was observed that at low frequency the dielectric constant value was enhanced with temperature and attained a maximum value of ∼68 at 70 °C. The high value of dielectric constant at lower frequencies is due to the different types of polarization contributions (interfacial, dipolar, ionic and electronic) in the material.33 At high temperature, the space charge between the grain and grain boundary region is thermally activated and has switched the response along the direction of applied frequency.34 With increasing frequency, the dielectric constant value decreased, and this behavior indicates that the charge species were unable to follow the variation of high frequency. A similar behavior was observed for the dielectric loss factor with rising temperature and frequency conditions, as illustrated in Fig. 2A, inset. A hump like feature is observed at 70 °C in tan![[thin space (1/6-em)]](https://www.rsc.org/images/entities/char_2009.gif) (δ) curves at around 10 kHz, attributed to the thermally activated relaxation process in the material.
(δ) curves at around 10 kHz, attributed to the thermally activated relaxation process in the material.
To realize the relaxation process of the nanoparticles, the AC-conductivity of the material was calculated from the dielectric constant data, σac = 2πf × ε′ × tan![[thin space (1/6-em)]](https://www.rsc.org/images/entities/char_2009.gif) (δ), under different temperature conditions, Fig. 2B. Frequency independent behaviour is related to the DC-part of the conductivity process and associated with the boundary of the nanoparticle.35 On the higher frequency side, the frequency dependent behavior was observed that followed the Jonscher's power law, σac = σdc + A(T)ωS, where σdc is the frequency independent DC-part of the conductivity, A is the temperature dependent factor that determines the strength of the polarizability and ‘S’ is the frequency and temperature dependent parameter (0 < S < 1), which determines the conduction mechanism. It was reported that the polaronic type of charge carriers are responsible for the conduction process in sulfide based nanomaterials.36,37 The structural distortion and defect centers in the sulfide nanoparticles enhance the polaronic contribution, which is subject to temperature and change in dopant concentration.38–40 The variation of the ‘S’ parameter is shown in Fig. 2C and values of ‘S’ decrease with rising temperature, which revealed the correlated barrier hopping (CBH) conduction mechanism within the material. The thermal activation energy (Ea) of the material was calculated at 500 kHz using the Arrhenius relation; σ(T) = σ0
(δ), under different temperature conditions, Fig. 2B. Frequency independent behaviour is related to the DC-part of the conductivity process and associated with the boundary of the nanoparticle.35 On the higher frequency side, the frequency dependent behavior was observed that followed the Jonscher's power law, σac = σdc + A(T)ωS, where σdc is the frequency independent DC-part of the conductivity, A is the temperature dependent factor that determines the strength of the polarizability and ‘S’ is the frequency and temperature dependent parameter (0 < S < 1), which determines the conduction mechanism. It was reported that the polaronic type of charge carriers are responsible for the conduction process in sulfide based nanomaterials.36,37 The structural distortion and defect centers in the sulfide nanoparticles enhance the polaronic contribution, which is subject to temperature and change in dopant concentration.38–40 The variation of the ‘S’ parameter is shown in Fig. 2C and values of ‘S’ decrease with rising temperature, which revealed the correlated barrier hopping (CBH) conduction mechanism within the material. The thermal activation energy (Ea) of the material was calculated at 500 kHz using the Arrhenius relation; σ(T) = σ0![[thin space (1/6-em)]](https://www.rsc.org/images/entities/char_2009.gif) exp
exp![[thin space (1/6-em)]](https://www.rsc.org/images/entities/char_2009.gif) (−Ea/KBT), and is graphically presented in Fig. 2D. A linear fit to the equation (log
(−Ea/KBT), and is graphically presented in Fig. 2D. A linear fit to the equation (log![[thin space (1/6-em)]](https://www.rsc.org/images/entities/char_2009.gif) σ vs. 1/T) delivers the value of Ea (activation energy) ∼34 meV.
σ vs. 1/T) delivers the value of Ea (activation energy) ∼34 meV.
The impedance property of the synthesized nanoparticle is presented in Fig. 3 for the selected temperatures (30 °C and 70 °C). The figure shows that the real part (Z′) of the impedance decreases with rising temperature and the values are merged towards the higher frequency region. The phase as a function of frequency diagram (Bode-plot), with rising temperature (from 30 to 70 °C), confirms the existence of low frequency dispersion, usually obtained from the grain (nanoparticle) boundary,35Fig. 3, inset. The overall impedance performances revealed the negative temperature coefficient resistive behaviour.38
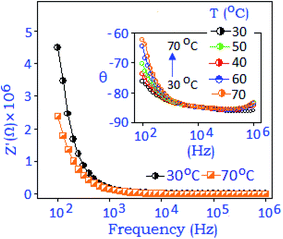 | ||
| Fig. 3 Real part of the impedance spectra (Z′) recorded at 30 °C and 70 °C and the inset represents the phase (θ) angle variation with respect to frequency with rising temperature (arrow). | ||
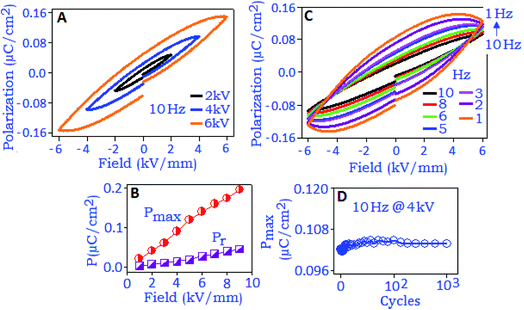
Fig. 4A exhibits the variation of polarization hysteresis loops measured under different field conditions (2, 4 and 6 kV mm−1) at the frequency of 10 Hz. The maximum polarization (Pmax) and remanent polarization (Pr) values increase with increasing electric field (from 1 to 10 kV mm−1), Fig. 4B. At 10 kV mm−1, the maximum polarization (Pmax) value was ∼0.22 μC cm−2 and the unsaturated polarization at the maximum applied field indicates the absence of polarization switching. The hysteresis loop also showed strong frequency dependence when measured under different frequency conditions (from 10 Hz to 1 Hz), Fig. 4C. An increasing trend of the values of Pmax, Pr and the area under the loop was noticed with decreasing frequency and this behavior can be related to the space charge polarization within the material.41 With the increase of electric field (E) the space charge accumulation will also increase along the field direction42 and the charge carrier species buildup at the nanoparticle surface and surrounding.43 When the applied frequency is low and the operational field is high, the amount of space charges will be high, which brings the polarization to a maximum value and consequently Pmax, Pr and area under the loop increased with decreasing frequency. The stability study of the device was performed at 4 kV mm−1 (field conditions) for 103 cycles, and the result revealed a fatigue free polarization performance with the value of ∼0.10 μC cm−2, Fig. 4D.
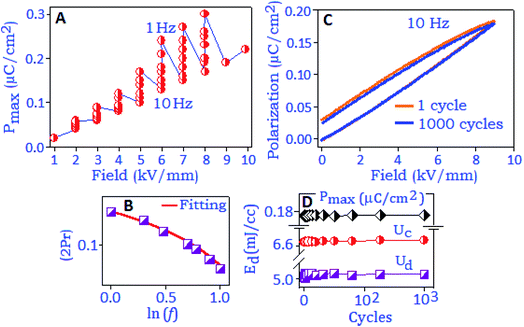
The variation of maximum polarization (Pmax) under different frequencies (from 1 Hz to 10 Hz) as a function of field (2–8 kV mm−1) is plotted in Fig. 5A. The polarization value increases with increasing electric field and reached the maximum value under the lowest frequency conditions, which are associated with a long response time for space charge carriers to align along the field direction. The remanent polarization (Pr and 2Pr) values are extracted from different frequency conditions during the depolarization process for the reverse field condition. The values decrease with increasing frequency and satisfied the power relation, (2Pr ∼ fβ), where ‘β’ is the frequency coefficient, Fig. 5B. The frequency dependent power relation for double remanent polarization (2Pr) has been applied to optimize the ferroelectric effect in thin film devices.44 With rising the frequency condition, the space charge polarization are not able to follow the direction of the electric field as a result the polarization value decreases.45 Such a reduction in Pr values is also associated with defects or vacancies of the particles that trapped the charge carriers, also reported for oxide based ferroelectric nanomaterials.46,47 The charge storage properties of the synthesized material were investigated with the unipolar hysteresis loop, Fig. 5C. The endurance performance of the material was tested for 103 cycles and the loop maintained the original pattern at the end of the cycling process. The polarization performance exhibited a fatigue-free behaviour with the Pmax value of ∼0.18 μC cm−2 at 9 kV mm−1, Fig. 5D. Room temperature charge–discharge performances of the material were calculated from the unipolar loop. The extracted energy densities for charging (Uc) and discharging (Ud) values are ∼6.6 mJ cc−1 and ∼5.0 mJ cc−1, respectively, at 9 kV mm−1, and maintained for 103 cycles, Fig. 5D.
3.2Field induced polarization and electrical studies of in situ formed antimony sulfide
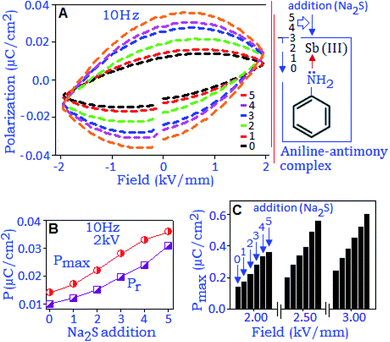
All the above-mentioned studies involved the preformed antimony sulfide nanoparticles. In the current section, we will discuss the field induced polarization and dielectric properties of the in situ formed antimony sulfide within the organic matrix. For this, the antimony–aniline complex was deposited in the form of a film on a copper disk using a drop and dry method. A gold electrode was deposited, using a sputter coating technique, on the top of the complex material. A methanolic solution of sodium sulfide (1.0 μL) with the concentration of 0.5 × 10⁻¹ mol dm−3 was added to the complex material (at the peripheral sites of the electrode) five consecutive times and in situ dielectric capacitance and field dependent polarization measurements were performed after each addition. The formation of antimony sulfide nanoparticles has been confirmed through the TEM analysis (Fig. S1, ESI†).Fig. 6A shows the change in the polarization loop pattern of the antimony–aniline complex for five successive additions of sodium sulfide. The black dashed-line represents the polarization hysteresis response of the antimony–aniline complex at 10 Hz, which was generated due to a weak dipolar type of interaction between the Sb3+ cation and the lone-pair of nitrogen (from aniline ligand). The gradual increment of the hysteresis loop after each addition of sodium sulfide indicates the enhancement of the dipole-induced charge trapping process due to the formation of more antimony sulfide atoms, with a stable dipole. An elliptical shape of the hysteresis loop revealed that the major contribution in the polarization process is due to the space charge formation and the presence of free Na+ ions induced the conductive nature under the applied electric field.48 The variation of Pmax and Pr with increasing concentration of sodium sulfide is presented in Fig. 6B. The polarization response was further analyzed under the electric fields of 2.0, 2.5 and 3.0 kV. Fig. 6C exhibits the variation of Pmax (extracted from each hysteresis loop, not shown in the figure), as a function of the electric field, due to the successive addition of sodium sulfide to the antimony–aniline complex and the formation of antimony sulfide.
The comparative polarization hysteresis loop of the preformed antimony sulfide nanoparticles and antimony–aniline complex is displayed in Fig. S2(A), ESI.† Higher values of polarization and coercive fields originated from the nanoparticle component, which are nearly 10-orders of magnitude higher than those of the antimony–aniline complex. The polarization behavior of the antimony–aniline complex was also investigated in the presence of methanol, as a control experiment. Fig. S2(B), ESI,† exhibits no significant change in the polarization hysteresis loop of the antimony–aniline complex in the presence of methanol.
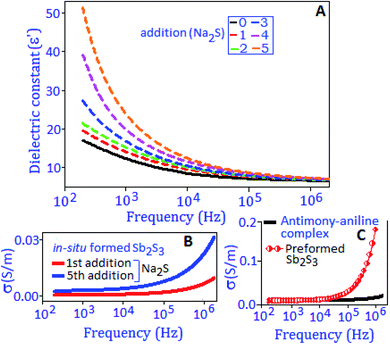
The charge storage ability and the charge migration mechanism of the in situ synthesized antimony sulfide nanoparticles were investigated by dielectric capacitance and AC-conductivity measurements. An identical protocol, as mentioned earlier, was applied for the addition of sodium sulfide to the antimony–aniline complex. Fig. 7A, black line, exhibits the graphical representation of the dielectric constant (ε′) as a function of the frequency of the antimony–aniline complex. After each addition of sodium sulfide to the complex the ε′ value increased and finally reached ∼50 @ 200 Hz, at the end of the fifth addition. Towards the low frequency range the high value of dielectric constant can be explained on the basis of interfacial polarization created by the trapped charges at the boundaries of aniline stabilized in situ formed antimony sulfide. The AC-conductivity behaviour (30 °C) of in situ formed Sb2S3 after the 1st and 5th addition of Na2S is presented in Fig. 7B. The conductivity behaviour of the preformed Sb2S3 and antimony–aniline complex is exhibited in Fig. 7C. The conductivity pattern shows dispersion behavior for all cases towards the higher frequency side and the frequency where the slope of the conductivity starts to change is recognized as hopping phenomena.35,38 Conductivity increases with the sequential addition of Na2S and followed a similar trend like the preformed antimony sulfide nanoparticles. The following two phenomena are responsible for the charge conduction process at high frequency: (i) the charge carrier species transfer through localized states, and (ii) freedom of the charge carrier species from different trapping sites.49
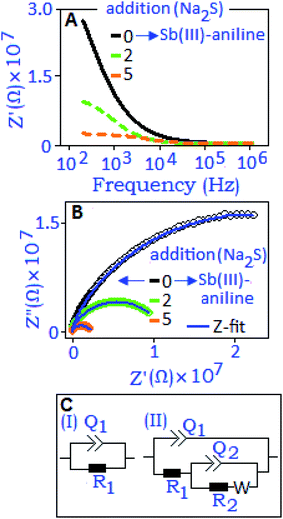
Impedance performance of the antimony–aniline complex, indexed as ‘0’ addition, and in situ formed Sb2S3 (for the 2nd and 5th addition of Na2S) has been illustrated in Fig. 8A. The magnitude of impedance (Z′) decreases with the increase of Na2S concentration which indicates the formation of space charge at the interfaces of the in situ formed antimony sulfide. In the Nyquist plots (Fig. 8B), semi-circular arcs were developed and shifted towards the high frequency region with increasing concentration of Na2S, due to the contribution of in situ formed antimony sulfide. Two different electrical circuits were used to model the Nyquist plots. Fig. 8C(I) presents the R1Q1 component connected in parallel combination that describes the antimony–aniline complex (‘0’ addition) system where we assumed a non-deal capacitance (Q) behavior for the antimony–aniline complex. With the addition of Na2S in the complex, the nascent antimony-sulfide nanoparticles introduced an additional contribution in the material which is assigned as the R2Q2 component in the electrical circuit, Fig. 8C(II). The Warburg diffusive component (W) was also introduced in the circuit to correlate the diffuse behavior of the untreated Na+ ions during the in situ process. The extracted parameters for the various additions of Na2S to the antimony–aniline complex and antimony–aniline complex (‘0’ addition) are listed in Table S1, ESI.† From the extracted parameters, it was evident that with decreasing the resistance values (R1 and R2) the capacitive values (Q1 and Q2) were increasing with increasing the concentration of Na2S, as graphically illustrated in Fig. S3, ESI.† The increment of capacitance (Q) values with increasing concentration of Na2S revealed the formation of space charge polarization. The increment is more distinct for Q2 which was due to the accumulation of more trapped charges at the material interfaces.
4. Conclusion
The electrical response of preformed and in situ formed antimony sulfide nanoparticles was investigated using dielectric capacitance and field induced polarization techniques. In preformed nanoparticles, the capacitance and polarization hysteresis performances were enhanced with rising temperature and followed a correlated barrier hopping mechanism in the conductivity process. Polarization stability was achieved for 103 switching cycles for the preformed nanoparticles under 9 kV mm−1 field conditions. The in situ formation of antimony sulfide nanoparticles during the reaction between the antimony–aniline complex and sodium sulfide was also detected via polarization and capacitance measurements. The change of impedance of the system during the in situ process was correlated with trapping and de-trapping of charge carriers across the localized states and that modelled to a single equivalent electrical circuit. The current study involved sulfide ion recognition using in situ capacitance and field induced polarization measurement techniques and has the potential for chemical sensor application.Conflicts of interest
No conflicts of interest to declare.Acknowledgements
This study was supported by the Faculty of Science, University of Johannesburg.References
- S. K. Ghosh, V. K. Perla and K. Mallick, Phys. Chem. Chem. Phys., 2020, 22, 3345–3351 RSC.
- M. Choudhary, S. Shukla, A. Taher, S. Siwal and K. Mallick, ACS Sustainable Chem. Eng., 2014, 2, 2852–2858 CrossRef CAS.
- D. Nandi, V. K. Perla, S. K. Ghosh, C. Arderne and K. Mallick, Sci. Rep., 2020, 10, 16720 CrossRef CAS PubMed.
- S. H. Mir, L. A. Nagahara, T. Thundat, P. M. Tabari, H. Furukawa and A. Khosla, J. Electrochem. Soc., 2018, 165, B3137–B3156 CrossRef CAS.
- S. S. Prasanna, K. Balaji, S. Pandey and S. Rana, in Nanomaterials and polymer nanocomposites, ed. N. Karak, Elsevier, 2019, vol. 1, pp. 123–144 Search PubMed.
- Y. Wu, C. Wadia, W. L. Ma, B. Sadtler and A. P. Alivisatos, Nano Lett., 2008, 8, 2551–2555 CrossRef CAS PubMed.
- T. L. Li, Y. L. Lee and H. S. Teng, J. Mater. Chem., 2011, 21, 5089–5098 RSC.
- M. J. Bierman and S. Jin, Energy Environ. Sci., 2009, 2, 1050–1059 RSC.
- L. Li, P. Wu, X. Fang, T. Zhai, L. Dai, M. Liao, Y. Koide, H. Wang, Y. Bando and D. Golberg, Adv. Mater., 2010, 22, 3161–3165 CrossRef CAS PubMed.
- J. F. Hall, J. Opt. Soc. Am., 1956, 46, 1013–1015 CrossRef CAS.
- R. F. Heidelberg, A. H. Luxem, S. Talhouk and J. J. Banewicz, Inorg. Chem., 1996, 5, 194–197 CrossRef.
- M. Y. Lu, M. P. Lu, Y. A. Chung, M. J. Chen, Z. L. Wang and L. J. Chen, J. Phys. Chem. C, 2009, 113, 12878–12882 CrossRef CAS.
- C. H. Lai, K. W. Huang, J. H. Cheng, C. Y. Lee, B. J. Hwang and L. J. Chen, J. Mater. Chem., 2010, 20, 6638–6645 RSC.
- C. H. Lai, K. W. Huang, J. H. Cheng, C. Y. Lee, W. F. Lee, C. T. Huang, B. J. Hwang and L. J. Chen, J. Mater. Chem., 2009, 19, 7277–7283 RSC.
- V. K. Perla, S. K. Ghosh and K. Mallick, Mater. Adv., 2020, 1, 228–234 RSC.
- M. Cheraghizade, F. J. Sheini, R. Yousefi, F. Niknia, M. R. Mahmoudian and M. Sookhakian, Mater. Chem. Phys., 2017, 195, 187–194 CrossRef CAS.
- K. Liang, L. Ju, S. Koul, A. Kushima and Y. Yang, Adv. Energy Mater., 2019, 9, 1802543 CrossRef.
- H. Jahromi and M. Moaddeli, Mater. Res. Express, 2019, 6, 116220 CrossRef.
- A. Lemsi, D. C. Morcoso, M. Haro, C. G. Barrachina, C. Aranda, H. M. Meherzi, M. G. Tecedor, S. Giménez and B. J. López, Energy Technol., 2020, 8, 2000301 CrossRef CAS.
- H. Demir, Ö. Şahin, O. Baytar and S. Horoz, J. Mater. Sci.: Mater. Electron., 2020, 31, 10347–10354 CrossRef CAS.
- A. Moyseowicz, J. Solid State Electrochem., 2019, 23, 1191–1199 CrossRef CAS.
- M. Deng, S. Li, W. Hong, Y. Jiang, W. Xu, H. Shuai, H. Li, W. Wang, H. Hou and X. Ji, RSC Adv., 2019, 9, 15210–15216 RSC.
- J. Li, D. Yan, X. Zhang, S. Hou, D. Li, T. Lu, Y. Yao and L. Pan, Electrochim. Acta, 2017, 228, 436–446 CrossRef CAS.
- X. Zhou, L. Bai, J. Yan, S. He and Z. Lei, Electrochim. Acta, 2013, 108, 17–21 CrossRef CAS.
- P. V. Prikhodchenko, J. Gun, S. Sladkevich, A. A. Mikhaylov, O. Lev, Y. Y. Tay, S. K. Batabyal and D. Y. W. Yu, Chem. Mater., 2012, 24, 4750–4757 CrossRef CAS.
- H. Nan, Y. Liu, Q. Li, P. Shena and K. Chu, Chem. Commun., 2020, 56, 10345–10348 RSC.
- Y. Zeng, K. Sun, J. Huang, M. P. Nielsen, J. F. Ji, C. Sha, S. Yuan, X. Zhang, C. Yan, X. Liu, H. Deng, Y. Lai, J. Seidel, N. E. Daukes, F. Liu, H. Song, M. Green and X. Hao, ACS Appl. Mater. Interfaces, 2020, 12, 22825–22834 CrossRef CAS PubMed.
- F. Baumer, Y. Ma, C. Shen, A. Zhang, L. Chen, Y. Liu, D. Pfister, T. Nilges and C. Zhou, ACS Nano, 2017, 11, 4105–4113 CrossRef CAS PubMed.
- Y. C. Choi and K. W. Jung, Nanomaterials, 2020, 10, 2284 CrossRef CAS PubMed.
- C. E. A. Grigorescu and R. A. Stradling, Thin Films, 2001, 28, 147–191 CrossRef CAS.
- V. K. Perla, S. K. Ghosh and K. Mallick, J. Mater. Chem. C, 2021, 9, 6904–6910 RSC.
- I. Efthimiopoulos, C. Buchan and Y. Wang, Sci. Rep., 2016, 6, 24246 CrossRef CAS PubMed.
- J. N. Wilson, J. M. Frost, S. K. Wallace and A. Walsh, APL Mater., 2019, 7, 010901 CrossRef.
- B. Wang, W. Huang, L. Chi, M. Hashimi, T. J. Marks and A. Facchetti, Chem. Rev., 2018, 118, 5690–5754 CrossRef CAS PubMed.
- F. Rehman, J. Li, J. Zhang, M. Rizwan, C. Niu and H. Jin, J. Appl. Phys., 2015, 118, 214101 CrossRef.
- A. Chandran, S. Samuel, J. Koshy and K. George, J. Appl. Phys., 2011, 109, 084314 CrossRef.
- H. Ali, S. Karim, M. Rafiq, K. Maaz, A. Rahman, A. Nisar and M. Ahmad, J. Alloys Compd., 2014, 612, 64–68 CrossRef CAS.
- A. Jamil, S. S. Batool, F. Sher and M. A. Rafiq, AIP Adv., 2016, 6, 055120 CrossRef.
- K. Shimakawa, Philos. Mag. B, 1982, 46, 123–135 CAS.
- W. S. Choi, H. K. Yoo and H. Ohta, Adv. Funct. Mater., 2015, 25, 799–804 CrossRef CAS.
- X. Chen, X. Dong, F. Cao, J. Wang and G. Wang, J. Am. Ceram. Soc., 2014, 97, 213–219 CrossRef CAS.
- M. Vollman and R. Waser, J. Am. Ceram. Soc., 1994, 77, 235–243 CrossRef CAS.
- D. Fu, K. Suzuki and K. Kato, Integr. Ferroelectr., 2004, 61, 19–23 CrossRef CAS.
- A. Tagantsev, C. Pawlaczyk, K. Brooks, M. Landivar, E. Colla and N. Setter, Integr. Ferroelectr., 1995, 6, 309–320 CrossRef CAS.
- Y. Ishibashi and H. Orihara, Integr. Ferroelectr., 1995, 9, 57–61 CrossRef.
- J. F. Scott, Integr. Ferroelectr., 2016, 12, 71–81 CrossRef.
- D. Guo, C. Wang, Q. Shen, L. Zhang, M. Li and J. Liu, Appl. Phys. A: Mater. Sci. Process., 2009, 97, 877–881 CrossRef CAS.
- L. Jin, F. Li and S. Zhang, J. Am. Ceram. Soc., 2014, 97, 1–27 CrossRef CAS.
- V. I. Arkhipov, P. Heremans, E. V. Emelianova and H. Bässler, Phys. Rev. B: Condens. Matter Mater. Phys., 2005, 71, 045214 CrossRef.
Footnote |
| † Electronic supplementary information (ESI) available. See DOI: 10.1039/d1na00361e |
| This journal is © The Royal Society of Chemistry 2021 |

