
 Open Access Article
 This Open Access Article is licensed under a Creative Commons Attribution-Non Commercial 3.0 Unported Licence
Towards a framework for evaluating and reporting Hansen solubility parameters: applications to particle dispersions†
Shalmali
Bapat
 a,
Stefan O.
Kilian
b,
Hartmut
Wiggers
bc and
Doris
Segets
*ac
a,
Stefan O.
Kilian
b,
Hartmut
Wiggers
bc and
Doris
Segets
*ac
aProcess Technology for Electrochemical Functional Materials, Institute for Combustion and Gas Dynamics–Reactive Fluids (IVG–RF), University of Duisburg–Essen (UDE), Duisburg, Germany
bInstitute for Combustion and Gas Dynamics–Reactive Fluids (IVG–RF), University of Duisburg–Essen (UDE), Duisburg, Germany
cCenter for Nanointegration Duisburg – Essen (CENIDE), Duisburg, Germany
First published on 17th June 2021
Abstract
A thorough understanding of complex interactions within particulate systems is a key for knowledge-based formulations. Hansen solubility parameters (HSP) are widely used to assess the compatibility of the dispersed phase with the continuous phase. At present, the determination of HSP is often based on a liquid ranking list obtained by evaluating a pertinent dispersion parameter using only one pre-selected characterization method. Furthermore, one cannot rule out the possibility of subjective judgment especially for liquids for which it is difficult to decipher the compatibility or underlying interactions. As a result, the end value of HSP might be of little or no information. To overcome these issues, we introduce a generalized and technology-agnostic combinatorics-based procedure. We discuss the principles of the procedure and the implications of evaluating and reporting particle HSP values. We demonstrate the procedure by using SiNx particles synthesized in the gas phase. We leverage the analytical centrifugation data to evaluate stability trajectories of SiNx dispersions in various liquids to deduce particle-liquid compatibility.
1. Introduction
The genesis of ink and slurry formulations, constituting functional nano- to micron-scale particles that are dispersed in solvent(s) along with additives, has mainly been in the empirical domain. Such dispersions are ubiquitous in the production of electrochemical energy conversion and storage devices, e.g., in catalyst layers of fuel cells1 and electrolyzers,2 electrodes of Li-ion batteries3etc. To have control over dispersion quality, the choice of the right dispersion procedure is indispensable. Previous studies report significant impact of dispersion methods on end-product properties.4–7 For instance, Wang et al.8 systematically studied the effect of mixing methodology on the fuel cell performance. Pollet and co-workers9–11 highlighted the importance of the most commonly used ultrasound technique during ink formulation. Understanding the interactions of particles, stabilizing agents,12 and solvents13 which themselves can act as a ligand and coordinate or interact with the particle surface14,15 and how these interactions influence the function and performance of the end-product has been a central pursuit for research and industry alike.16 In making any formulation, several decision steps are required to narrow down to the best recipe. For instance, (a) which solvent or mixture of solvents yields desirable dispersion stability, (b) what additives (e.g., polymeric surfactants or inorganic pigments), impart stabilizing properties, (c) what solvent or particle concentrations are adequate, (d) what recipes are cost-effective and environmentally sustainable. To assist in enabling rational choices for the above-listed decision steps, the use of Hansen solubility parameters (HSP) is a promising approach. Although being quite mature for polymers and molecules, HSP in the context of (nano)particles are clearly less developed. We identify two reasons. Firstly the general issue of dispersity and heterogeneity of the materials where hybrids and composites are becoming increasingly important and secondly, the handling issues that complicate the proper execution of experiments. Both result in a demand for non-subjective decision-making and well-defined standards and procedures.1.1 Theory of Hansen solubility parameters (HSP)
With the principle of “like dissolves like”, the HSP method developed by Charles M. Hansen17 provides a quantitative appraisal of the compatibility of the dispersed phase with the continuous phase. The reader is referred to extensive prior work for in-depth theoretical background of the HSP methodology.18 Briefly, the solubility (or dispersibility) interaction is described using the dispersion energy (δD), polar-dipolar energy (δP), and hydrogen bonding energy (δH), all expressed per molar volume, in MPa1/2. Originally developed to study the extent of the solubility of polymers in various solvents, the method has been extended to evaluate HSP for solute particles. The three axes, corresponding to δD, δP, and δH, constitute the Hansen space in which a solvent is represented as a point, and a solute is represented as a volume, typically as a sphere, known as the Hansen sphere (see Fig. 1).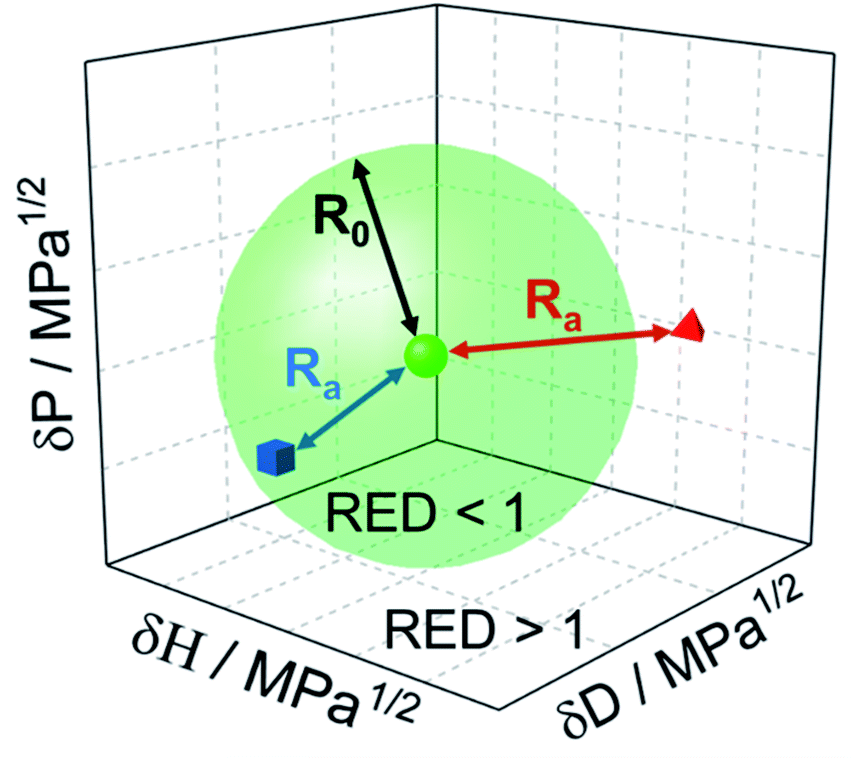 | ||
| Fig. 1 3-Dimensional Hansen space with axes representing three energy contributions δD, δP, and δH. The solute is located at the center of the sphere of radius R0, with poor liquid (red tetrahedron) outside the sphere and good liquid (blue cube) inside the sphere. | ||
Consider a solvent is located at the point (δD1,δP1,δH1), and the solute is indicated with a sphere of radius R0 and center (δD2,δP2,δH2). Then the interaction between the solvent and solute is expressed as Ra and can be calculated using the modified distance formula in eqn (1). The parameter RED, which describes the relative energy difference of the system, can be evaluated as the ratio of Ra and R0, as per eqn (2). Solvents with RED >1 will ideally be located outside the sphere indicating poor solute–solvent affinity (the red tetrahedron in Fig. 1), and conversely, solvents with RED <1 will be located inside the sphere indicating good solute–solvent interaction (the blue cube in Fig. 1).
| R2a = 4(δD1 − δD2)2 + (δP1 − δP2)2 + (δH1 − δH2)2 | (1) |
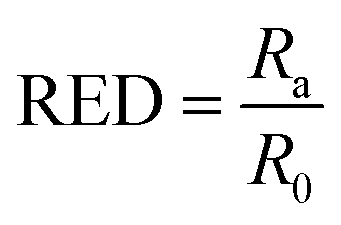 | (2) |
Using the known solubility parameters of “N” solvents, a numerical method is applied to find an extremum of an objective function (or a fitness function) in a three-dimensional space, which is essentially solving for the coordinates and radius of the Hansen sphere. For HSP calculations, algorithms such as Nelder-Mead Simplex,19,20 genetic algorithms,21,22 among others, can be employed for optimization routines as custom scripts or implemented through widely used software tools like HSPiP,23–32 or Microsoft® Excel sheets.33 Regardless of the numerical method, a fitness function of the form G(δD, δP, δH, R0) as shown in eqn (3) can be written. Then gi is calculated depending on the optimization algorithm.20
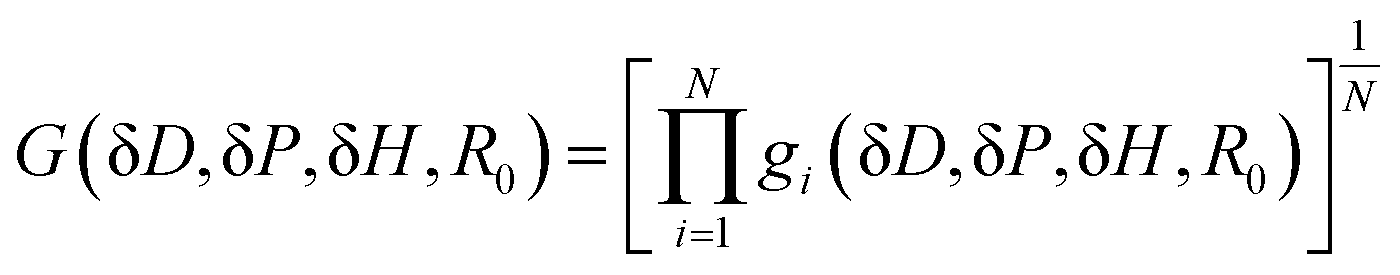 | (3) |
Further, in solving the fitness function, there is a need to define constraints, e.g., the Hansen sphere radius cannot be zero. Additionally, a set of solvents should be defined which are to be encompassed by the Hansen sphere (good solvents as 1), and to be excluded (poor solvents as 0).
To arrive at the HSP values, the objective of an optimization routine is (i) to maximize the fitness function (eqn (3)), (ii) minimize R0, (iii) while avoiding both any wrongly included poor solvents inside the Hansen sphere and (iv) wrongly excluded good solvents outside the Hansen sphere. The key to a consistent HSP value is that all these factors are met simultaneously. Thus far, we can appreciate the fact that obtaining a reliable HSP value is sensitive to convergence to an extremum in a multi-dimensional space. Before continuing the discussions on the nuances of HSP evaluation and the aspects to be considered, we switch to a brief overview of some representative particle HSP studies in the literature.
2. HSP for particles
In the context of particle dispersibility, the resulting parameters can also be referred to as HDP (Hansen dispersibility parameters). While this contentious terminology might be more intuitive from the perspective that particles do not dissolve in solvents, the basis for adopting them is weakly justified.34 The reader is referred to Abbott's work for in-depth discussion and reasoning behind the adoption of different terminologies.35 Also suggested by Abbott, HSP can be thought of as Hansen similarity parameters.35 Hence, in this communication, we will refer to the HSP of particles. Furthermore, whenever particles are discussed, we refer to solvents as liquids.For evaluation of HSP of particles, they are typically dispersed in several probe liquids (PLs) of interest, and their dispersion behavior is characterized. The premise behind it is that if the particle is well-dispersed in a set of liquids (good liquids), their HSP values will be closer together. Conversely, the particle HSP is further away from that of the liquids (poor liquids) when they do not demonstrate desirable dispersibility.
2.1 Related work
Wieneke et al.29 reported HSP values of TiO2 nanoparticles (NPs) by investigating the dispersion quality using dynamic light scattering (DLS) and visual inspection. Similar methods were adopted by Sehlleier et al.30 to identify the best suited porogenic liquid for the synthesis of a silicon/carbon composite material. Fujiwara et al.28 reported HSP values and dispersibility of copper particles before and after various surface treatments using DLS. Choi et al.32 studied the dispersibility of ZnO NPs for photovoltaic applications using induction-coupled plasma mass spectroscopy. However, the role of subjectively scoring some of the liquids leading to unreliable HSP values has been a topic of contention.To alleviate issues of subjectivity, Süβ et al.23 proposed a methodology to first rank liquids based on relative sedimentation times (RSTs), and then incrementally classify liquids as good, referred herein as the successive scoring method. The work describes the calculation of HSP for a commercial carbon black (Printex® L, Evonik Industries), using fourteen PLs and dispersion characterization by means of analytical centrifugation (AC). Using an intelligently guessed value for integral extinction (IE), corresponding RSTs were calculated based on which all liquids were ranked. To start out, HSP was calculated with the top two liquids with the highest RST, chosen as good, and the rest chosen as poor. Then the HSP was calculated based on three liquids scored as good and the rest as poor. This process was repeated until only one liquid was scored as poor. As a result, twelve HSP values were obtained. The final reported HSP was the one where the HSP values plateau, i.e., do not change upon further addition of good liquids. In subsequent studies, the described method was applied to other particulate systems such as ZnO quantum dots24 and SiO2 particles.25 However, intricacies in choosing an appropriate IE threshold can impact the ranking order based on RSTs. Indeed, what stands out in these reports is the endeavor of non-subjective ranking and the power of AC to study sedimentation behavior and assess dispersion stability in an accelerated manner.
Recently, Fairhurst et al.31 reported the applicability of the NMR relaxation technique as an advantageous method to select suitable liquids for initial wetting and dispersing zinc and aluminium oxides. Herein, twelve liquids were ranked based on relaxation numbers (RN), and then HSP was calculated by incrementally scoring liquids as good. The reported HSP was the center of the best-fit sphere drawing boundaries between good and poor liquids.
Some commonalities across the above-discussed methods are – (i) the reliance on one characterization method only and/or (ii) reporting a definitive ranking order (or grouping list) based on an appropriate parameter (e.g., RST or RN). Often, the information derived from tracking only one parameter from one type of measurements to decide which liquid is good and which is poor will be restricted. Perhaps we can only conclusively deduce about “some” liquids but are required to classify “all” the liquids as 0 or 1, bringing in subjective judgment.36 Certainly, another characterization method can yield another appropriate parameter to rank the liquids. As a result, the HSP values can arguably change based on the characterization technique or measured parameter, leaving no standard methodology to evaluate and report HSP. What lacks currently is a technology-agnostic framework for evaluating and reporting HSP for particles that can be generalized and extended to any measurement platform or ranking procedure. Noteworthy, such a framework would also provide huge advantages as different materials might require different characterization techniques based on their disperse and physico-chemical properties.
2.2 What this work is about
Recollecting our discussion on the HSP calculation procedure, the successive scoring method, ranking liquids as good until a stable HSP (plateau) is obtained can also be susceptible to errors due to artefacts in non-convergence of optimization routines. So far, a systematic understanding of how the optimization surface changes with the addition of each good liquid is missing. Aspects such as – if the extremum indeed exists or whether the applied constraints are necessary and/or sufficient question the reliability of the converged extremum. It is almost serendipitous that for a particular set of particle systems (e.g., Printex® L carbon black) and liquids, a stably converged HSP is available. In fact, when the said procedure is applied to ZnO quantum dots,24 the authors caution the reader on the calculated HSP, as many good liquids are wrongly allocated outside the Hansen sphere. In summary, building a consensus on the usefulness of the successive scoring method as a generalized standard approach can be difficult though it is certainly an important cornerstone in the endeavor of getting rid of too often prevailing subjectivity.To this end, this work touches on three main aspects. First, we describe a new combinatorics-based procedure as a general framework for HSP calculations in order to embrace the ambiguity in evaluating good or poor liquids. Second, we discuss the nuances of evaluating and reporting particle HSP values and their ramifications on the quality and reliability of the said value. Third, we leverage the measurement results from an AC device and evaluate stability trajectories to deduce liquid compatibility. To demonstrate and discuss these three aspects, we investigate the HSP of SiNx NPs as a running case example. SiNx NPs were chosen as a technically relevant model system because of their promising use-case in Li-ion batteries to give improved long-term cyclability and stability.37–39
3. Experimental section for case example
SiNx NPs were prepared by pyrolyzing SiH4 in the presence of NH3 in the gas phase (see ESI† methods for details of the particle synthesis), followed by dispersing the sieved powder (Mesh-270, 63 μm) into twelve PLs (see Table 1 for the list of liquids used here) and finally characterized using an AC device LUMiSizer® (LUM GmbH, Berlin, Germany). The primary particle size range (30–300 nm)39 was large enough that no size-dependent dispersion effects were observed.40 As-synthesized particles were “clean” without ligands or other residuals due to the high reaction temperature (900 °C), however, they might be slightly oxidized at the surface due to handling at ambient conditions.39 Throughout all experiments, the particles were dispersed in ultrapure liquids without the addition of ligands/surfactants. Details on the dispersion preparation and AC measurements are provided in the supplementary methods. As explicitly studying the effects of dispersion parameters is out of the scope of current work, we did not change it throughout this work. ESI Fig. S1† shows scanning electron microscopy micrographs of the particles in six PLs, namely Ace, DAA, EtOH, NMP, Tol, and water.| Liquids | Abbreviation |
|---|---|
| Acetone | Ace |
| Diacetone alcohol | DAA |
| Ethanol | EtOH |
| Ethyl acetate | EA |
| Hexane | Hex |
| 2-Propanol | IPA |
| Methanol | MeOH |
| N-Methyl-2-pyrrolidone | NMP |
| Propylene carbonate | PC |
| Tetrahydrofuran | THF |
| Toluene | Tol |
| Water | — |
4. Case example using the successive scoring approach
We first attempt to evaluate HSP using the successive scoring approach to demonstrate its limitations. The IE plot (ESI Fig. S2†) exemplifies the first set of intricacies involved in making an intelligent guess on a threshold IE value. Further, on incrementally adding good liquids, there is no clear plateau, and a minimum is achieved when eleven of the twelve liquids are scored as good (see ESI Fig. S3 and Table S2†). Reporting the corresponding HSP value can be misleading, to say the least, as it clearly does not corroborate to available evidence on the goodness of eleven liquids. ESI Fig. S4† shows photographs of sample vials of four liquids. It is clear that the dispersions when using Tol and Hex, are unstable and hence poor. Overall, the results only reassert the issues, and that the results need to be considered with care and caution.5. Our contribution: combinatorics-based procedure to deal with the calculation of HSP for any particle system
5.1 Overview of the procedure
Fig. 2 describes the decision chart for the combinatorics-based procedure to deal with the calculation of HSP, for any particle system. Altogether, the process can be summarized in the following steps –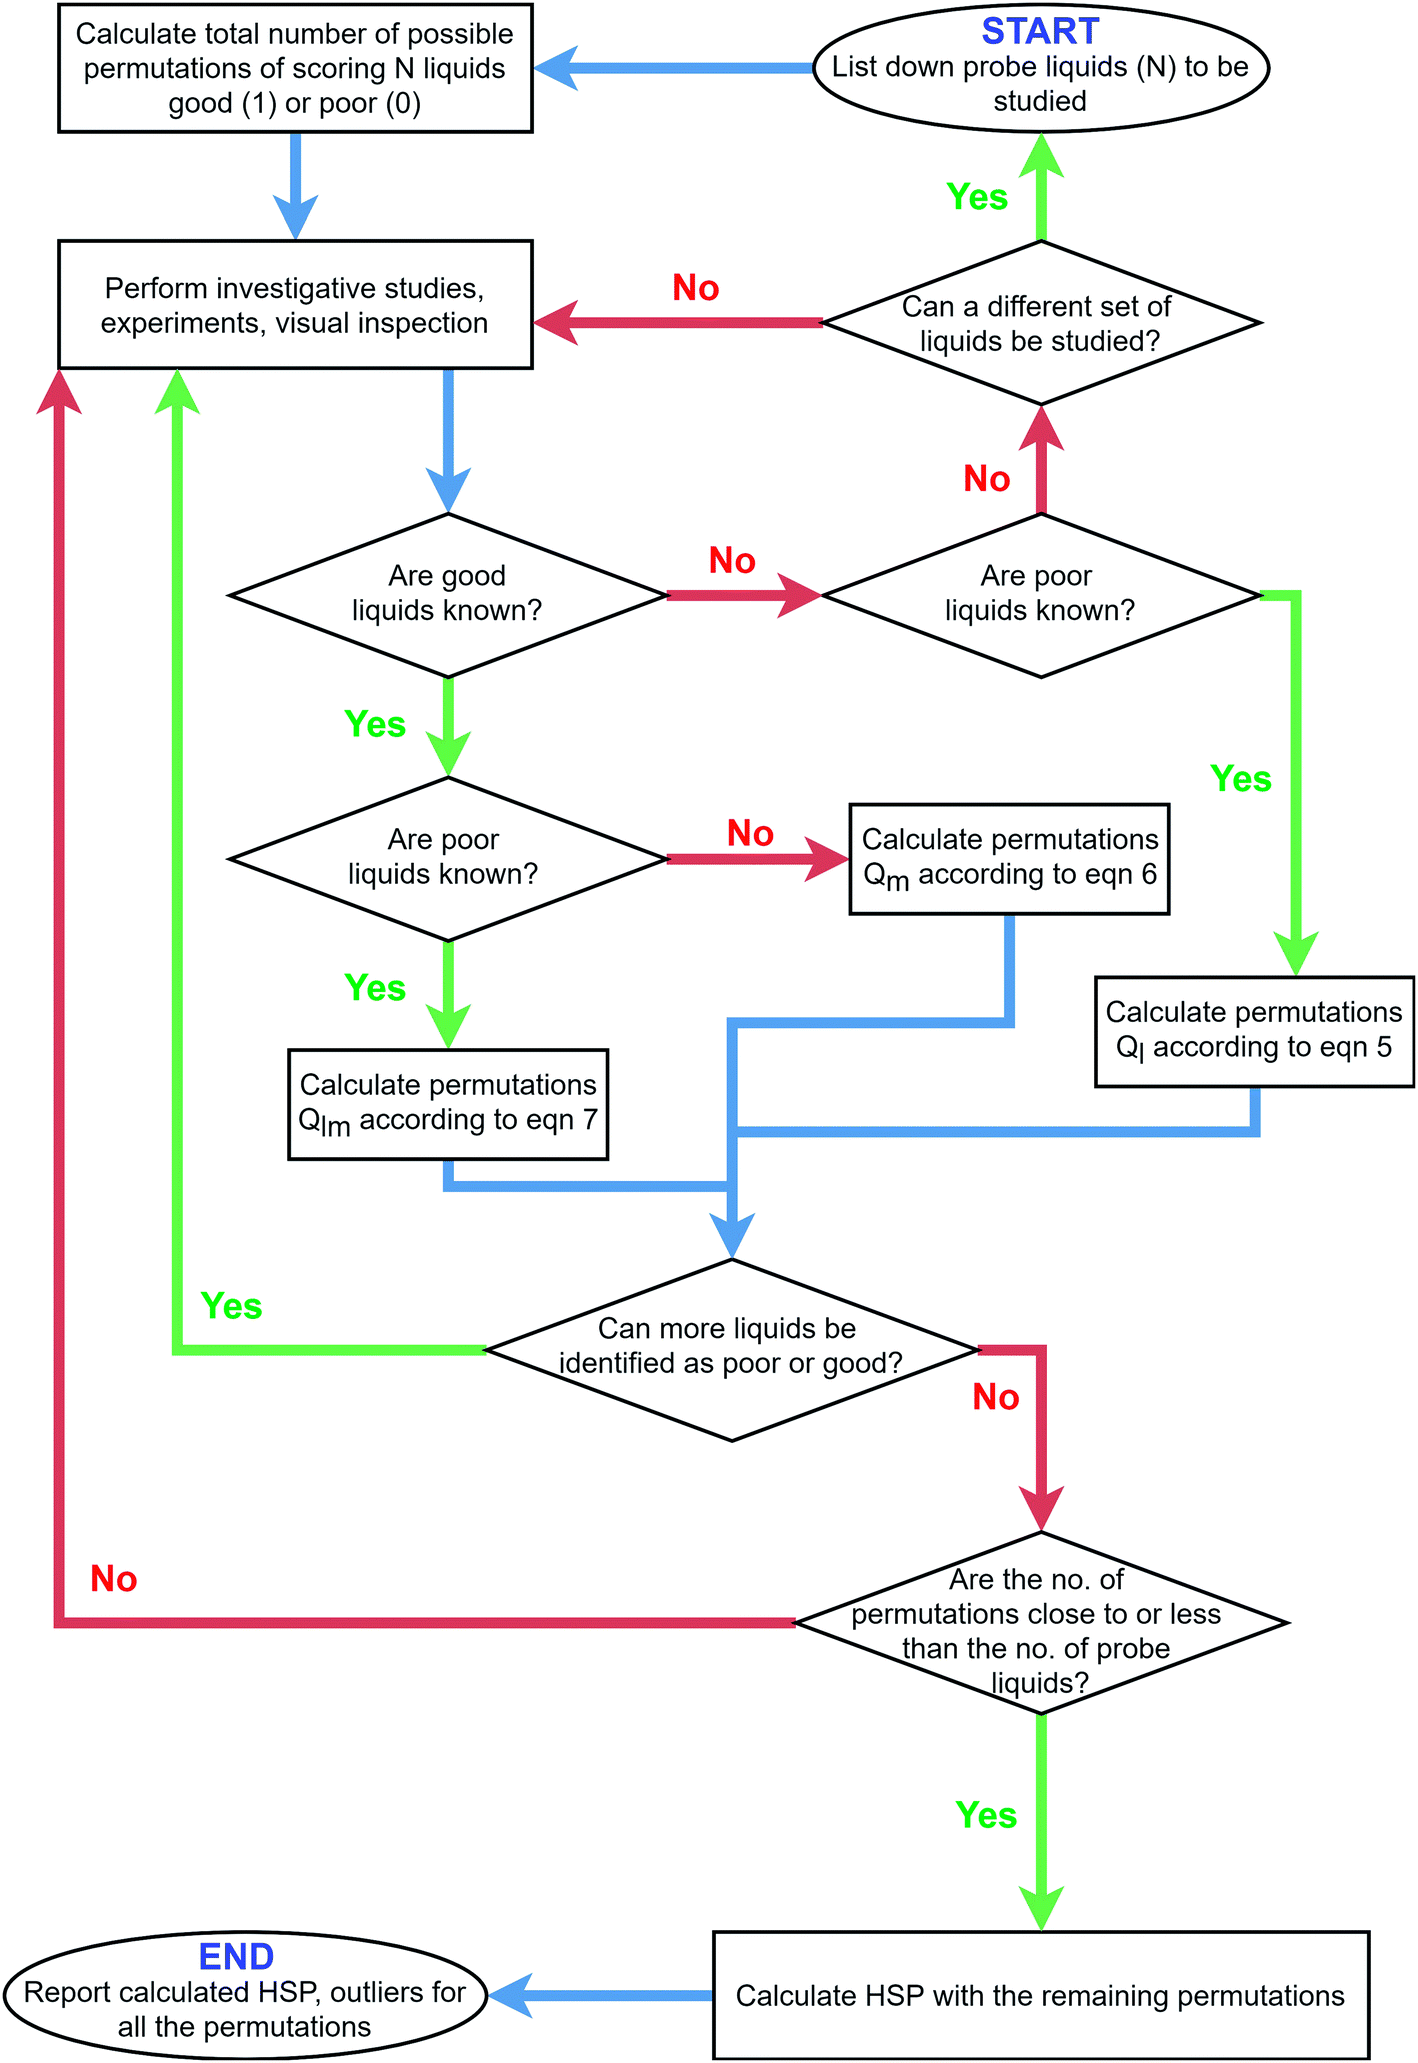 | ||
| Fig. 2 Decision chart for the combinatorics-based procedure to deal with the calculation of HSP for any particle system. | ||
1. Calculate all possible permutations (Q) for scoring when starting out an HSP study. This is made under the assumption that only the total number of PLs is known (=N), and there is no available information on their affinity towards the particles.
2. Perform measurements and investigative studies to evaluate the dispersibility characteristics. This is done to gather evidence to rank, order and decide whether the liquid is good or poor. Here, any characterization method can be adopted, even more than one.
3. Based on the newly acquired information from Step 2 regarding which PL has targeted dispersibility traits, update the number of possible permutations (Q) by eliminating redundant combinations of good or poor PLs.
4. If necessary, repeat Steps 2 and 3 to minimize the possible permutations Q.
5. Calculate the values for HSP with the remaining number of PL scoring permutations.
The key aspect here is always to know upfront the maximum number of combinations in scoring 1 or 0 for the tested liquids. We now delve into the details of each of the steps mentioned above.
5.2 Step-by-step description of the combinatorics-based procedure
In the first step, no characterization studies have been performed to elucidate particle-liquid interactions. Hence, we can consider that there is absolutely no information on the goodness or poorness of the chosen PLs. All possible number of permutations for scoring N liquids as good (1) or poor (0) can be given by 2N. But at least two good liquids and one poor liquid are required for evaluation of HSP. Hence, all scoring combinations which do not fulfil these criteria need to be excluded. As a result, the maximum number of allowable permutations (Q0) to score liquids, is given by eqn (4).| Q0 = 2N − N0C − NNC− N1C | (4) |
| N liquids | No information (Q0) | Known good liquids (Qm) | Known poor liquids (Ql) | Both good & poor liquids known (Qlm) | ||
|---|---|---|---|---|---|---|
| M = 1 | M = 2 | L = 1 | L = 2 | M = 2, L = 2 | ||
| 3 | 3 | 2 | 1 | 1 | 0 | |
| 4 | 10 | 6 | 3 | 4 | 1 | 1 |
| 5 | 25 | 14 | 7 | 11 | 4 | 2 |
| 6 | 56 | 30 | 15 | 26 | 11 | 4 |
| 7 | 119 | 62 | 31 | 57 | 26 | 8 |
| 8 | 246 | 126 | 63 | 120 | 57 | 16 |
| 9 | 501 | 254 | 127 | 247 | 120 | 32 |
| 10 | 1012 | 510 | 255 | 502 | 247 | 64 |
| 11 | 2035 | 1022 | 511 | 1013 | 502 | 128 |
| 12 | 4082 | 2046 | 1023 | 2036 | 1013 | 256 |
Next, we move to Step 2, in which we gather as much experimental evidence or expert knowledge regarding the dispersibility of the prepared samples as possible. This is done to explore possibilities of determining their goodness or poorness. Before moving to Step 3 in the following paragraphs, we will see how the number of possible scoring permutations is reduced significantly but stepwise with each piece of additional “knowledge” gained regarding the behavior of the PLs.
Now, if there is sufficient reason to believe that some liquids are poor (=L), then we are left with (N − L) liquids. Hence, the possible scoring permutations Ql can be calculated using eqn (5). Here N−L0C which equals to 1, represents the case where all remaining (N − L) liquids are scored as poor. And N−L1C, which equals to (N − L), represents the cases where only one liquid is scored as good. These cases do not confer to the aforementioned criteria, and hence are subtracted, for maximum possible permutations (2N−L).
| Ql = 2N−L − N−L0C − N−L1C | (5) |
Again, referring to Table 2, for N = 4, when one of the liquids is known to be poor, then Ql = 4 scoring permutations are possible. When two of the four liquids are known to be poor, then only Ql = 1 permutation is possible. One can easily find this solitary scoring possibility as {1, 1, 0, 0}. Similarly, for N = 12, Ql is 2036 and 1013 for one and two known poor liquids, respectively. Here, we can already see how the number of possible permutations is cut into half with each extra piece of information that can be added to the poorness of PLs.
Similarly, if there is sufficient evidence to believe that some liquids are good (=M), then we are left with (N − M) liquids. On similar lines of eqn (4) and (5), a formula can be easily derived to calculate all possible scoring permutations Qm.
 | (6) |
Table 2 also lists Qm values for different combinations of N and M calculated as per eqn (6). For N = 4, Qm = 6 and Qm = 3 scoring permutations are possible for M = 1 and M = 2 good liquids, respectively. Coming back to our case example with twelve PLs, we again see how 4082 permutations are reduced to 2046 when one of the twelve liquids is scored as good, which is further reduced to 1023 when two of the twelve liquids are scored as good. Again, scoring certain liquids as poor or good is the direct outcome of some experimental characterization, visual inspection or known prior information.
Finally, when we simultaneously know that L and M number of liquids are poor and good respectively, the resultant scoring permutations can be evaluated using N − L − M liquids, as given in eqn (7).
 | (7) |
Table 2 describes the number of permutations for different scenarios of known L poor and M good liquids simultaneously. As an example, for N = 12, there are Qlm = 256 possible permutations if two of them are known to be poor and good each. Typically, in the process of rating liquid compatibility, the extreme case (best and worst) liquids are relatively easy to identify. Here, we see that by knowing which two liquids are good and poor can cut down possible permutations by over 90%. At the same time, it is important to pay attention to the fact that if we score the rest of the eight liquids in any particular way (e.g., forced ranking order), it is merely going to be one of 256 possibilities.
An advantage of this framework is the possibility of relying on as much ‘knowledge’ about the dispersions from as many sources as possible. Outcomes from different measurement methods, expert knowledge, clear visual inspection results, etc. – can all be pooled together to clearly ascertain which of the N liquids are good and/or poor. Hence, in Step 4, basically Steps 2 and 3 can be repeated with the aim to reduce the possible number of permutations. Here, even though the aim is to reduce the permutations, it is important to do so in a logical manner and with sufficient data to back up the conclusive classification of good or poor. In the case where the remaining number of permutations is still very large (e.g., 256 permutations after only knowing two good and two poor, out of twelve liquids in total), it is okay to then report calculated HSP with a fewer number of permutations (say ten). The combinations of scoring 0 or 1 for these ten permutations can be random or based on clearly theorized assumptions. But in the end, the reported HSP value must clearly state that only ten out of 256 permutations were considered. This provides the user a clear indication of the quality and reliability of the reported HSP values. We identify this aspect to be an important benefit of the proposed method.
5.3 Brief discussion on implications
Thus far, the discussion of the combinatorics approach leads us to identify its three important advantages. First, “sufficient” evidence to make an unequivocal decision of good and poor is not always available. The beauty of the method is that, when we cannot bucketize the liquids as 1 or 0, then we are made aware of exactly how many possible scoring permutations and thus how much uncertainty needs to be considered – in a deterministic way. Second, in considering these different combinations we automatically embrace the variation in HSP values. We are not left to chance that the numerical method will yield plateauing HSP values or not. On the contrary, we get an indication of the reliability of the obtained HSP value. Third, unlike other published literature, this approach described here does not propose ways to obtain the (best) ranking order, either through intelligent guesswork or automated procedures. As we have observed, these can fail when applied to new particle systems or with a different set of PLs. Our approach makes the user aware that their theorized ranking and scoring order is only one permutation out of the many possible ones. In case of the previously described method of successively scoring N liquids as good, we are only looking at HSP values calculated from (N − 2) permutations of scoring. The problem is not the fact that only few permutations are considered but rather the fact that the permutations considered only form a subset of all possible ways of scoring.6. Case example using the proposed combinatorics-based procedure
Returning to our case example, we describe how the combinatorics procedure can be applied. In Step 1, we know from eqn (4) and Table 2 that a total of 4082 permutations of scoring 1 and 0 are possible with twelve liquids. Now proceeding to Step 2, i.e., perform experiments to study dispersion characteristics, we use AC. In order to obtain the time-resolved dispersion stability characteristics, the so-called stability trajectory was obtained by plotting S scores over time.41 In brief, the S score is a metric which captures the variation in the attenuated transmission across the sample cell. It is based on the calculation of median absolute deviation which is a robust measure of variance in statistics. Here, a lower S score over time means a more homogeneous state of the sample as a result of the even distribution of the dispersed phase along the measurement cell. Likewise, a higher S score means the heterogeneous distribution of the relative motion of particles across the cell. The evolution of the heterogeneity of the dispersed phase during the AC measurement is indicated by the stability trajectory, the shape of which is unique to the overall settling behavior of the sample and thus the stability of the system. A detailed description of the calculation procedure of S scores has been described elsewhere in our previous work.41S scores were evaluated for all the twelve SiNx dispersion systems, and Fig. 3 plots the resulting trajectories. It is directly seen that the stability trajectories capture the dispersion behavior in a variety of ways. An uphill trajectory indicates how quickly the migration of the dispersed phase takes place. The cause of this can be aggregation or agglomeration (as seen in Fig. 3, denoted with up-triangles on the different trajectories). By contrast, a downhill trajectory indicates how soon the end state of a clear continuous phase is reached (as denoted by down-triangles in Fig. 3). Wavy trajectories indicate multiple sequential settling fronts as in the case of SiNx dispersed in PC and NMP. And a flat trace in the low S score range indicates the absence of a dispersed phase due to complete sedimentation (as denoted by crosses in Fig. 3).
 | ||
| Fig. 3 Stability trajectories of SiNx in the chosen PLs. Centrifugation was performed at 1500 rpm corresponding to a relative centrifugal acceleration of 327 for 50 mins. S scores were evaluated using transmission data from AC for all twelve SiNx dispersion systems and plotted against time to obtain stability trajectories. The ascending zone signifies how quickly the dispersed phase migrates and is indicated by black up-triangles (▲). The descending zone signifies how soon the dispersion clarifies and is denoted by down-triangles (▼). The absence of a dispersed phase in the continuous phase due to completed sedimentation is marked by crosses (✖). | ||
Altogether, the stability trajectories allow us to (i) track individual settling fronts, (ii) reveal the degree of heterogeneity in the samples through peaks and troughs, (iii) find if complete settling was achieved, and at what time. Based on these characteristics, one can easily deduce the dispersion traits of liquids. Moreover, observations from stability trajectories can help to clearly designate some liquids as poor which can then help to shrink down the possible scoring permutations considerably. As mentioned earlier, in case of inorganic (nano)particles, PLs can act as a ligand interacting with the surface.14,15 In this regard, stability trajectories will be suitable for identifying such effects in an early stage of dispersion studies. However, we made sure by testing solvent mixtures (data not shown) that no ligand effects were observed for the chosen PLs in this study.
Looking at the stability trajectories for Tol and Hex (see Fig. 3), what is striking is that they are flat right from the start of the experiment. This means the dispersions are quite unstable making them unsuitable, i.e. poor liquids.23 This observation is consistent across three independent repeats (see ESI Fig. S5†) corroborating visual inspection. With this information of two poor liquids, we already reduce the number of possible permutations by 75%.
Furthermore, trajectories for Ace, MeOH, EtOH, EA, water, and THF reveal that complete settling has been achieved in the time range of 500 to 1000 s (∼8–16 min). Rapid settling at a given centrifugal acceleration is an undesirable trait for our use-case. Thus, six more liquids can be designated as poor. Again, these observations were made over three independent repeats.
Now with the updated information of eight poor liquids in all, using eqn (5), we are down to eleven possible permutations for scoring the remaining four liquids. HSP calculations can now be reasonably performed using an automated script or even manually, to provide a set of eleven different HSP. These eleven HSP are summarized in Table 3A. The table also describes the eleven scoring permutations for the remaining four liquids – IPA, DAA, PC, NMP. Besides, Hansen sphere outliers, i.e., incorrect inclusion of poor liquids within the sphere and incorrect exclusion of good liquids outside the sphere are also listed. We revisit the aspects around reporting of HSP results later in this letter below.
| DAA | IPA | PC | NMP | δD/MPa0.5 | δP/MPa0.5 | δH/MPa0.5 | R | Poor liquids inside sphere | Good liquids outside sphere |
|---|---|---|---|---|---|---|---|---|---|
| [A] HSP reporting summary for eleven remaining permutations after having evidence for eight out of twelve liquids to be poor. Hence, remaining liquids to permute are DAA, IPA, PC and NMP | |||||||||
| 1 | 1 | 1 | 0 | 22.26 | 10.85 | 15.12 | 14.0 | 2 | 0 |
| 0 | 1 | 1 | 0 | 24.00 | 11.20 | 16.94 | 16.6 | 1 | 1 |
| 1 | 1 | 0 | 0 | 15.83 | 7.15 | 13.6 | 3 | 0 | 0 |
| 1 | 0 | 1 | 0 | 15.89 | 21.57 | 13.46 | 12.9 | 1 | 2 |
| 1 | 1 | 1 | 1 | 19.94 | 12.65 | 13.56 | 10.8 | 0 | 2 |
| 0 | 1 | 1 | 1 | 23.44 | 9.99 | 13.64 | 13.8 | 0 | 2 |
| 1 | 1 | 0 | 1 | 16.91 | 10.1 | 12.43 | 6.1 | 0 | 0 |
| 1 | 0 | 1 | 1 | 19.17 | 12.61 | 9.88 | 8.1 | 0 | 0 |
| 0 | 1 | 0 | 1 | 19.28 | 10.6 | 15.00 | 8.4 | 0 | 0 |
| 0 | 0 | 1 | 1 | 19.15 | 15.01 | 5.68 | 3.9 | 0 | 0 |
| 1 | 0 | 0 | 1 | 16.98 | 10.13 | 9.08 | 3.6 | 0 | 0 |
![[thin space (1/6-em)]](https://www.rsc.org/images/entities/char_2009.gif) |
|||||||||
| [B] HSP reporting summary for four remaining permutations after having evidence for nine out of twelve liquids to be poor. Hence, remaining liquids to permute are DAA, IPA and PC | |||||||||
| 1 | 1 | 1 | 0 | 22.26 | 10.85 | 15.12 | 14.0 | 2 | 0 |
| 0 | 1 | 1 | 0 | 24.00 | 11.20 | 16.94 | 16.6 | 1 | 1 |
| 1 | 1 | 0 | 0 | 15.83 | 7.15 | 13.6 | 3 | 0 | 0 |
| 1 | 0 | 1 | 0 | 15.89 | 21.57 | 13.46 | 12.9 | 1 | 2 |
|
|||||||||
| [C] HSP reporting summary for two remaining permutations after having evidence for nine out of twelve liquids to be poor and two out of twelve liquids to be good. Here DAA and IPA are considered good liquids, while EtOH, MeOH, NMP, water, Ace, Tol, Hex, THF, EA are considered poor. PC cannot be determined umambiguously. Hence, the remaining two permutations involve PC as good or poor | |||||||||
| 1 | 1 | 1 | 0 | 22.26 | 10.85 | 15.12 | 14.0 | 2 | 0 |
| 1 | 1 | 0 | 0 | 15.83 | 7.15 | 13.6 | 3 | 0 | 0 |
At this juncture, we have found a total of eleven reasonable estimates for the HSP. However, to highlight the procedural merits, we take a step forward and explore our options to further reduce the possible number of permutations by inferring particle-liquid behavior from stability trajectories. It is important to note that the following discussions are not to ‘force-fit’ the arguments in favor of a particular desirable outcome. They highlight how some permutations can be excluded in light of new information as proposed in the decision chart (Fig. 2), and in this case, what are the resulting implications (i.e., how the variation in the HSP value can be reduced).
Observing the trajectories for NMP obtained across three different experiments, it can be said that they have the highest S scores among all the investigated liquids. Also, the data corroborates that complete settling is achieved after 2000 s (∼30 min). Compared to complete settling times of previously discussed liquids (∼8–16 min), this is relatively long, but it remains an undesired trait that indicates unfavorable dispersion conditions. As a result, we can consider one more liquid as poor, updating our list to a total of nine poor liquids. Again, using eqn (5), we calculate the possible permutations which are left equal to 4 (Table 3B).
Lastly, we can include our expert knowledge. “If” we combine observations from visual inspection of the dispersions showing highly homogeneous samples after dispersion without settling and trajectory data measured by AC, we can conclude that dispersions in IPA and DAA remain stable throughout the experiment. In line with this expert knowledge, the undulatory nature of trajectories, in the low S score range, until the end of the experiment suggests that these two liquids are good. Basically, we once again update our information, this time amounting to a total of two good and nine poor liquids.
According to eqn (7), only two scoring permutations are left. Noting that no clear evidence was available for PC, the corresponding HSP values for the two permutations involve IPA, DAA and PC and are reported in Table 3C. At this point it should be mentioned that the finally assigned two good PLs result in a very small sphere. In future works that also include liquid mixtures and additional PLs, it would be interesting to challenge its edges and validate them. However, the selection of the liquid list is another important aspect that must be carefully differentiated from the assignment into good and poor liquids and the combinatorics approach discussed here. It is also worth mentioning that reducing the scoring permutation down to one or two (best) is not “always” the aim but should be done when there is enough data available to support the claims. Noteworthy here is that the designation of poor or good liquids can be done on the basis of different dispersion traits, or measurement techniques. This is an important benefit in contrast to methods which rank using only one particular parameter (for e.g., RST using IE as input, or RN using NMR relaxation).
Remarkably, the final HSP outcomes as outlined in Table 3A–C for eleven, four and two combinations respectively, highlight yet another purposeful function of the described approach. It can be observed that Table 3C is a subset of Table 3B, and Table 3A. Additionally Table 3B is a subset of 3A. Hence, it is safe to say that even if it is not possible to bring all known possible combinations down to a handful, after HSP calculations we can further make informed judgments about the most appropriate value. We strongly recommend that if some liquids are even slightly ambiguous, there is absolutely no harm in considering them into the list of all possible scoring combinations. The HSP values will ergo include the necessary variation. Just like biological systems measurements accommodate and report existing variation, we believe that this perspective of embracing the variation for real world particulate dispersions is beneficial to the formulator and the end user.
Thus far, we have demonstrated the stepwise workflow for HSP evaluation of SiNx using our newly proposed method. Here we highlight the general basis of this method. Considering certain liquids as good or poor does not discount the fact that other liquids may also be (partially) good or poor like it is the case for PC, which also shows undulatory trajectories. Such liquids are automatically included in the different scoring permutations as seen in Table 3, reiterating our claims for the merit of our method.
7. Reporting package for particle HSP
In this section, envisioning standard procedures, we propose an HSP reporting package. Using the described method, any ranking strategy or measurement method can be performed. After the process of eliminating permutations, if only one permutation is left, then the calculated HSP can be reported as is. On the other hand, if there exists a finite small number of permutations, then HSP must be reported as an interval. When multiple permutations are tried, then instead of reporting a single value for the HSP, it is recommended to report the interval (min:max) along with a robust estimator such as a median. A very large number of permutations means that there is inconclusive evidence for goodness and poorness of liquids for a majority of liquids which is a valuable piece of information on its own. In this case, a different set of PLs should be investigated. Towards building a database of particle HSP, the following aspects should be considered:• The number of PLs with which the HSP study was conducted. This has been also pointed out previously.23
• In all cases, HSP reporting must be accompanied by reporting of the number of outliers. Outliers are the number of poor PLs inside the sphere, and the number of good PLs outside the sphere. If the number of outliers is high (>50%), it will indicate the reader to interpret the HSP with care.
• In any case, the number of tried permutations must be reported. HSP for all permutations should be reported whenever possible.
All the above aspects lead to better reporting of the HSP, with exact indication of the underlying uncertainty. The quality of the obtained HSP values has been addressed by Hansen18 and Vebber et al.,21 but these aspects are often left out in most reports on HSP values.
8. In case of uninformative HSP space to study particle-liquid interactions
In the last section of this letter, we bring to forefront cases in which the study of particle-liquid interactions through the HSP space is limited. This can happen in several scenarios such as, (but not limited to) when – (a) HSP calculation is not possible at all due to convergence issues, (b) the reported HSP has a large dispersion due to a large number of plausible permutations, (c) the functionality of the particles under consideration is split, where the particles have a high affinity to multiple groups of liquids far apart in the HSP space, (d) the sample compatibility to a mixture of liquids is dissimilar compared to its constituent components (i.e., a mixture of two poor liquids can be good, or vice versa), (e) the range of available and workable PLs is very low. Consequently, the relative positioning of the components in the HSP space may be of limited use. In such circumstances, we believe that the rich information from AC, manifested in the form of stability trajectories directly provides compatibility information. The trajectories can be reduced to a 2D scatter using dimensionality reduction techniques such as principal components analysis (PCA) (see Fig. 4). Here, we can see how similarly behaving liquids cluster close to each other (e.g., IPA and DAA). Interestingly, poor liquids do not form one cluster but are spread out in the PCA space. This is indicative of the fact that even if a liquid is deemed poor, the underlying mechanism governing it can be very different. For example, water and NMP have very different behaviors. A decision boundary can be established based on the relative positions of the points in the scatter plot. | ||
| Fig. 4 Principal component analysis (PCA) biplot of SiNx dispersions. The first two principal components (PCs) are plotted. PCA was performed using stability trajectories data of all twelve PLs. | ||
9. Conclusions
Several studies report the use of HSP for the quantitative evaluation of the compatibility of (nano)particles in a selected set of probe liquids (PLs). In absence of a general, standard framework, HSP reporting is affected by the limitations of the measurement method with which the dispersions were characterized. For real-world formulations at technical concentration, decisive classification of good and poor is not always possible. Furthermore, a single decisive ranking list is seldom possible. Given these aspects, it is hard to rely on a value obtained from the convergence of an optimization algorithm. This letter describes a general framework to determine HSP in a technology-agnostic way. We feel this being especially needed for particulates where dispersity and pronounced surface heterogeneity pose severe challenges in their determination. Lastly, we show how AC is of particular advantage in revealing characteristics through trajectories, even without singling out one time point.Author contributions
SB developed the idea, implemented the method, prepared samples, performed experiments, analyzed data, and wrote the manuscript. DS supervised the project, contributed to the interpretation of findings and manuscript writing. SK synthesized SiNx NPs under supervision of HW.Conflicts of interest
There are no conflicts to declare.Acknowledgements
SB gratefully acknowledges scholarship from the International Max Planck Research School SurMat doctoral program. SB and DS acknowledge the financial support from the Federal Ministry for Economic Affairs and Energy (WIPANO funding scheme, project number 03TN0013A). SK and HW gratefully acknowledge financial support from the DFG (project number 327813155). Special thanks are due to NPPT lab (Prof. Markus Winterer) for imaging and Mr Moritz Loewenich for SEM image acquisition of SiNx NPs.References
- Y. Wang, K. S. Chen, J. Mishler, S. C. Cho and X. C. Adroher, Appl. Energy, 2011, 88, 981–1007 CrossRef CAS.
- M. Carmo, D. L. Fritz, J. Mergel and D. Stolten, Int. J. Hydrogen Energy, 2013, 38, 4901–4934 CrossRef CAS.
- X. Su, Q. Wu, J. Li, X. Xiao, A. Lott, W. Lu, B. W. Sheldon and J. Wu, Adv. Energy Mater., 2014, 4, 1–23 Search PubMed.
- I. Takahashi and S. S. Kocha, J. Power Sources, 2010, 195, 6312–6322 CrossRef CAS.
- C. J. Jacobs, Masters thesis, University of Cape Town, 2016 Search PubMed.
- J. K. Mayer, L. Almar, E. Asylbekov, W. Haselrieder, A. Kwade, A. Weber and H. Nirschl, Energy Technol., 2020, 8, 1–11 Search PubMed.
- H. Bockholt, W. Haselrieder and A. Kwade, ECS Trans., 2013, 50, 25–35 CrossRef.
- M. Wang, J. H. Park, S. Kabir, K. C. Neyerlin, N. N. Kariuki, H. Lv, V. R. Stamenkovic, D. J. Myers, M. Ulsh and S. A. Mauger, ACS Appl. Energy Mater., 2019, 2, 6417–6427 CrossRef.
- B. G. Pollet, Electrocatalysis, 2014, 5, 330–343 CrossRef CAS.
- B. G. Pollet and J. T. E. Goh, Electrochim. Acta, 2014, 128, 292–303 CrossRef CAS.
- B. G. Pollet and S. S. Kocha, Johnson Matthey Technol. Rev., 2022, 66, 1–36 Search PubMed.
- J. E. Newton, J. A. Preece, N. V Rees and S. L. Horswell, Phys. Chem. Chem. Phys., 2014, 16, 11435–11446 RSC.
- B. Millington, S. Du and B. G. Pollet, J. Power Sources, 2011, 196, 9013–9017 CrossRef CAS.
- J. L. Stein, W. M. Holden, A. Venkatesh, M. E. Mundy, A. J. Rossini, G. T. Seidler and B. M. Cossairt, Chem. Mater., 2018, 30, 6377–6388 CrossRef CAS.
- M. T. Clarke, F. N. Viscomi, T. W. Chamberlain, N. Hondow, A. M. Adawi, J. Sturge, S. C. Erwin, J.-S. G. Bouillard, S. Tamang and G. J. Stasiuk, Commun. Chem., 2019, 2, 1–7 CrossRef CAS.
- W. Peukert, D. Segets, L. Pflug and G. Leugering, Adv. Chem. Eng., 2015, 46, 1–81 Search PubMed.
- C. M. Hansen, PhD thesis, Technical University of Denmark, 1967 Search PubMed.
- C. M. Hansen, Hansen solubility parameters: a user's handbook, CRC press, 2007 Search PubMed.
- F. Gharagheizi, J. Appl. Polym. Sci., 2007, 103, 31–36 CrossRef CAS.
- M. Weng, J. Appl. Polym. Sci., 2016, 133, 1–6 Search PubMed.
- G. C. Vebber, P. Pranke and C. N. Pereira, J. Appl. Polym. Sci., 2014, 131, 39696 CrossRef.
- J. C. Zuaznabar-Gardona and A. Fragoso, J. Mol. Liq., 2019, 294, 111646 CrossRef CAS.
- S. Süβ, T. Sobisch, W. Peukert, D. Lerche and D. Segets, Adv. Powder Technol., 2018, 29, 1550–1561 CrossRef.
- S. Süβ, W. Lin, O. Getmanenko, L. Pflug, T. Sobisch, W. Peukert, D. Lerche and D. Segets, Particuology, 2019, 44, 71–79 CrossRef.
- C. Stauch, S. Sebastian, R. Luxenhofer, B. P. Binks, D. Segets and K. Mandel, Part. Part. Syst. Charact., 2018, 35, 1–11 CAS.
- C. Backes, N. C. Berner, X. Chen, P. Lafargue, P. LaPlace, M. Freeley, G. S. Duesberg, J. N. Coleman and A. R. McDonald, Angew. Chem., Int. Ed., 2015, 54, 2638–2642 CrossRef CAS PubMed.
- S. Tsutsumi, K. Kondo, Y. Kato, N. Fujiwara and H. Yamamoto, Chem. Phys., 2019, 521, 115–122 CrossRef CAS.
- N. Fujiwara, S. Imai and H. Yamamoto, Mater. Chem. Phys., 2019, 229, 139–148 CrossRef CAS.
- J. U. Wieneke, B. Kommoß, O. Gaer, I. Prykhodko and M. Ulbricht, Ind. Eng. Chem. Res., 2012, 51, 327–334 CrossRef CAS.
- Y. H. Sehlleier, et al. , J. Ind. Eng. Chem., 2017, 52, 305–313 CrossRef CAS.
- D. Fairhurst, R. Sharma, S. Takeda, T. Cosgrove and S. W. Prescott, Powder Technol., 2021, 377, 545–552 CrossRef CAS.
- K. C. Choi, E. J. Lee, Y. K. Baek, M. J. Kim, Y. Do Kim, P. W. Shin and Y. K. Kim, RSC Adv., 2014, 4, 7160–7166 RSC.
- M. D. de los Rios and E. H. Ramos, SN Appl. Sci., 2020, 2, 1–7 Search PubMed.
- D. Nakamura, K. Shigetoh and A. Suzumura, J. Eur. Ceram. Soc., 2017, 37, 1175–1185 CrossRef CAS.
- S. Abbott, Curr. Opin. Colloid Interface Sci., 2020, 48, 65–76 CrossRef CAS.
- J. Howell, M. Roesing and D. Boucher, J. Phys. Chem. B, 2017, 121, 4191–4201 CrossRef CAS PubMed.
- A. Ulvestad, H. F. Andersen, J. P. Mæhlen, Ø. Prytz and M. Kirkengen, Sci. Rep., 2017, 7, 1–10 CrossRef PubMed.
- A. Ulvestad, J. P. Mæhlen and M. Kirkengen, J. Power Sources, 2018, 399, 414–421 CrossRef CAS.
- S. O. Kilian and H. Wiggers, Part. Part. Syst. Charact., 2021, 1–10 Search PubMed.
- D. Segets, R. Marczak, S. Schäfer, C. Paula, J. F. Gnichwitz, A. Hirsch and W. Peukert, ACS Nano, 2011, 5, 4658–4669 CrossRef CAS PubMed.
- S. Bapat, C. Giehl, S. Kohsakowski, V. Peinecke, M. Schäffler and D. Segets, ChemRxiv, 2021, DOI:10.26434/chemrxiv.13125401.v3.
Footnote |
| † Electronic supplementary information (ESI) available: Materials and methods include sample preparation methods, electron microscopy imaging, analytical centrifugation characterizations. See DOI: 10.1039/d1na00405k |
| This journal is © The Royal Society of Chemistry 2021 |