In situ formation of tetraphenylethylene nano-structures on microgels inside living cells via reduction-responsive self-assembly†
Wenbo
Zhang
a,
Zihe
Zhai
a,
Shifen
Li
a,
Xue
Lin
a,
Wei
Bai
a,
Ning
Ding
a,
Yue
Zhang
a,
Jiaqi
Tong
a,
Jingzhi
Sun
 *a and
Changyou
Gao
 *ab
*ab
aMOE Key Laboratory of Macromolecular Synthesis and Functionalization, Department of Polymer Science and Engineering, Zhejiang University, Hangzhou, 310027, China. E-mail: sunjz@zju.edu.cn; cygao@zju.edu.cn
bDr Li Dak Sum & Yip Yio Chin Center for Stem Cell and Regenerative Medicine, Zhejiang University, Hangzhou 310058, China
First published on 9th December 2020
Abstract
Controlling the assembly of synthetic molecules in living systems is of significance for their adaptive applications. However, it is difficult to achieve, especially for composite self-assemblies, due to the complexity and dynamic change of the intracellular environment, and there exist technical difficulties for the direct visualization of organic and polymer self-assemblies. Herein, we demonstrate a novel strategy for the in situ formation of self-assembled micro–nano composite structures in a cell milieu using reduction-responsive microgels (MGs) as a platform. The MGs were prepared by a templating and crosslinking method using a synthetic amphiphlic polymer as the basic material and porous CaCO3 microparticles as the template. The aggregation-induced emission (AIE) tetraphenylethylene moieties and reduction-labile disulfide bonds in the MGs were employed as the self-assembly building blocks and triggering sites for the intracellular self-assembly, respectively. In the presence of reductive agents such as glutathione, nano-spikes were gradually formed on the MGs. After the MGs were internalized by cells, the in situ formation of microgel/nano-spike composite structures was evidenced by the enhanced fluorescence intensity and was further confirmed by direct transmission electron microscopy observation. This work provides an effective strategy to cope with the challenging task of achieving and probing controlled self-assembly in a cell milieu, leading to new insights into investigating biological self-assembly and promoting the development of micro-/nanomaterials by learning from nature.
Introduction
Supramolecular self-assembly exists ubiquitously in nature. In biological systems, various kinds of structures such as genes and enzymes are formed through delicate self-assembly.1 These natural self-assemblies provide inspirations for the design of synthetic self-assembled nano-/micro-materials.2,3 Indeed, self-assembly has attracted increasing attention due to its promising applicability in nanotechnology, biotechnology and biomedicines.4–6 Particularly, stimuli-responsive self-assembly can regulate the formation process of nano-/micro-structures in a controlled way, producing a variety of functional materials.7–10Controlling the assembly of synthetic molecules in living systems and making use of the assemblies to regulate biological processes are of significance for biological exploration, disease diagnosis and treatment, and drug development.11–15 In recent years, pioneering works have been reported regarding self-assembly in living cells.11,16,17 For instance, the self-assembly of small molecules in cells or in the living body was applied for enhancing cellular uptake,18 improving therapeautic retention in tumor sites19 and detecting enzymatic activity inside living cells.20,21 However, in spite of these pioneering works, it has been a challenge to fabricate well-structured self-assemblies with synthetic building blocks in living cells, especially complex structures such as micro–nano composites, due to the complexity and dynamic characteristics of the intracellular or in vivo environment. Moreover, organic and polymer materials usually have critically small size and low contrast in the cell milieu, so that observation and investigation of their self-assemblies in living cells turn out to be difficult. To date, direct observation of intracellular-formed artificial morphology-defined nanostructures has rarely been reported. In this case, the elaborate selection of the self-assembly building blocks and the deliberate design of the self-assembly platforms are desired.
Tetraphenylethylene (TPE) and its derivatives are ideal candidates for the fabrication of micro-/nano-structures owing to their unique aggregation-induced emission (AIE) property, effectiveness in self-assembly and accessible functionalization.22–24 They have been reported to show great potential in applications such as bioimaging and biological and chemical sensing.25–27 Recently, “turn-on” cell imaging via “lab in cell” intracellular polymerization was achieved by taking advantage of the AIE property of TPE moieties.28 Recognized as a representative AIE molecule, TPE possesses a propeller structure so that intermolecular face-to-face π–π stacking of its non-coplanar benzene groups is forbidden, and the rotation of the benzene group is restricted in nano-aggregates.29–31 Therefore, the nonradiative energy dissipation channels are blocked and the radiative decay pathway is opened up, enhancing the TPE fluorescence property in aggregates. With a strong tendency toward supramolecular assembly along with the formation of interesting superstructures, TPE has been used to self-assemble into micro-/nanostructural morphologies such as nanospheres, nanorods and nanosheets.24,32–35 Thus, by introducing a TPE moiety into the intracellular self-assembly platform, it is expected to obtain unique self-assembled structures. Moreover, the involvement of emission recovery upon TPE self-assembly with the formation of aggregates would be favorable for the detection of the self-assembly process and biological applications.
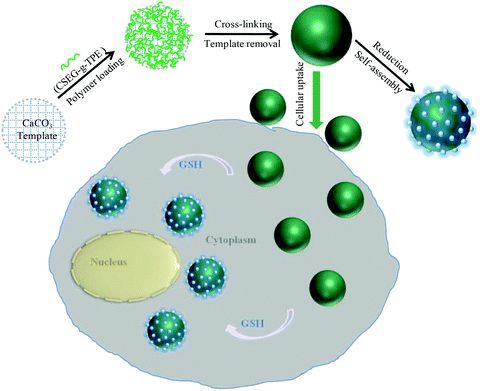
Herein, a novel strategy for the in situ fabrication of self-assembled micro–nano composite structures in living cells is reported. The microgels (MGs) contain TPE moieties as the self-assembly building blocks and reduction-labile disulfide bonds as the triggering sites for the intracellular stimuli-responsive self-assembly (Scheme 1), which can then serve as an effective platform for the formation and direct observation of complex self-assemblies in cells. These MGs are prepared through a templating and crosslinking method using a synthetic amphiphilic polymer (CSEG-g-TPE) as the basic backbone and porous CaCO3 microparticles as the template that are removed after polymer loading and cross-linking (Scheme 2). When the CSEG-g-TPE MGs are incubated in solutions of reductants such as glutathione (GSH), which has a high concentration in the human cellular system, nano-spikes gradually protrude on the MG surface, forming a novel micro–nano composite structure. After the MGs are internalized by different human cells, the in situ formed microgel/nano-spike composite structures are subject to direct visualization (Scheme 2). This process is further confirmed by the improvement of the fluorescence intensity of TPE as a result of aggregation. Therefore, this facile method offers an effective platform to achieve the fabrication of micro–nano composite structures by stimuli-responsive self-assembly and direct observation of the composite assemblies in living cells, which has been challenging up to the present.
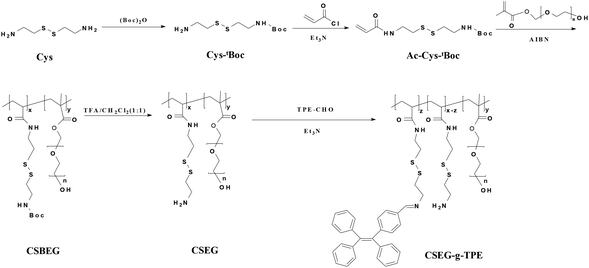 | ||
| Scheme 1 Synthesis route and molecular structure of the tetraphenylethylene-containing amphiphilic copolymer CSEG-g-TPE. | ||
Results and discussion
Design and fabrication of CSEG-g-TPE microgels
The monomer N-tert-butoxycarbonyl-N′-acryloyl-cystamine (Ac-Cys-tBoc) with a disulfide bond was synthesized starting from cystamine36 (Scheme 1 and Fig. S1†). Ac-Cys-tBoc was then copolymerized with highly hydrophilic poly(ethylene glycol) methacrylate (PEGMA, average Mn 360 Da) by free radical polymerization to obtain the reduction-responsive random copolymers (CSBEG).37 The successful synthesis of CSBEG was confirmed with 1H NMR spectroscopy and gel permeation chromatography (GPC) (Fig. S2 and 3†). The structural unit ratio in the copolymers was determined to be 2![[thin space (1/6-em)]](https://www.rsc.org/images/entities/char_2009.gif) :
:![[thin space (1/6-em)]](https://www.rsc.org/images/entities/char_2009.gif) 1 ([Ac-Cys-tBoc]
1 ([Ac-Cys-tBoc]![[thin space (1/6-em)]](https://www.rsc.org/images/entities/char_2009.gif) :
:![[thin space (1/6-em)]](https://www.rsc.org/images/entities/char_2009.gif) [PEGMA]) (Fig. S2†) and the molecular weight (Mn) of the copolymers was 5.4 kDa (Mn, GPC) with a PDI of 1.1 (Fig. S3†). To regain the –NH2 groups for conjugating TPE groups, the protecting tBoc groups in CSBEG were detached with the treatment of trifluoroacetic acid (TFA). The deprotected CSEG polymers were then conjugated with the hydrophobic TPE groups by the Schiff base reaction between –NH2 groups in the polymers and –CHO groups of TPE-CHO to obtain the amphiphilic polymers CSEG-g-TPE. The 1H NMR spectrum (Fig. S4 and 5†) shows both the signals of TPE and CSEG, suggesting the successful grafting of TPE. The structural unit ratio [Ac-Cys-TPE]/[Ac-Cys]/[PEGMA] in the CSEG-g-TPE was calculated to be 1/16.3/8.6, and thus the loading content of TPE was 4.9 wt%.
[PEGMA]) (Fig. S2†) and the molecular weight (Mn) of the copolymers was 5.4 kDa (Mn, GPC) with a PDI of 1.1 (Fig. S3†). To regain the –NH2 groups for conjugating TPE groups, the protecting tBoc groups in CSBEG were detached with the treatment of trifluoroacetic acid (TFA). The deprotected CSEG polymers were then conjugated with the hydrophobic TPE groups by the Schiff base reaction between –NH2 groups in the polymers and –CHO groups of TPE-CHO to obtain the amphiphilic polymers CSEG-g-TPE. The 1H NMR spectrum (Fig. S4 and 5†) shows both the signals of TPE and CSEG, suggesting the successful grafting of TPE. The structural unit ratio [Ac-Cys-TPE]/[Ac-Cys]/[PEGMA] in the CSEG-g-TPE was calculated to be 1/16.3/8.6, and thus the loading content of TPE was 4.9 wt%.
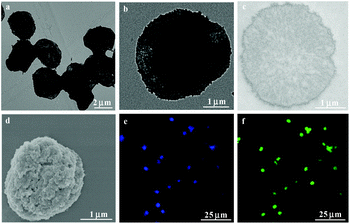
In order to fabricate CSEG-g-TPE MGs with homogeneous morphology and appropriate size, porous calcium carbonate (CaCO3) microparticles were prepared and used as the template (Fig. S6†) and were then thoroughly dissolved/decomposed by incubation in ethylenediamine tetraacetic acid (EDTA). The CaCO3 microparticles were dispersed in concentrated CSEG-g-TPE/MeOH solution to allow loading of the polymers through diffusion. To achieve sufficiently high loading of CSEG-g-TPE, repeated incubation of the porous CaCO3 microparticles in fresh CSEG-g-TPE/MeOH solution was conducted under vacuum. In this process, the electrostatic interaction between CSEG-g-TPE and CaCO3 may also play a role besides the physical entrapment. After loading, there were no obvious changes in the morphology of CaCO3 templates (3.08 ± 0.31 μm) and no polymer aggregates (Fig. S7†), indicating the homogeneous loading of CSEG-g-TPE into the template particles. The polymers were then crosslinked with GA by taking advantage of the remaining –NH2 groups, followed by arginine processing to block most of the free –CHO groups. Then, the sacrificial CaCO3 microparticles were removed with EDTA to obtain the CSEG-g-TPE MGs. To enhance internalization with cells, the MGs were further modified with Tat peptides by the reaction between the residual –CHO groups in MGs and –NH2 groups in Tat peptides. In this way, the severe agglomeration of the MGs caused by the direct treatment of Tat peptides without arginine processing could be avoided, whereas the cellular uptake of the MGs could be significantly enhanced.38,39 As shown in Fig. 1, the CSEG-g-TPE MGs (hereafter referred to as the Tat peptide-modified ones) maintained the macroscopic shape of the CaCO3 template and had a relatively uniform size with an average diameter of 3.06 ± 0.24 μm (Fig. 1a and b), which was almost the same as that of the template. They had a solid interior (Fig. 1c) and a rugged surface (Fig. 1d). In water, the CSEG-g-TPE MGs showed good dispersibility with an average diameter of 3.09 ± 0.38 μm and a positive surface charge (zeta potential, + 19.3 ± 0.4 mV). They emitted typical blue fluorescence of TPE aggregates (Fig. 1e), which were formed by hydrophobic interactions between TPE moieties. Besides AIE fluorescence, they also showed green auto-fluorescence (Fig. 1f), which is resulted from the n–π* transition of the Schiff base bonds.40,41 These unique emissions are favorable for their intracellular imaging and potential biomedical applications.
In order to gain insight into the aggregation state and fluorescence properties of TPE moieties in the MGs, their ultraviolet-visible (UV-vis) absorption spectra and fluorescence spectra were characterized. The UV-vis spectra revealed that the characteristic absorption of TPE at 300–400 nm in the MGs, which is attributed to the aromatic conjugated structure of TPE, was broadened and red-shifted compared with that of the homogeneous CSEG-g-TPE/MeOH solution (Fig. S8a†). However, the broadening and red-shift degrees were much smaller than those of the TPE-CHO aggregates formed in water. These results suggest that local microscopic TPE aggregates were formed in the MGs, and the aggregation degree was limited due to the conjugation of TPE moieties on the polymer chains.42,43 Fluorescence spectra (Fig. S8b†) show that homogeneous CSEG-g-TPE/MeOH and TPE/MeOH solutions were almost non-fluorescent due to the easy intramolecular rotation of the TPE phenyl rings in the good solvent methanol. In contrast, the CSEG-g-TPE MGs and TPE-CHO aggregates in water showed intense fluorescence, which is caused by the AIE effect, that is aggregation-inhibited molecular free rotation and thereby the non-irradiative emission.44–46 Moreover, although the concentrations of TPE moieties were the same, the fluorescence intensity of CSEG-g-TPE MGs was much weaker than that of TPE-CHO aggregates, indicating a smaller aggregation degree as well. This result is in accordance with the absorption characterization result.
Formation of micro–nano composite structures with reduction-responsive decomposition-assembly
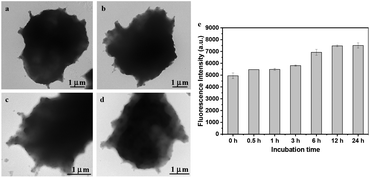
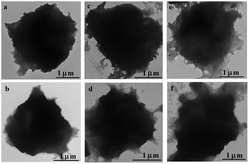
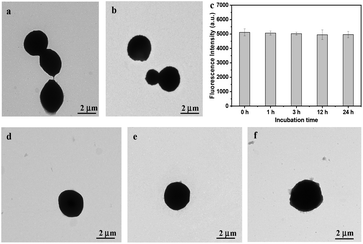
The reduction-responsive disulfide bonds in the CSEG-g-TPE MGs, with which the TPE moieties are conjugated to the polymer matrix, offer facile triggering sites for controllable supramolecular self-assembly. To investigate the reduction-responsive structure evolution, the MGs were incubated in GSH solution (5 mM) at 37 °C for different times, and their structure changes were monitored with TEM. The nano-spikes were gradually protruded on the surface of the CSEG-g-TPE MGs (Fig. 2a–d). After 1 h, some small nano-aggregates with sizes of dozens of nanometers appeared on the periphery of MGs (Fig. 2a). With prolongation of incubation time, the number and size of nano-spikes increased progressively (Fig. 2b and c). At 12 h, their size reached a few hundreds of nanometers (Fig. 2c), accompanied by contrast fading of MGs. When the incubation time was prolonged to 24 h, the surface nano-aggregates became smoother (Fig. 2d). In the whole process, the MGs were not collapsed due to the strong crosslinked polymer matrix. The nano-spike protrusion on the CSEG-g-TPE MGs results from the release and aggregation of hydrophobic TPE moieties as a result of the reduction-responsive cleavage of disulfide bonds. Therefore, fluorescence intensity of TPE moieties in the MGs was recorded at different incubation times, which increased gradually as the incubation time was prolonged from 0.5 h to 12 h, leading to 17% higher at 3 h and 50% higher at 12 h than the original intensity, respectively (Fig. 2e). These results demonstrate that during the incubation in GSH solution, a higher degree of aggregation of TPE moieties must have taken place, so that the TPE fluorescence intensity is enhanced due to the AIE effect. Hence, it is reasonable to infer that the nano-spikes are formed by the self-assembly of released TPE groups with those grafted on the polymers. In this process, the van der Waals interactions, the hydrophobic interactions (π–π interactions) between TPE groups and intermolecular hydrogen bonding between oxygen/nitrogen atoms and amino/hydroxyl groups participate in the self-assembly, of which the hydrophobic interactions serve as the primary driving force.24,42,47 To explore the generality of this reduction-responsive decomposition-assembly phenomenon, the morphological changes of MGs were observed by being incubating in dithiothreitol (DTT, 5 mM) solution, lysed HepG2 cell (human liver hepatocellular carcinoma cells) solution and lysed HepLi cell (primary human normal hepatocytes) solution at 37 °C as well. For all these three kinds of reductant solutions, a MG morphology evolution similar to that in GSH solution was observed (Fig. 3a–f). Apparent nano-spikes were formed gradually on the surface of CSEG-g-TPE MGs, of which the sizes were in the range from tens of nanometers to hundreds of nanometers. Hence, the micro–nano composite structures can be universally generated through the reduction-responsive morphology transformation of CSEG-g-TPE MGs.To further prove the proposed mechanism of this reduction-responsive self-assembly, the comparison amphiphilic ADEG-g-TPE polymers were synthesized by a similar method (Scheme S1 and Fig. S9–11†). The synthesized ADEG-g-TPE without disulfide bonds had an analogous chemical structure and similar TPE loading ratio (4.8 wt%) to those of the CSEG-g-TPE, which does not possess reduction-responsiveness. The ADEG-g-TPE MGs were prepared by the same templating-crosslinking method as well. The ADEG-g-TPE MGs had an average diameter of 2.94 μm (Fig. 4a), which is similar to that of CSEG-g-TPE MGs. However, after being incubated in a GSH solution (5 mM, 37 °C) for up to 24 h, the morphology of the ADEG-g-TPE MGs was not changed (Fig. 4b). The fluorescence intensity of TPE moieties in the MGs was not changed along with the prolongation of incubation time from 0.5 h to 24 h in the GSH solution either (Fig. 4c). Incubation of the ADEG-g-TPE MGs in other reductant solutions such as DTT, lysed HepG2 cell and lysed HepLi cell solutions did not cause any change in the original morphology after 24 h (Fig. 4d–f). These results demonstrate that during the incubation in reductant solutions, the TPE moieties were not released and their aggregation state was not changed. All these results confirm the self-assembly of TPE moieties, and thus the formation of the nanospikes on the CSEG-g-TPE MGs under reductive conditions, conveying the possibility of intracellular reduction-responsive self-assembly of the MGs.
Cellular uptake performance of MGs
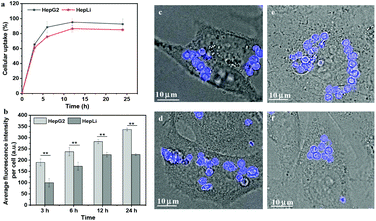
The occurrence of cellular uptake of the MGs is mandatory for their subsequent intracellular self-assembly. Therefore, the cellular internalization of the MGs was investigated using four kinds of human cell lines, HepG2, HepLi, human lung adenocarcinoma epithelial cells (A549 cells) and human primary pulmonary artery smooth muscle cells (SMCs). The cellular uptake of the CSEG-g-TPE MGs was a time-dependent process in HepG2 and HepLi cells within 24 h (Fig. 5a and b). The MGs were internalized quite quickly by both kinds of cells. As shown in Fig. 5a, at 3 h, the ratio of cells that internalized MGs was already above 60%. With time extension, the cellular uptake ratio was improved progressively. 24 h later, about 93% HepG2 cells had internalized the CSEG-g-TPE MGs. At the same incubation time, the ratios of HepLi cells internalizing MGs were slightly lower than those of the HepG2 cells, which was around 85% at 24 h. Moreover, the average number of the CESG-g-TPE MGs per cell also increased along with the prolongation of incubation time (Fig. 5b). Each HepG2 cell internalized more MGs than each HepLi cell at the same incubation time, which was about 1.6-fold at 24 h, indicating the greater uptake ability of the cancer cells. CLSM observation showed that after co-incubation for 24 h, the MGs internalized by HepG2, HepLi, SMCs and A549 cells were mainly located in the cytoplasm, some of which were found in the perinuclear zone (Fig. 5c–f). The ADEG-g-TPE MGs exhibited similar internalization performance when co-incubated with HepG2 and HepLi cells (Fig. S12†), guaranteeing the rationality of the comparative study on intracellular self-assembly of the MGs. It has been reported that various kinds of microparticles of similar dimensions can be internalized efficiently by different living cells.10,48 Various positively charged microparticles favor their internalization by promoting interactions with the negatively charged cell membranes.10,49 The surface of the CESG-g-TPE MGs and ADEG-g-TPE MGs was modified with cell-penetrating peptides (Tat peptide), which has been proved to greatly promote cellular uptake.50 These account for the highly efficient internalization of the MGs as demonstrated above. Moreover, the TPE fluorescence (Fig. 5c–f and Fig. S12c, d†) and the autofluorescence (Fig. S13†) in the MGs were well maintained in the cells. The results provide beneficial bases for the study of in situ reduction-responsive self-assembly in living cells.In situ formation of micro–nano composite structures in living cells
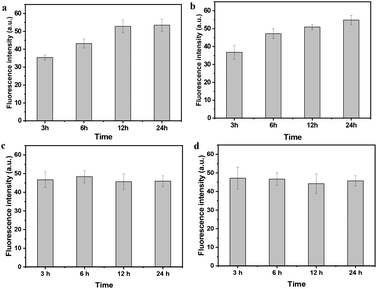
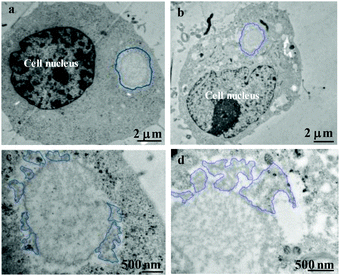
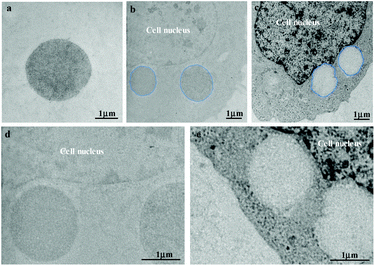
Cells in human beings are equipped with a variety of antioxidants that serve to counterbalance the effect of oxidants, including enzymatic antioxidants such as superoxide dismutase and catalase, and nonenzymatic antioxidants such as GSH, a tripeptide (L-g-glutamyl-L-cysteinyl-L-glycine) that comprises a thiol (sulfhydryl) group. Therein, GSH is highly abundant in all cell compartments and is the major soluble antioxidant. The GSH/GSSG ratio is a major determinant of oxidative stress. The intracellular concentration of GSH is usually in the range of 1–10 mM,51,52 which has been widely utilized to trigger reduction-responsive systems in drug delivery and cell imaging. In order to investigate the reduction-responsive decomposition–assembly and morphology evolution of the CSEG-g-TPE MGs in living cells, quantitative analysis of TPE fluorescence intensity and observation of the structure changes of the internalized MGs were performed. The fluorescence intensity of TPE was analyzed by statistics of the MG fluorescence inside the cells in the CLSM images obtained at different co-incubation times. In both HepG2 (Fig. 6a) and HepLi cells (Fig. 6b), the average TPE fluorescence intensity of CSEG-g-TPE MGs increased along with the prolongation of incubation time within 24 h. For example, in HepG2 cells, the fluorescence intensity was improved by 21.1% and 49.3% at 6 h and 12 h compared with that at 3 h, respectively (Fig. 6a). After 24 h, it was 50.7% and 48.6% higher in HepG2 cells and HepLi cells than that at 3 h, respectively. Therefore, under our experimental conditions, the longer the time after MGs were internalized inside the cells, the higher the aggregation degrees of TPE moieties were. This should be attributed to the stronger AIE effect in the self-assembly of the TPE moieties, which is consistent with the fluorescence intensity changes of MGs in GSH (Fig. 2e). In contrast, the average fluorescence intensities of TPE moieties in the internalized ADEG-g-TPE MGs by both the HepG2 (Fig. 6c) and HepLi (Fig. 6d) cells were virtually unchanged. Moreover, monitoring of TPE fluorescence in the CSEG-g-TPE MGs after being incubated in DMEM medium (containing 10% fetal bovine serum) revealed that the cell culture conditions did not influence the fluorescence intensity (Fig. S14†). Therefore, it can be inferred that under the reduction of intracellular reductants, the released and un-released hydrophobic TPE moieties in the CSEG-g-TPE MGs underwent self-assembly, leading to higher aggregation degrees and stronger AIE effect.To further validate the inference of intracellular reduction-responsive decomposition–assembly and to directly analyze the microscopic morphology changes of the MGs in this process, the MGs in the cells were observed by cross-sectional (ultramicrotomy) TEM. Compared with the structures and molecules in the cells, the CSEG-g-TPE MGs have relatively large sizes, enabling the easy distinguishing from the cellular compartments and the direct observation of the nano-/micro-structures formed by intracellular stimuli-responsive self-assembly. As shown in Fig. 7a and b, after co-incubating with the cells for 24 h, the MGs were found in the cytoplasm, which maintained a spherical shape without obvious deformation. Higher magnification TEM images exhibited that nano-aggregates with sizes from tens to hundreds of nanometers formed on the periphery of the MGs in both HepG2 (Fig. 7c) and HepLi (Fig. 7d) cells. Moreover, in A549 cells (Fig. S15a and c†) and SMC cells (Fig. S15b and d†), similar phenomena were observed, revealing the universality of this in situ formation of micro–nano composite structures in living cells. In stark contrast, the morphology of the internalized ADEG-g-TPE MGs remained unchanged compared with that of the un-internalized ones (Fig. 8a), after having been co-incubated with HepG2 (Fig. 8b and d) and HepLi (Fig. 8c and e) cells for 24 h. These results demonstrate that the reduction-responsive self-assembly has taken place when the CSEG-g-TPE MGs are maintained in the cell milieu, leading to the in situ formation of microgel/nano-spike composite structures.
Influence of reduction-responsive decomposition–assembly on intracellular thiol levels
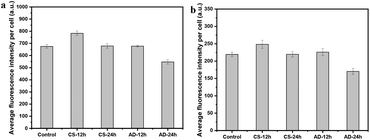
In the intracellular morphology evolution process, the chemical changes of CSEG-g-TPE MGs in cells play an essential role, where the original disulfide bonds in the polymer side chains are expected to be cleaved under cytosolic reductions and thus the intracellular thiol levels can be altered within a certain time span. To detect the thiol levels in living cells, 5-chloromethylfluorescein diacetate (CMFDA) was used as a probe. It can freely diffuse into the cells, where its thiol-reactive chloromethyl moiety reacts with intracellular thiols and their acetate group is cleaved by cytoplasmic esterases, generating the fluorescent product.53,54 As shown in Fig. 9, after 12 h of co-incubation of the CSEG-g-TPE MGs with HepG2 (Fig. 9a) and HepLi (Fig. 9b) cells, the average fluorescence intensities of the probe per cell were increased by 16% and 13%, respectively, compared with the corresponding control groups, where the cells were incubated with the cell culture medium only. However, the cells incubated with the ADEG-g-TPE MGs for 12 h showed thiol levels similar to that of the control groups. Disulfide bonds present in the structure of CSEG-g-TPE MGs are readily reduced in the reducing intracellular environment, which is mediated by thiol/disulfide exchange reactions with small redox molecules such as GSH and thioredoxin, either alone or with the help of redox enzymes.55,56 In these thiol/disulfide exchange reactions, the thiol numbers remain unchanged. However, some oxidized redox molecules can be regenerated to restore the thiols by subsequent biochemical reactions, which are usually catalyzed by the corresponding reductase. For example, oxidized thioredoxin can be reduced by thioredoxin reductase, which in turn is reduced by nicotinamide adenine dinucleotide phosphate (NADPH).57,58 As a result, the intracellular thiol levels are temporarily elevated as shown above. Therefore, it can be verified that the internalized CSEG-g-TPE MGs were reduced by the intracellular reductants such as GSH at the disulfide bond sites, producing thiols. In this decomposition process, the released TPE moieties and those conjugated on the polymer matrix self-assembled to form the nano-spikes on the CSEG-g-TPE MGs, as demonstrated in the TPE fluorescence monitoring and cross-section TEM analysis results. When the co-incubation time was prolonged to 24 h, the probed thiol levels of the CSEG-g-TPE MG groups returned to normal ones similar to that of the control groups, which should result from cell regulation to maintain redox homeostasis. In contrast, the ADEG-g-TPE MG groups showed obviously decreased thiol levels compared with the normal control groups, indicating increased oxidative stress, which could be harmful to cells.Influence of MGs on cytoviability
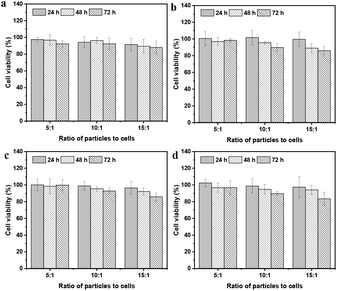
Now that the reduction-responsive decomposition–assembly and enhanced AIE effect of CSEG-g-TPE MGs in living cells have been demonstrated, the question then arises regarding the effect of this process on cell viability. Toward this end, a standard MTT assay was applied to investigate the cytotoxicity of the MGs. The CSEG-g-TPE MGs had very limited influence on cytoviability when they were incubated with HepG2 or HepLi cells for 24 h at a particle-to-cell ratio of 5![[thin space (1/6-em)]](https://www.rsc.org/images/entities/char_2009.gif) :
:![[thin space (1/6-em)]](https://www.rsc.org/images/entities/char_2009.gif) 1, 10
1, 10![[thin space (1/6-em)]](https://www.rsc.org/images/entities/char_2009.gif) :
:![[thin space (1/6-em)]](https://www.rsc.org/images/entities/char_2009.gif) 1 and 15
1 and 15![[thin space (1/6-em)]](https://www.rsc.org/images/entities/char_2009.gif) :
:![[thin space (1/6-em)]](https://www.rsc.org/images/entities/char_2009.gif) 1 (Fig. 10a and b). For either kind of cell, the cell viability decreased slightly as the feeding particle-to-cell ratio increased, which was due to more cellular uptake. When the co-incubation time was prolonged to 48 h and 72 h, the cell viability was slightly decreased. Nonetheless, at the highest particle-to-cell ratio of 15
1 (Fig. 10a and b). For either kind of cell, the cell viability decreased slightly as the feeding particle-to-cell ratio increased, which was due to more cellular uptake. When the co-incubation time was prolonged to 48 h and 72 h, the cell viability was slightly decreased. Nonetheless, at the highest particle-to-cell ratio of 15![[thin space (1/6-em)]](https://www.rsc.org/images/entities/char_2009.gif) :
:![[thin space (1/6-em)]](https://www.rsc.org/images/entities/char_2009.gif) 1 and a co-incubation time of 72 h, the viability of HepG2 cells and HepLi cells was still above 85%. The viability of HepG2 cells was a bit lower than that of HepLi cells at the same particle-to-cell ratio and co-incubation time, likely due to the larger internalization of the CSEG-g-TPE MGs by the HepG2 cells. The ADEG-g-TPE MGs exhibited similar low cytotoxicity to that of the CSEG-g-TPE MGs (Fig. 10c and d). Overall, the low cytotoxicity of CSEG-g-TPE MGs ensures their applicability in cellular biology as a new type of imaging agent to investigate the intracellular evolution of micro–nano composite structures.
1 and a co-incubation time of 72 h, the viability of HepG2 cells and HepLi cells was still above 85%. The viability of HepG2 cells was a bit lower than that of HepLi cells at the same particle-to-cell ratio and co-incubation time, likely due to the larger internalization of the CSEG-g-TPE MGs by the HepG2 cells. The ADEG-g-TPE MGs exhibited similar low cytotoxicity to that of the CSEG-g-TPE MGs (Fig. 10c and d). Overall, the low cytotoxicity of CSEG-g-TPE MGs ensures their applicability in cellular biology as a new type of imaging agent to investigate the intracellular evolution of micro–nano composite structures.
Conclusions
An original strategy is proposed for fabricating uniform microgels with polymers and AIE groups by taking advantage of a templating and crosslinking method. The CSEG-g-TPE MGs were prepared and were transformed into a novel kind of micro–nano composite structure by reduction-responsive decomposition–assembly under reductive conditions. The in situ formation of microgel/nano-spike composite structures in different kinds of living cells was observed, which has rarely been reported to the best of our knowledge. The fluorescence intensity of the TPE groups was improved as a result of the intensified AIE effect, indicating nano-spike protrusion by TPE aggregation which was triggered by the cleavage of disulfide bonds in CSEG-g-TPE under the reducing effect of reductants such as GSH in the cells. Our stimuli-responsive microgels with a relatively large size and AIE groups as self-assembly blocks, which makes the visualization and monitoring of intracellular self-assembly possible, have the potential to serve as a promising platform to cope with the challenging task of probing controlled self-assembly in the cell milieu and also in vivo, leading to new insights into investigating biological self-assembly and promoting the development of materials science by learning from nature. In principle, this method can be generalized to various kinds of polymers and functional groups, and the size and morphology of the MGs can be adjusted through tailoring the template particles. By choosing the self-assembly units as the functional groups such as far-red and near-infrared AIE moieties for imaging such as quinoline–malononitrile derivatives59 and the photosensitizer porphyrin such as Chlorin e6,10,60 and the labile bonds as the externally controllable trigger sites such as light-responsive bonds, the in situ self-assembled structures can be facilely elaborated, which are expected to lead to unique biosensing and therapeutic effect.10 Moreover, with the help of 3D imaging techniques such as focused ion beam scanning electron microscopy (FIB-SEM), the fine 3D structures of the in situ formed self-assemblies can be analyzed to provide a more comprehensive view of biological self-assembly. Therefore, this strategy could allow the further study of intracellular self-assembly in the context of interactions with cells, and intracellular detection or delivery by taking advantage of the AIE effect and unique structured therapeutics.Experimental methods
Synthesis of N-tert-butoxycarbonyl-N′-acryloyl-cystamine (Ac-Cys-tBoc)
Cystamine dihydrochloride (10.00 g, 44.40 mmol) was added into anhydrous methanol (MeOH) (100 mL) in a 500 mL round-bottomed flask, and the mixture was cooled down with an ice bath. Then, triethylamine (13.48 g, 13.22 mmol) was added and the mixture was magnetically stirred until it turned transparent. Di-tert-butyl dicarbonate (4.86 g, 44.45 mmol) was dissolved in MeOH (100 mL) and was cooled down under −20 °C for 30 min. Then, the di-tert-butyl dicarbonate solution was added dropwise into the above cystamine dihydrochloride solution over 5 h in an ice bath. After maintaining in the ice bath overnight, the solvent was removed completely under reduced pressure. Then, 1 M KH2PO4 aqueous solution (300 mL, pH 4.2) was added. After removal of the insoluble solids, the aqueous phase was extracted with diethyl ether (3 × 200 mL) to remove the N,N′-di-tert-butyloxycarbonyl cystamine. The pH value was then adjusted to 9 with 1 M NaOH, followed with extraction with ethyl acetate (7 × 200 mL). The collected organic phase was dried over anhydrous Na2SO4 and then filtered. After the solvent was removed, N-tert-butoxycarbonyl cystamine (Cys-tBoc) was obtained as a slightly yellow-coloured oil (4.00 g, 36.0%).Cys-tBoc (4.00 g, 15.88 mmol) and triethylamine (3.36 g, 33.20 mmol) were dissolved in 80 mL of chloroform. After cooled down under −20 °C, it was dropwise added to a magnetically stirred solution of acryloyl chloride (2.84 g, 31.4 mmol) in chloroform (80 mL) placed in an ice bath over 2 h. After maintaining for 24 h, the reaction solution was evaporated under vacuum to remove the solvent. The residue was washed with water (240 mL) and extracted with chloroform (3 × 100 mL). The combined organic phase was dried over anhydrous Na2SO4 and was filtered. After removal of the solvent, Ac-Cys-tBoc was yielded as a light yellow solid (4.24 g, 88.4%). 1H NMR (500 MHz, CDCl3, Fig. S1†): δ = 1.45 (s, 9H, Boc CH3), 2.80 (t, 2H, CH2–S), 2.89 (t, 2H,CH2–S), 3.45 (t, 2H, –NH–CH2), 3.65 (t, 2H, –CH2–NH–), 5.07 (1H, amide proton), 5.64 (m, 1H, vinyl proton), 6.17–6.36 (m, 2H, vinyl proton), 6.81 (1H, amide proton). MS (ESI/APCI) (C12H22N2S2O3: exact mass = 306.4): calcd m/z for [M + Na+], 329.4; found 328.9.
Synthesis of poly[(N-acryloyl-cystamine)-co-[poly(ethylene glycol)]] (CSEG)
First, poly[(N-tert-butoxycarbonyl-N′-acryloyl-cystamine)-co-[poly-(ethylene glycol)]] (CSBEG) was synthesized by free radical polymerization of Ac-Cys-tBoc and poly(ethylene glycol) methacrylate (PEGMA, average Mn 360 Da). Ac-Cys-tBoc (200.00 mg, 0.65 mmol), PEGMA (46.96 mg, 0.13 mmol) and 2,2-azobis(2-methylpropionitrile) (AIBN) (2.13 mg, 0.013 mmol) were dissolved in 11 mL of anisole in a 25 mL Schlenk tube. The mixture was degassed by a cyclic freeze–pump–thaw method three times. Then, the Schlenk tube was backfilled with nitrogen and sealed. The reaction system was heated at 65 °C for 12 h under magnetic agitation. The product was purified by precipitation in cold ether three times and dried in a vacuum for 24 h to yield CSEBG as a transparent viscous solid (100 mg, 40.5%).The 1H NMR spectrum (500 MHz, CDCl3, Fig. S2†) of CSBEG shows the characteristic peaks of [Ac-Cys-tBoc] (Boc CH3, δ = 1.44; CH2–S, δ = 2.82; CH2–N, δ = 3.43) and PEGMA (–COO–CH2, δ = 4.17; –O–CH2, δ = 3.65), and the proton peaks of CH2![[double bond, length as m-dash]](https://www.rsc.org/images/entities/char_e001.gif) CH in Ac-Cys-tBoc monomers disappeared, indicating the successful copolymerization of Ac-Cys-tBoc and PEGMA. The copolymerization ratio of [Ac-Cys-tBoc] to [PEGMA] in CSBEG was determined to be 2
CH in Ac-Cys-tBoc monomers disappeared, indicating the successful copolymerization of Ac-Cys-tBoc and PEGMA. The copolymerization ratio of [Ac-Cys-tBoc] to [PEGMA] in CSBEG was determined to be 2![[thin space (1/6-em)]](https://www.rsc.org/images/entities/char_2009.gif) :
:![[thin space (1/6-em)]](https://www.rsc.org/images/entities/char_2009.gif) 1 (mol mol−1) based on the integrals of the Boc CH3 peak and the –COO–CH2 peak.
1 (mol mol−1) based on the integrals of the Boc CH3 peak and the –COO–CH2 peak.
To the solution of CSBEG (100 mg) in CH2Cl2 (4 mL) placed in an ice bath, trifluoroacetic acid (2 mL) was added dropwise. The reaction was maintained under magnetic agitation for 4 h. Then, the solution was evaporated under vacuum to remove the solvents. The CSEG, free of tBoc groups, was obtained as a transparent viscous solid.
Synthesis of amphiphilic copolymer CSEG-g-TPE
TPE-CHO molecules (AIEgen Biotech Co., Ltd, Shenzhen, China) were conjugated to CSEG to obtain CSEG-g-TPE via a one-step procedure. First, CSEG (containing 0.260 mmol –NH2), TPE-CHO (14.70 mg, 0.041 mmol) and triethylamine (100 mg, 0.990 mmol) were dissolved in anhydrous methanol (MeOH) (10 mL) in a 50 mL round-bottomed flask placed in a 37 °C water bath. The reaction was maintained under magnetic agitation for 24 h. The product was purified by precipitation in cold ether three times to yield CSEG-g-TPE as a yellow viscous solid. The chemical structure of CSEG-g-TPE was characterized with 1H NMR spectroscopy (500 MHz, CD3OD, Fig. S5†).Preparation of CSEG-g-TPE MGs and ADEG-g-TPE MGs
First, spherical CaCO3 microparticles were prepared by mineralization of Ca(NO3)2 and Na2CO3 solutions. Briefly, 5 mL of 0.22 mol L−1 Ca(NO3)2 solution was rapidly poured into 5 mL of 0.33 mol L−1 Na2CO3 solution under magnetic agitation at 1200 rpm. 30 s later, the solution was kept undisturbed for 5 min. CaCO3 microparticles with an average diameter of approximately 3 μm were obtained, which were washed three times with water and ethanol, respectively. The obtained CaCO3 microparticles were stored in anhydrous ethanol (10 mL) before use.The CaCO3 microparticle suspension (1 mL) was centrifuged (1500 rpm, 3 min) to remove the supernatant ethanol and was placed in a vacuum oven (37 °C) to remove ethanol completely. The amphiphilic copolymers CSEG-g-TPE/MeOH or ADEG-g-TPE/MeOH solution (10 mg mL−1, 200 μL) were mixed with the CaCO3 microparticles. Then, the suspension was placed under vacuum until about 50 μL of solution was left. In this process, the CSEG-g-TPE or ADEG-g-TPE molecules were loaded into the porous CaCO3 microparticles. The process of solution adding and loading under vacuum was repeated 5 times so that sufficient CSEG-g-TPE or ADEG-g-TPE molecules were loaded. The excess amount of CSEG-g-TPE or ADEG-g-TPE molecules was removed, and the particles were washed with ethanol (100 μL) once.
The obtained polymer-loaded CaCO3 particles were then dispersed in glutaraldehyde (GA) aqueous solution (25%, 100 μL) for 2 h at 37 °C to crosslink the CSEG-g-TPE or ADEG-g-TPE molecules. After crosslinking, the particles were washed with MeOH and water three times, respectively. Arginine aqueous solution (20 mg mL−1, 1 mL) was added to neutralize the excess aldehyde groups of GA. After maintaining at 37 °C for 1 h, the particles were washed with water three times and were then incubated in 2 mL of ethylenediamine tetraacetic acid (EDTA) solution (0.2 M, pH = 7.3) for 1 h at 37 °C to remove the CaCO3 template. The obtained microgels were washed with water three times and dispersed in 1 mL of water, and then modified with Tat peptides (0.5 mL, 2 mg mL−1) overnight. Finally, the microgels were centrifuged (5000 rpm, 10 min) to remove the excess Tat peptides, and then dispersed in 2 mL of water and stored at 4 °C before use. The successful modification of Tat peptides was verified by zeta potential increase of the MGs compared with the un-modified ones and by measuring the remaining amount of Tat peptides with the Biuret method (data not shown).
Reduction-responsive decomposition–assembly of MGs
The as-prepared CSEG-g-TPE MGs were incubated and dispersed in GSH (5 mM), dithiothreitol (DTT) (5 mM), lysed HepG2 cell (human liver hepatocellular carcinoma cells) solution or lysed HepLi cell (primary human normal hepatocytes) solution at 37 °C for different times. The lysed cell solutions were prepared by dispersing HepG2 or HepLi cells in phosphate-buffered saline (PBS, 0.01 M, pH 7.4) at a concentration of 106 mL−1. After they were lysed by intensive sonication, the cell fragments were removed by centrifugation to obtain the lysed cell solutions. At the desired time intervals, one portion of the CSEG-g-TPE MGs solution was removed for characterization. The decomposition–assembled process was monitored with transmission electron microscopy (TEM). The fluorescence intensity of TPE in CSEG-g-TPE MGs was measured with a microplate reader (M200 Pro, Tecan). As a comparison, the ADEG-g-TPE MGs were subjected to the same experimental conditions and characterization methods.Cell cultures
The HepG2 cells, A549 cells (human lung adenocarcinoma epithelial cells) and SMCs (human primary pulmonary artery smooth muscle cells) were purchased from the Cell Bank of Typical Culture Collection of the Chinese Academy of Sciences (Shanghai, China). The HepLi cells were obtained from the First Affiliated Hospital, College of Medicine, Zhejiang University. The HepG2 and SMCs were cultured in high-glucose Dulbecco's modified Eagle's medium (DMEM) (Gibco, USA). The A549 cells were cultured in Roswell Park Memorial Institute (RPMI) 1640 medium (Gibco, USA). The HepLi cells were cultured in low-glucose DMEM (Gibco, USA). The medium was supplemented with 10% fetal bovine serum (FBS, Gibco), 100 U mL−1 penicillin and 100 μg mL−1 streptomycin. The FBS was treated by heating at 56 °C for 30 min before use. The cells were incubated in an incubator at 37 °C supplied with 5% CO2 and 100% humidity.Cellular uptake of MGs
The cellular uptake performance of CSEG-g-TPE and ADEG-g-TPE MGs was analyzed with flow cytometry and confocal laser scanning microscopy (CLSM). For the flow cytometry measurement, HepG2 or HepLi cells were seeded at a density of 7.5 × 10⁴ cells per well on 24-well plates and were allowed to attach for 24 h. Then, fluorescein isothiocyanate (FITC)-labeled CSEG-g-TPE or FITC-labeled ADEG-g-TPE MGs were added to each well (particles![[thin space (1/6-em)]](https://www.rsc.org/images/entities/char_2009.gif) :
:![[thin space (1/6-em)]](https://www.rsc.org/images/entities/char_2009.gif) cells = 15
cells = 15![[thin space (1/6-em)]](https://www.rsc.org/images/entities/char_2009.gif) :
:![[thin space (1/6-em)]](https://www.rsc.org/images/entities/char_2009.gif) 1). The cells and particles were co-incubated for different times (3 h, 6 h, 12 h and 24 h). After being washed with PBS three times to remove the free particles, the cells were detached by trypsinization, and then dispersed in PBS at a concentration of about 1.6 × 10⁵ mL−1. The average fluorescence intensity per cell and the ratio of cells with fluorescence were measured with flow cytometry (FACS Calibur, BD). For the CLSM measurement, the HepG2, HepLi, A549 or SMC cells were seeded at a density of 5 × 10⁴ on a 20 mm cell culture dish with a glass bottom and were cultured for 24 h. Then, the cells were incubated with CSEG-g-TPE or ADEG-g-TPE MGs at a particle-to-cell ratio of 15
1). The cells and particles were co-incubated for different times (3 h, 6 h, 12 h and 24 h). After being washed with PBS three times to remove the free particles, the cells were detached by trypsinization, and then dispersed in PBS at a concentration of about 1.6 × 10⁵ mL−1. The average fluorescence intensity per cell and the ratio of cells with fluorescence were measured with flow cytometry (FACS Calibur, BD). For the CLSM measurement, the HepG2, HepLi, A549 or SMC cells were seeded at a density of 5 × 10⁴ on a 20 mm cell culture dish with a glass bottom and were cultured for 24 h. Then, the cells were incubated with CSEG-g-TPE or ADEG-g-TPE MGs at a particle-to-cell ratio of 15![[thin space (1/6-em)]](https://www.rsc.org/images/entities/char_2009.gif) :
:![[thin space (1/6-em)]](https://www.rsc.org/images/entities/char_2009.gif) 1 for 24 h. After being washed with PBS three times to remove the free particles, 1 mL of cell culture medium without phenol red indicator and fetal bovine serum was added into the dish. Images were acquired using a Zeiss LSM 780 CLSM (63×/1.4 NA oil immersion objective using commercial software). The MGs were excited at 405 nm and 488 nm, and the detection wavelengths were 424–486 nm and 498–550 nm, respectively.
1 for 24 h. After being washed with PBS three times to remove the free particles, 1 mL of cell culture medium without phenol red indicator and fetal bovine serum was added into the dish. Images were acquired using a Zeiss LSM 780 CLSM (63×/1.4 NA oil immersion objective using commercial software). The MGs were excited at 405 nm and 488 nm, and the detection wavelengths were 424–486 nm and 498–550 nm, respectively.
Fluorescence intensity measurement of TPE in MGs in cells
The fluorescence intensity of TPE in CSEG-g-TPE and ADEG-g-TPE MGs in cells were analyzed with CLSM and ImageJ software. For the CLSM measurement, the HepG2 or HepLi cells were seeded at a density of 5 × 10⁴ on a 20 mm cell culture dish with a glass bottom and were cultured for 24 h. Then, the cells were incubated with CSEG-g-TPE or ADEG-g-TPE MGs at a particle-to-cell ratio of 15![[thin space (1/6-em)]](https://www.rsc.org/images/entities/char_2009.gif) :
:![[thin space (1/6-em)]](https://www.rsc.org/images/entities/char_2009.gif) 1 for 3 h, 6 h, 12 h or 24 h, respectively. After being washed with PBS three times to remove the free particles, 1 mL of DMEM without phenol red indicator and fetal bovine serum was added into the dish. Images were acquired using a Zeiss LSM 780 CLSM (63×/1.4 NA oil immersion objective using commercial software). The MGs were excited at 405 nm and were detected within 424–486 nm using a filter. The parameters (laser power, pinhole, detector gain, digital offset, digital gain, etc.) during image recording were kept the same. For each sample, at least six fields of view were recorded in different places of the dish bottom. Each field of view included 50–60 cells. The TPE fluorescence intensity in the CLSM images was analysed quantitatively with ImageJ software.
1 for 3 h, 6 h, 12 h or 24 h, respectively. After being washed with PBS three times to remove the free particles, 1 mL of DMEM without phenol red indicator and fetal bovine serum was added into the dish. Images were acquired using a Zeiss LSM 780 CLSM (63×/1.4 NA oil immersion objective using commercial software). The MGs were excited at 405 nm and were detected within 424–486 nm using a filter. The parameters (laser power, pinhole, detector gain, digital offset, digital gain, etc.) during image recording were kept the same. For each sample, at least six fields of view were recorded in different places of the dish bottom. Each field of view included 50–60 cells. The TPE fluorescence intensity in the CLSM images was analysed quantitatively with ImageJ software.
The decomposition–assembly performance of MGs in cells
The decomposition–assembly performance of MGs in cells was observed using TEM. The HepG2, HepLi, A549, or SMC cells were seeded at a density of 3 × 10⁵ per well on 6-well plates and were cultured for 24 h. Then, the cells were incubated with CSEG-g-TPE or ADEG-g-TPE MGs at a particle-to-cell ratio of 15![[thin space (1/6-em)]](https://www.rsc.org/images/entities/char_2009.gif) :
:![[thin space (1/6-em)]](https://www.rsc.org/images/entities/char_2009.gif) 1 for 24 h. After being washed with PBS three times to remove the free particles, the cells were detached with 0.3 mL trypsin and were then fixed with GA (2.5% in 0.01 M PBS, pH = 7.4) at 4 °C for 24 h. The cells were washed three times with phosphate-buffered saline (PBS, 0.1 M, pH = 7.4), each for 15 min. They were then dehydrated by a graded series of ethanol (30, 50, 70, 80, 90, 95, and 100%), each for 15 min. After incubating in 1
1 for 24 h. After being washed with PBS three times to remove the free particles, the cells were detached with 0.3 mL trypsin and were then fixed with GA (2.5% in 0.01 M PBS, pH = 7.4) at 4 °C for 24 h. The cells were washed three times with phosphate-buffered saline (PBS, 0.1 M, pH = 7.4), each for 15 min. They were then dehydrated by a graded series of ethanol (30, 50, 70, 80, 90, 95, and 100%), each for 15 min. After incubating in 1![[thin space (1/6-em)]](https://www.rsc.org/images/entities/char_2009.gif) :
:![[thin space (1/6-em)]](https://www.rsc.org/images/entities/char_2009.gif) 1 and 1
1 and 1![[thin space (1/6-em)]](https://www.rsc.org/images/entities/char_2009.gif) :
:![[thin space (1/6-em)]](https://www.rsc.org/images/entities/char_2009.gif) 3 (v/v) mixtures of absolute ethanol/Spurr resin for 45 min and 2.5 h at room temperature, respectively, the cells were transferred to a pure Spurr resin and were incubated overnight. Heating at 70 °C was performed for about 9 h to obtain the embedded samples, which were ultrathin sectioned with a LEICA EM UC7 ultra microtome. After being stained with uranyl acetate and alkaline lead citrate for 15 min, respectively, the samples were observed under a JEM-1230EX TEM instrument (JEOL, Tokyo, Japan) at an accelerating voltage of 80 kV.
3 (v/v) mixtures of absolute ethanol/Spurr resin for 45 min and 2.5 h at room temperature, respectively, the cells were transferred to a pure Spurr resin and were incubated overnight. Heating at 70 °C was performed for about 9 h to obtain the embedded samples, which were ultrathin sectioned with a LEICA EM UC7 ultra microtome. After being stained with uranyl acetate and alkaline lead citrate for 15 min, respectively, the samples were observed under a JEM-1230EX TEM instrument (JEOL, Tokyo, Japan) at an accelerating voltage of 80 kV.
Cell viability assay
Cell viability was determined with methyl thiazolyl tetrazolium (MTT) assay. HepG2 or HepLi cells were seeded at a density of 5 × 10³ cells per well on 96-well plates and were incubated for 24 h. Then, the cells were incubated with CSEG-g-TPE or ADEG-g-TPE MGs at a particle to cell ratio of 5![[thin space (1/6-em)]](https://www.rsc.org/images/entities/char_2009.gif) :
:![[thin space (1/6-em)]](https://www.rsc.org/images/entities/char_2009.gif) 1, 10
1, 10![[thin space (1/6-em)]](https://www.rsc.org/images/entities/char_2009.gif) :
:![[thin space (1/6-em)]](https://www.rsc.org/images/entities/char_2009.gif) 1 and 15
1 and 15![[thin space (1/6-em)]](https://www.rsc.org/images/entities/char_2009.gif) :
:![[thin space (1/6-em)]](https://www.rsc.org/images/entities/char_2009.gif) 1 for 24, 48 and 72 h, respectively, followed by washing three times with PBS to remove the free particles. Thereafter, 100 μL of cell culture medium (without phenol red indicator) and 20 μL of MTT/PBS solution (5 mg mL−1) were added into each well. After 3.5 h incubation at 37 °C, the solution was removed carefully. Into each well, 100 μL of dimethyl sulfoxide (DMSO) was added to dissolve the purple formazan crystals generated by the mitochondrial dehydrogenase. After incubation at 37 °C for 15 min, 50 μL of formazan/DMSO solution was pipetted into a well of another new 96-well plate. The absorbance at 565 nm was measured using a microplate reader (M200 Pro, Tecan). Cell viability was expressed as the ratio of absorbance of the experimental groups to that of the control group, where the cells were incubated with cell culture medium only. Data were expressed as mean ± SD (n = 5).
1 for 24, 48 and 72 h, respectively, followed by washing three times with PBS to remove the free particles. Thereafter, 100 μL of cell culture medium (without phenol red indicator) and 20 μL of MTT/PBS solution (5 mg mL−1) were added into each well. After 3.5 h incubation at 37 °C, the solution was removed carefully. Into each well, 100 μL of dimethyl sulfoxide (DMSO) was added to dissolve the purple formazan crystals generated by the mitochondrial dehydrogenase. After incubation at 37 °C for 15 min, 50 μL of formazan/DMSO solution was pipetted into a well of another new 96-well plate. The absorbance at 565 nm was measured using a microplate reader (M200 Pro, Tecan). Cell viability was expressed as the ratio of absorbance of the experimental groups to that of the control group, where the cells were incubated with cell culture medium only. Data were expressed as mean ± SD (n = 5).
Detection of intracellular thiol
The thiol level in living cells was analyzed with flow cytometry using 5-chloromethylfluorescein diacetate (CMFDA) as the probe. HepG2 or HepLi cells were seeded at a density of 7.5 × 10⁴ cells per well on 24-well plates and were allowed to attach for 24 h. Then, CSEG-g-TPE or ADEG-g-TPE MGs were added to each well (particles![[thin space (1/6-em)]](https://www.rsc.org/images/entities/char_2009.gif) :
:![[thin space (1/6-em)]](https://www.rsc.org/images/entities/char_2009.gif) cells = 15
cells = 15![[thin space (1/6-em)]](https://www.rsc.org/images/entities/char_2009.gif) :
:![[thin space (1/6-em)]](https://www.rsc.org/images/entities/char_2009.gif) 1). The cells and particles were co-incubated for 12 h and 24 h, respectively. After being washed with PBS three times to remove the free particles, the cells were detached by trypsinization and washed three times with PBS. The detached cells were incubated in CMFDA solution (1 μM) in the cell culture medium without phenol red indicator and fetal bovine serum at 37 °C for 15 min in the dark. After the CMFDA solution was removed, the cells were washed three times with PBS and dispersed in cell culture medium without phenol red indicator and fetal bovine serum at a concentration of about 1.6 × 10⁵ mL−1. The average fluorescence intensity per cell and the ratio of cells with fluorescence were measured with flow cytometry (FACS Calibur, BD). The control groups were set as follows: cells incubated with cell culture medium only without staining, cells incubated with cell culture medium only with staining, and cells incubated with MGs without staining.
1). The cells and particles were co-incubated for 12 h and 24 h, respectively. After being washed with PBS three times to remove the free particles, the cells were detached by trypsinization and washed three times with PBS. The detached cells were incubated in CMFDA solution (1 μM) in the cell culture medium without phenol red indicator and fetal bovine serum at 37 °C for 15 min in the dark. After the CMFDA solution was removed, the cells were washed three times with PBS and dispersed in cell culture medium without phenol red indicator and fetal bovine serum at a concentration of about 1.6 × 10⁵ mL−1. The average fluorescence intensity per cell and the ratio of cells with fluorescence were measured with flow cytometry (FACS Calibur, BD). The control groups were set as follows: cells incubated with cell culture medium only without staining, cells incubated with cell culture medium only with staining, and cells incubated with MGs without staining.
Statistical analysis
Data are expressed as mean ± standard deviation (SD). Statistical analysis was determined with one-way analysis of variance (ANOVA) with Origin software. Means comparison was performed with Tukey's method. A p value < 0.05 is considered statistically significant.Conflicts of interest
There are no conflicts to declare.Acknowledgements
This work is financially supported by the National Natural Science Foundation of China (51873188), the National Key Research and Development Program of China (2016YFC1100403), and the Fundamental Research Funds for the Central Universities of China (2020XZZX004-01).Notes and references
- Y. Zhao, F. Sakai, L. Su, Y. J. Liu, K. C. Wei, G. S. Chen and M. Jiang, Adv. Mater., 2013, 25, 5215–5256 CrossRef CAS.
- G. M. Whitesides and B. Grzybowski, Science, 2002, 295, 2418–2421 CrossRef CAS.
- G. A. Ozin, K. Hou, B. V. Lotsch, L. Cademartiri, D. P. Puzzo, F. Scotognella, A. Ghadimi and J. Thomson, Mater. Today, 2009, 12, 12–23 CrossRef CAS.
- X. Zhang, S. Rehm, M. M. Safont-Sempere and F. Wurthner, Nat. Chem., 2009, 1, 623–629 CrossRef CAS.
- T. Aida, E. W. Meijer and S. I. Stupp, Science, 2012, 335, 813–817 CrossRef CAS.
- K. Ariga, J. P. Hill, M. V. Lee, A. Vinu, R. Charvet and S. Acharya, Sci. Technol. Adv. Mater., 2008, 9, 014109 CrossRef.
- M. A. C. Stuart, W. T. S. Huck, J. Genzer, M. Muller, C. Ober, M. Stamm, G. B. Sukhorukov, I. Szleifer, V. V. Tsukruk, M. Urban, F. Winnik, S. Zauscher, I. Luzinov and S. Minko, Nat. Mater., 2010, 9, 101–113 CrossRef.
- E. G. Kelley, J. N. L. Albert, M. O. Sullivan and T. H. Epps, Chem. Soc. Rev., 2013, 42, 7057–7071 RSC.
- W. B. Zhang and C. Y. Gao, J. Mater. Chem. A, 2017, 5, 16059–16104 RSC.
- W. B. Zhang, H. Y. Li, Y. Qin and C. Y. Gao, Mater. Horiz., 2017, 4, 1135–1144 RSC.
- G. L. Liang, H. J. Ren and J. H. Rao, Nat. Chem., 2010, 2, 54–60 CrossRef CAS.
- D. J. Ye, G. L. Liang, M. L. Ma and J. H. Rao, Angew. Chem., Int. Ed., 2011, 50, 2275–2279 CrossRef CAS.
- D. J. Ye, A. J. Shuhendler, L. N. Cui, L. Tong, S. S. Tee, G. Tikhomirov, D. W. Felsher and J. H. Rao, Nat. Chem., 2014, 6, 519–526 CrossRef CAS.
- Y. Y. Zhao, X. Zhang, Z. P. Li, S. D. Huo, K. Zhang, J. T. Gao, H. Wang and X. J. Liang, Adv. Mater., 2017, 29, 1601128 CrossRef.
- M. Z. Zhao, D. B. Cheng, Z. R. Shang, L. Wang, Z. Y. Qiao, J. P. Zhang and H. Wang, Chin. J. Polym. Sci., 2018, 36, 1103–1113 CrossRef CAS.
- J. Zhou, X. Du, J. Li, N. Yamagata and B. Xu, J. Am. Chem. Soc., 2015, 137, 10040–10043 CrossRef CAS.
- Y. Yuan, L. Wang, W. Du, Z. L. Ding, J. Zhang, T. Han, L. N. An, H. F. Zhang and G. L. Liang, Angew. Chem., Int. Ed., 2015, 54, 9700–9704 CrossRef CAS.
- Q. Miao, X. Bai, Y. Shen, B. Mei, J. Gao, L. Li and G. Liang, Chem. Commun., 2012, 48, 9738–9740 RSC.
- D. Zhang, G. B. Qi, Y. X. Zhao, S. L. Qiao, C. Yang and H. Wang, Adv. Mater., 2015, 27, 6125–6130 CrossRef CAS.
- Y. Gao, J. F. Shi, D. Yuan and B. Xu, Nat. Commun., 2012, 3, 1033 CrossRef.
- Y. Yuan, S. C. Ge, H. B. Sun, X. J. Dong, H. X. Zhao, L. N. An, J. Zhang, J. F. Wang, B. Hu and G. L. Liang, ACS Nano, 2015, 9, 5117–5124 CrossRef CAS.
- E. G. Zhao, Y. L. Chen, S. J. Chen, H. Q. Deng, C. Gui, C. W. T. Leung, Y. N. Hong, J. W. Y. Lam and B. Z. Tang, Adv. Mater., 2015, 27, 4931–4937 CrossRef CAS.
- J. Shi, S. Zhang, M. M. Zheng, Q. C. Deng, C. Zheng, J. Li and F. H. Huang, Sens. Actuators, B, 2017, 238, 765–771 CrossRef CAS.
- X. Peng, L. X. Cheng, X. Y. Zhu, Y. F. Geng, F. Y. Zhao, K. D. Hu, X. Guo, K. Deng and Q. D. Zeng, Nano Res., 2018, 11, 5823–5834 CrossRef CAS.
- H. T. Feng, S. Song, Y. C. Chen, C. H. Shen and Y. S. Zheng, J. Mater. Chem. C, 2014, 2, 2353–2359 RSC.
- Z. J. Zhao, J. W. Y. Lam and B. Z. Tang, J. Mater. Chem., 2012, 22, 23726–23740 RSC.
- Y. W. Wu, A. J. Qin and B. Z. Tang, Chin. J. Polym. Sci., 2017, 35, 141–154 CrossRef CAS.
- R. Hu, X. Chen, T. T. Zhou, H. Si, B. Z. He, R. T. K. Kwok, A. J. Qin and B. Z. Tang, Sci. China: Chem., 2019, 62, 1198–1203 CrossRef CAS.
- J. Mei, N. L. C. Leung, R. T. K. Kwok, J. W. Y. Lam and B. Z. Tang, Chem. Rev., 2015, 115, 11718–11940 CrossRef CAS.
- M. Salimimarand, D. D. La, M. Al Kobaisi and S. V. Bhosale, Sci. Rep., 2017, 7, 42898 CrossRef CAS.
- H. T. Feng, Y. X. Yuan, J. B. Xiong, Y. S. Zheng and B. Z. Tang, Chem. Soc. Rev., 2018, 47, 7452–7476 RSC.
- Y. Wu, L. Qu, J. Li, L. Y. Huang and Z. P. Liu, Polymer, 2018, 158, 297–307 CrossRef CAS.
- D. D. La, J. N. Malegaonkar, M. Al Kobaisi, R. S. Bhosale, S. V. Bhosale and S. V. Bhosale, New J. Chem., 2018, 42, 15379–15386 RSC.
- J. J. Jiao, Z. J. Li, Z. W. Qiao, X. Li, Y. Liu, J. Q. Dong, J. W. Jiang and Y. Cui, Nat. Commun., 2018, 9, 8 CrossRef.
- H. K. Cheng, M. C. L. Yeung and V. W. W. Yam, ACS Appl. Mater. Interfaces, 2017, 9, 36220–36228 CrossRef CAS.
- Y. H. Wang, M. Zheng, F. H. Meng, J. Zhang, R. Peng and Z. Y. Zhong, Biomacromolecules, 2011, 12, 1032–1040 CrossRef CAS.
- W. B. Zhang, L. B. Xing, H. S. Wang, X. J. Liu, Y. Q. Feng and C. Y. Gao, Langmuir, 2015, 31, 4330–4340 CrossRef CAS.
- W. Zhang, Z. Zhai, S. Huang, Z. Mao, Y. Zhang and C. Gao, Giant, 2020, 3, 100026 CrossRef.
- D. M. Copolovici, K. Langel, E. Eriste and U. Langel, ACS Nano, 2014, 8, 1972–1994 CrossRef CAS.
- A. Gong, X. H. Ma, L. C. Xiang, W. Z. Ren, Z. Y. Shen and A. G. Wu, Colloids Surf., B, 2014, 116, 561–567 CrossRef CAS.
- W. Wei, L. Y. Wang, L. Yuan, Q. Wei, X. D. Yang, Z. G. Su and G. H. Ma, Adv. Funct. Mater., 2007, 17, 3153–3158 CrossRef CAS.
- Anuradha, D. D. La, M. Al Kobaisi, A. Gupta and S. V. Bhosale, Chem. Eur. J., 2017, 23, 3950–3956 CrossRef CAS.
- X. Wang, Y. Y. Yang, F. Yang, H. Shen and D. C. Wu, Polymer, 2017, 118, 75–84 CrossRef CAS.
- T. Wang, Y. Cai, Z. Wang, E. Guan, D. Yu, A. Qin, J. Sun, B. Z. Tang and C. Gao, Macromol. Rapid Commun., 2012, 33, 1584–1589 CrossRef CAS.
- Y. Dong, J. W. Lam, A. Qin, Z. Li, J. Sun, H. H. Sung, I. D. Williams and B. Z. Tang, Chem. Commun., 2007, 40–42, 10.1039/b613157c.
- Y. Yuan, R. T. Kwok, G. Feng, J. Liang, J. Geng, B. Z. Tang and B. Liu, Chem. Commun., 2014, 50, 295–297 RSC.
- S. Song, H. F. Zheng, H. T. Feng and Y. S. Zheng, Chem. Commun., 2014, 50, 15212–15215 RSC.
- S. Maghrebi, P. Joyce, M. Jambhrunkar, N. Thomas and C. A. Prestidge, ACS Appl. Mater. Interfaces, 2020, 12, 8030–8039 CrossRef CAS.
- T. H. Chung, S. H. Wu, M. Yao, C. W. Lu, Y. S. Lin, Y. Hung, C. Y. Mou, Y. C. Chen and D. M. Huang, Biomaterials, 2007, 28, 2959–2966 CrossRef CAS.
- H. Brooks, B. Lebleu and E. Vives, Adv. Drug Delivery Rev., 2005, 57, 559–577 CrossRef CAS.
- Y. Y. Yuan, R. T. K. Kwok, G. X. Feng, J. Liang, J. L. Geng, B. Tang and B. Liu, Chem. Commun., 2014, 50, 295–297 RSC.
- A. Meister, J. Biol. Chem., 1988, 263, 17205–17208 CAS.
- M. Poot, T. J. Kavanagh, H. C. Kang, R. P. Haugland and P. S. Rabinovitch, Cytometry, 1991, 12, 184–187 CrossRef CAS.
- J. Sebastia, R. Cristofol, M. Martin, E. Rodriguez-Farre and C. Sanfeliu, Cytometry, Part A, 2003, 51, 16–25 CrossRef.
- C. Wu, J. Li, Y. Zhu, J. Chen and D. Oupicky, Biomaterials, 2013, 34, 8843–8850 CrossRef CAS.
- H. Nakamura, K. Nakamura and J. Yodoi, Annu. Rev. Immunol., 1997, 15, 351–369 CrossRef CAS.
- N. Nagarajan, S. Oka and J. Sadoshima, Free Radical Biol. Med., 2017, 109, 125–131 CrossRef CAS.
- E. S. J. Arner and A. Holmgren, Eur. J. Biochem., 2000, 267, 6102–6109 CrossRef CAS.
- A. D. Shao, Y. S. Xie, S. J. Zhu, Z. Q. Guo, S. Q. Zhu, J. Guo, P. Shi, T. D. James, H. Tian and W. H. Zhu, Angew. Chem., Int. Ed., 2015, 54, 7275–7280 CrossRef CAS.
- C. Wang, H. Q. Tao, L. Cheng and Z. Liu, Biomaterials, 2011, 32, 6145–6154 CrossRef CAS.
Footnote |
| † Electronic supplementary information (ESI) available. See DOI: 10.1039/d0nr06661c |
| This journal is © The Royal Society of Chemistry 2021 |

