 Open Access Article
Selective switching of multiple plexcitons in colloidal materials: directing the energy flow at the nanoscale†
Nicola
Peruffo
 a,
Gabriel
Gil‡
a,
Stefano
Corni
a,
Gabriel
Gil‡
a,
Stefano
Corni
 abc,
Fabrizio
Mancin
 a and
Elisabetta
Collini
 *ac
*ac
aDepartment of Chemical Sciences, University of Padova, via Marzolo 1, 35131 Padova, Italy. E-mail: elisabetta.collini@unipd.it
bCNR-NANO Institute of Nanoscience, v. Campi 213/a, 41125 Modena, Italy
cPadua Quantum Technologies Research Center
First published on 12th March 2021
Abstract
Coupling of molecular emitters to plasmon resonances in metal nanostructures has long been investigated to control the light–matter interaction at the nanoscale. The emergence of different coupling behaviors can be governed by the various combinations of emitters and plasmonic substrates, as well as the spatial arrangement of the individual components. Here colloidal assembly methods are exploited to prepare a responsive nanosystem where two sets of plexcitonic resonances in different coupling regimes can be selectively switched on and off, acting on external conditions such as concentration and presence of anions. The two sets of plexciton resonances are built exploiting the strong coupling between cationic gold nanoparticles and the same molecular moiety, an anionic porphyrin, in different aggregation states. When both plexciton resonances are simultaneously activated in the system, evidence for a plexciton relaxation cascade has been found in photoluminescence experiments. These findings have fundamental implications for achieving control over energy flow at the nanoscale.
Introduction
The ability to control the light–matter interaction at the nanometer scale is one of the major tasks in all the nanophotonics applications.1,2 One of the most exploited configurations to optimize this interaction is the coupling of quantum emitters (QE) with metallic plasmonic nanostructures, acting as nanocavities that localize light and generate enhanced electro-magnetic fields in a very small volume. In this context, the interaction of plasmons and molecular QE is a widely explored topic both as a probe for the optical properties of the material system and as a source of new hybrid states of light and matter, such as polaritons.3,4Besides their importance for fundamental studies of light–matter and many-body interactions at the nanoscale,5 hybrid molecular-plasmon states promise to unlock an unprecedented capability of directing the migration of excitation energy at the nanoscale,6–9 offering exciting prospects in light-harvesting and all-optical circuit architectures and in general for all those photonic applications that require strict control over the flow of energy in time and space.10
In general, the interactions between QEs and plasmonic media can be classified into weak and strong coupling regimes, depending on the relative ratio between the rate of the energy exchange between the two components and the respective dissipation rates.11 When the dissipation rates predominate, the weak coupling regime is obtained. The plasmon and the QE maintain their individual properties, and the optical response of the excited QE can be either enhanced or suppressed (e.g., changing the emission lifetime, the Purcell effect),12 as widely documented in various systems.4,8 On the other hand, when the energy exchange rate overcomes the dissipation rates, the system enters the strong coupling regime and the formation of hybrid polariton states is promoted. These hybrid plasmon–exciton states are often called plexcitons (or excimons).8,9 The formation of hybrid plexcitonic states have been extensively studied for the propagating surface plasmon polaritons (SPPs) of metal surfaces.15–19 More recently, strongly coupled plasmon–exciton states have also been identified for the localized surface plasmon resonance (LSPRs) of nanoparticles in suspension, but here the spectral signatures of coupling are more subtle and the number of examples is very limited.13,20–23
Although strong light–matter coupling with organic molecules has been known for about 20 years, it is only during the last decade that the chemical aspects of the coupling have started to be explored. The realization that the chemical properties of molecules can be changed in a reversible manner by strong coupling to light opened what is now known as polaritonic chemistry.24 However, attention has been so far focused on fundamental investigations on “static” systems, where coupling parameters are tuned by modifying either the plasmonic nanosystem or the organic layer to obtain hybrid states with suitable properties.25,26 On the other hand, “dynamic” systems, where plexcitons are activated and modulated by external stimuli may offer the possibility to realize new plexcitonic devices. Indeed, the first ‘tunable’ plexcitons have been recently described. In these examples, the Rabi splitting between the upper and lower plexciton resonances were tuned by changing the amount of dye molecules, usually cyanines, deposited on the plasmonic nanosystem.19,27
Taking inspiration from these examples, we focused our attention on the possibility of exploiting the supramolecular interactions at play between the two entities forming the plexciton. Such interactions are indeed compelling to achieve the necessary spatial proximity between the plasmonic nanosystem and the QE and determine their mutual arrangements. Moreover, their dynamic nature could allow the controlled activation or de-activation of the coupling conditions necessary for the efficient formation of hybrid plexciton states. Accordingly, we propose here a “responsive” nanosystem in solution, where, depending on controllable external conditions, multiple plexcitonic resonances in different coupling regimes can be selectively activated, and, in turn, different optical properties, including a plexciton relaxation cascade, can be achieved.
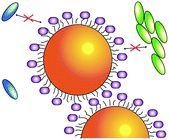
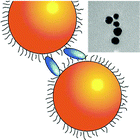
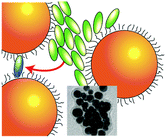
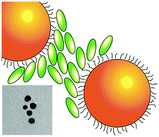
More in detail, in the proposed systems, two sets of hybrid plasmon–exciton resonances are promoted by coupling the same molecular dye in different aggregation forms with the LSPR of a cationic gold nanoparticle (NP). By controlling the supramolecular dye–dye, NP–NP, and dye–NP interactions, it is possible to selectively turn on and off the two sets of resonances and promote configurations where none, only one or two resonances are introduced (Table 1). Interestingly, when they are both present, the two sets of resonances do not act as independent transitions but collectively contribute to the system relaxation.
Results and discussion
Design of the hybrid systems
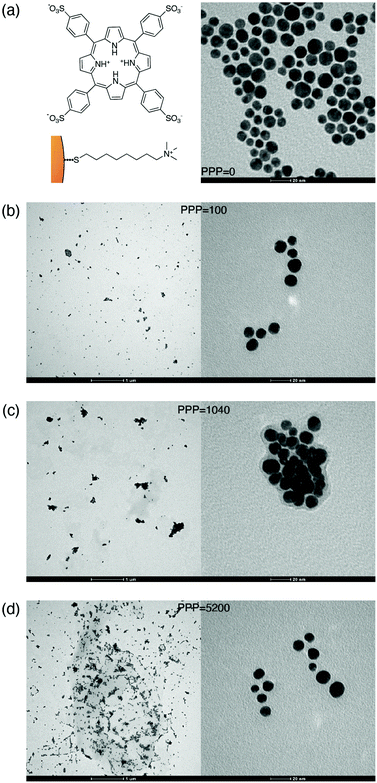
To prepare responsive hybrid systems, we exploited the self-organization of the diprotonated form of the anionic dye 5,10,15,20-tetrakis-4-sulfonato-phenyl porphyrin (H2-TPPS2−) on cationic gold nanoparticles (NPs) (Fig. 1a). Indeed, the ability of this dye to form molecular aggregates with relevant spectroscopic properties in a controlled way is well-known.28–31 At pH values below 3, the porphyrin is doubly protonated at the tetrapyrrolic core and the resulting charge distribution favors the formation of J-aggregates. Effective aggregation requires however also the presence of other concurrent co-factors such as high concentration, high ionic strength, or the presence of polycationic templating agents like polymers or nanoparticles.30,32–39On these bases, we prepared gold nanoparticles (NPs) with an average diameter of 11 ± 2 nm by a modified Turkevich procedure and coated them with 8-trimethylammonium octylthiol (Fig. 1a).40 NPs of this size can both support strong plasmons and give rise to stable suspensions in water. The hybrid nanosystems were then assembled by simply mixing NPs (5–30 μM) and H2-TPPS2− (0.5–4 μM) in water at pH 2.2 (6.3 mM HCl). In these low-concentration conditions and in the absence of NPs, the porphyrin is present mostly as free monomers and the formation of aggregates can only occur by the nanoparticle templating action. We found that the nature of the hybrid formed is mainly controlled by the ratio between H2-TPPS2− and NPs concentration in solution. For this reason, we defined the ‘porphyrins-per-particle’ (PPP) parameter, calculated as the ratio between the nominal concentrations of H2-TPPS2− and NPs in the final solution. Geometrical calculations indicate that depending on the orientation they assume on the particle surface, the number of porphyrin units necessary to coat the whole surface of a nanoparticle with a diameter of 11 nm ranges from about 300 (“parallel” orientation) to 1400 (“perpendicular” orientation).
We explored the supramolecular assembly of NPs and H2-TPPS2− for PPP values going from 0 (only NPs) to 10![[thin space (1/6-em)]](https://www.rsc.org/images/entities/char_2009.gif) 400, comparing the modifications of the extinction spectra of the resulting solutions with respect to those of the bare constituents. In the following, nanohybrids obtained at a specific value of PPP will be labeled as NP-TPPS_PPP. The nanohybrids obtained were characterized by TEM analyses (see ESI†). Fig. 1(b), (c) and (d) report, as an example, the TEM micrographs collected for three nanohybrids samples with PPP = 100, 1040, and 5200.
400, comparing the modifications of the extinction spectra of the resulting solutions with respect to those of the bare constituents. In the following, nanohybrids obtained at a specific value of PPP will be labeled as NP-TPPS_PPP. The nanohybrids obtained were characterized by TEM analyses (see ESI†). Fig. 1(b), (c) and (d) report, as an example, the TEM micrographs collected for three nanohybrids samples with PPP = 100, 1040, and 5200.
Extinction spectra
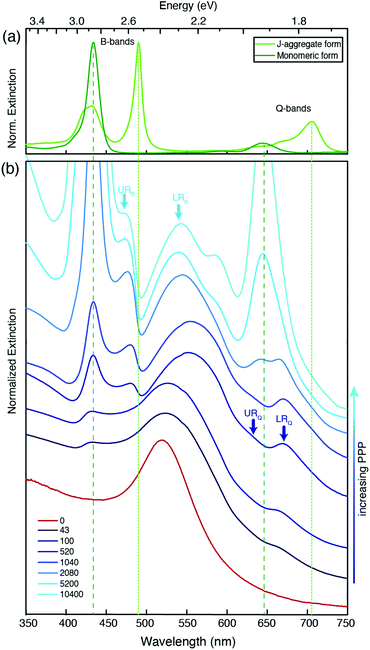
Fig. 2 shows the extinction spectra of nanohybrids (blue) obtained at selected values of PPP. As a term of comparison, the spectrum of the NPs at PPP = 0 (red), and of the monomeric and J-aggregate forms of H2-TPPS2− (green, upper panel) are reported. The extinction spectrum of the NPs is characterized by the typical plasmonic resonance at about 530 nm.41H2-TPPS2− in the monomeric form features two main groups of absorption bands. At higher energies, the so-called B-band at 434 nm can be identified, while at lower energies, the weaker Q-bands are found at 650 and 580 nm. In the J-aggregate, the presence of intermolecular excitonic interactions causes the splitting of each of the monomer bands into a blue-shifted and a red-shifted band.28,29,42,43 This is particularly evident in the B band region where two new excitonic bands appear at 420 and 490 nm. The effect is less pronounced in the Q band region where the excitonic interactions are lower and the presence of a vibronic progression makes the identification of the bands more difficult. The absorption properties of this porphyrin in different aggregation states have been the object of several investigations, and more details can be found for example in ref. 32, 37 and 42. In Fig. 2, green lines (dashed for the monomer, dotted for the aggregate) pinpoint the most intense bands (434 and 650 nm for the monomer, and 490 and 710 nm for the J-aggregate).
It is immediately apparent that the spectra of the hybrid systems do not correspond to the mere sum of the NPs and H2-TPPS2− spectra, and this is the first evidence for the presence of significant interactions between the NPs and the porphyrins at the surface. Clear trends can be identified as a function of the PPP.
At high values of PPP (PPP > 1000), the overall amount of H2-TPPS2− is in large excess and it is high enough to ensure the complete saturation of the NPs surface even in the “perpendicular” configuration. In these conditions, the formation of porphyrin aggregates on the surface of the particles is expected.44,45 The extinction spectra clearly suggest the presence of both free H2-TPPS2− (strong and sharp bands at 434 and 650 nm). In addition, nanoparticle-adsorbed J-aggregates are present. These are revealed by the shoulder at 710 nm and, in particular by a pronounced dip in the B band region in correspondence of the exciton band of the aggregate at 490 nm, accompanied by two side peaks at about 477 and 540 nm (light-blue arrows in Fig. 2).
These bands present the typical anti-crossing behavior expected when plexcitonic resonances are formed upon the mixing of the plasmonic and excitonic resonances. Similar features were also reported for H2-TPPS2− J-aggregates strongly coupled with Al nanodisks46 and nanostructured silver films.47,48 Therefore, these two bands can be attributed to the formation of an upper (UR) and a lower (LR) plexciton resonance, arising from the strong coupling between the 490 nm exciton resonance of H2-TPPS2− J-aggregates and the plasmon resonance of NPs. These plexciton resonances will be denoted from now on as URB/LRB where the B subscript highlights their involvement in the B-bands range. From the energy of these bands it is also possible to estimate the value of the coupling. Indeed, the energies of the upper (E+) and lower (E−) branch plexciton states can be expressed using a coupled harmonic oscillator model as:14
 | (1.a) |
 | (1.b) |
At intermediate values of PPP (PPP ∼ 1000), a significant amount of free H2-TPPS2− is not observed because all the H2-TPPS2− can be accommodated on the particles’ surface available. In the B-band region, the features attributed to the URB/LRB are still identified, although weaker. The band previously detected at 540 nm appears now red-shifted (the maximum at PPP = 1040 is at 560 nm) and wider respect to the analogous band at higher PPP. This behavior can be justified invoking the formation of a more significant amount of NPs’ aggregates,54 as it is also apparent from the comparison of the TEM micrographs of Fig. 1(c) and (d). Moreover, in the Q-bands region, a second dip, although less pronounced, is manifested at about 650 nm, corresponding to the most intense Q band of the monomer. Two adjacent maxima at about 620 and 670 nm could also be identified (blue arrows).
These latter features appear around PPP = 2080 and remain present also at lower values of PPP (PPP < 100), where the signals due to URB/LRB are not visible. At these PPP, indeed, the B-band region is dominated by a weak and broadened signal at about 434 nm corresponding to the B-band of the monomeric H2-TPPS2−, suggesting the presence in the samples of only NP-adsorbed porphyrin monomers. Noteworthy, the band in the 500–550 nm region shifts back to the blue with a maximum of 533 nm and accordingly also the TEM micrographs capture a lower degree of NPs aggregation (Fig. 1(b)).
We attribute the modification of the spectra in the Q bands region to the formation of a second set of resonances, denoted as URQ/LRQ, arising from the coupling between the 650 nm resonance of the monomeric H2-TPPS2− and the red tail of the plasmon resonance of NPs.
The coupling g is calculated to be about 100 meV (eqn (1.a) and (1.b), with an uncertainty of about 20%. This value is lower than in the URB/LRB case and comparable with the decay rates of the system (2g ∼ |γexc + γpl|). The associated ΩR is higher than the molecular linewidth, but it is smaller than the plasmon linewidth, a clear indication of an intermediate coupling regime.13 This suggests that the URQ/LRQ signals, rather than be the expression of a Rabi splitting, represent a Fano-like interference phenomenon, typically established in the regime of intermediate coupling.55–57 In this situation, an induced-transparency dip opens up in the extinction spectrum due to a Fano-like interference between the plasmon and the molecular transition dipole moments.58
There has been a lot of debate on the nature of plexcitons in the intermediate coupling regime.55–57,59,60 To distinguish between the intermediate and the strong coupling regimes, PL measurements have emerged as a valuable tool.55,61,62 Indeed, while in both regimes, the extinction signal has two maxima, PL is an incoherent phenomenon, and thus it cannot display Fano interference. This means that in the intermediate regime, although two peaks are recorded in the extinction spectrum, only one is expected in the PL spectrum, predicted to appear at the minimum of the induced transparency dip.62
As further verification of the establishment of a strong coupling between NPs and H2-TPPS2− in both monomer and aggregate forms, nanohybrids with the same PPP values have been prepared using sulfuric acid (H2SO4) instead of HCl. The doubly negatively charged sulfate anions, present in large excess, inhibit the binding of the porphyrins as a result of effective competition. As expected, the extinction spectra of the obtained nanohybrids, except for a slight red shift of the plasmonic resonance due to NPs aggregation caused by sulfate anions,63 are basically superpositions of the spectra of the non-interacting species (Fig. 3).
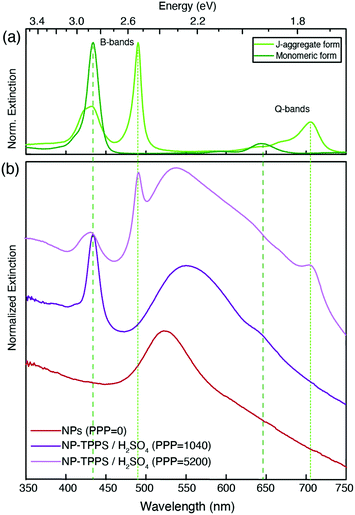 | ||
| Fig. 3 Normalized extinction spectra of (a) H2-TPPS2− in its monomeric (dark green) and J-aggregate (green) form and (b) nanohybrids prepared as the samples in Fig. 2 but replacing HCl with H2SO4. Sulfate ions switch off the plexciton interactions. PPP = 0 (only NPs, red); PPP = 1040 (purple) and PPP = 5200 (pink). In this latter sample, the H2-TPPS2− aggregation was promoted by the addition of Na2SO4 to ease the comparison with the spectra of the non-interacting species (see the Methods section for more details on the preparation of these samples). | ||
PL spectra: evidence for a plexciton relaxation cascade
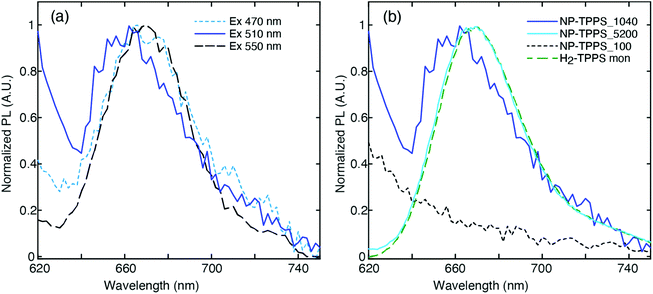
One of the main challenges in the PL measurements on these samples is that their quantum yield (QY) is known to be very low, if any,64 being at least two orders of magnitude less than a standard dye.65 Consequently, the emission of residual traces of unbound molecules of H2-TPPS2− is expected to contribute significantly to the PL spectrum in most cases. To minimize this contribution, the nanohybrid samples were purified by the excess of unbound porphyrin using a series of centrifugation and resuspension cycles. The integrity of the nanohybrids and the reduction of unbound porphyrin molecules were checked by recording the extinction spectrum before and after each centrifugation cycle.In Fig. 4(a) we report the PL spectra measured for the NP-TPPS_1040 sample at different excitation wavelengths. A weak PL signal at 668 nm, typical of the uncoupled H2-TPPS2− monomer,32 is recorded when the excitation wavelength is tuned close to one of the absorption bands of the porphyrin (λexc = 470 and 550 nm). Upon excitation at 510 nm, however, a blue-shifted emission band centered at 655 nm appears. The presence of this band is reproducible across different batches of samples prepared in the same conditions. At 510 nm, the oscillator strength of the non-coupled H2-TPPS2− is very low and therefore its contribution at this exciting wavelength is minimized.
This emission signal has only one maximum at a wavelength located in between the URQ and LRQ resonances. This behavior agrees with recent experimental findings suggesting that the appearance of a single PL signal located at the minimum of the transparency dip is a clear indication of an intermediate (Fano) coupling regime.55 This also supports the initial attribution based on the value of g estimated through the extinction spectrum.
It is also worth noting that this emission in the Q bands region is promoted by excitation at 510 nm, resonant with the LRB band. This immediately suggests that the signal detected at 655 nm can be likely attributed to the PL from the URQ/LRQ resonances, following the relaxation from the initially excited LRB.
As control experiments, we also recorded, at the same excitation wavelength, the PL of solutions of the nanohybrids NP-TPPS_5200 and NP-TPPS_100, where URB/LRB and URQ/LRQ are predominant, respectively (Fig. 4(b)). The inspection of the spectra reveals that no emission is observed in the NP-TPPS_100 sample, suggesting that the URQ/LRQ cannot be directly excited at 510 nm. In contrast, in the NP-TPPS_5200 sample only the emission at 668 nm due to residual uncoupled H2-TPPS2− is detected. Also, no emission is observed for both the samples in the wavelength region between 470 nm and 550 nm, suggesting that the URB/LRB manifolds are not emissive.
We repeated the extinction and PL measurements on the same samples at 77 K (Fig. S5 in ESI†). The extinction spectra at 77 K present the same features already found also at room T, with bands slightly narrower. Also the PL behavior is similar, except that the PL signal at 655 nm is strongly quenched. This implies that the mechanism of population of the emitting state is annihilated at low temperature, suggesting that phonons and coupling with vibrational modes may have a non-negligible role in the relaxation dynamics.66
Two different kinds of tunable plexcitons with the same molecule
While the appearance of the URB/LRB at high PPP is in line with previous findings and falls clearly into a regime of strong coupling, more intriguing is the behavior of URQ/LRQ. The formation of plexcitons with molecular excitations coming from organic molecules in the monomeric form is seldom observed.67–70 Indeed, the transition dipole moments of organic molecules are typically too low to strongly interact with plasmons. This is why J-aggregates, characterized by enhanced oscillator strengths than their monomeric counterparts,43,71 are most often considered. In our specific case, not only the extinction coefficient of the Q band of the monomer is modest, but also its spectral overlap with the NPs plasmon is relatively poor. Consequently, the formation of plexcitonic resonances between monomeric H2-TPPS2− molecules and a single NP seems unlikely.We suggest that the peculiar behavior in the Q bands region could be attributed to the formation of plasmon nanogaps72 where the H2-TPPS2− molecules are trapped between two closely adjacent metal nanostructures. Similar geometries have already been suggested for NPs coupled to quantum dots.55,60,62,73 In this condition, the electro-magnetic field is strongly confined in the inter-particle space. When a molecule or a quantum dot is placed there, its absorption can be strongly enhanced, causing an induced transparency phenomenon and the appearance of the typical Fano dip, like in our case.73 Interactions of plasmons among nanoparticles in close proximity create plasmon coupling modes whose energies are sensitive to the nanogap parameters. In general, the resonant peak of two interacting particles is red-shifted from that of a single particle because of near-field coupling.74,75 In this situation, the resonance condition with the Q band transition is better fulfilled in the red tail of the plasmonic resonance originated by the formation of NPs aggregates, whose plasmon resonance is indeed red shifted.54,76
Experimentally, the hypothesis of nanogaps formation in aggregates of NPs is supported by the TEM micrographs, which indeed capture a higher degree of aggregation exactly for conditions where the URQ/LRQ resonances appear more intense (PPP ∼ 1000, Fig. 1(c)). The same behavior is verified looking at the changes of the plasmonic band in the 500–550 nm region as a function of PPP, which red-shifts and becomes broader concurrently with the appearance of the bands at about 620 and 670 nm, assigned to the formation of URQ/LRQ plexciton resonances. Moreover, the width of the interstitial spaces recorded in the TEM micrographs is compatible with the possibility of the presence of tilted molecules of H2-TPPS2− crosslinking the NPs (Fig. S4†).
All these experimental evidence points toward the reasonable attribution of the URQ/LRQ features to plexciton resonances in the intermediate coupling regime. Nevertheless, it is known that even without the formation of hybrid plexciton states, the plasmon-mediated interaction between the excitations of co-adsorbed molecules can result in modifications of the absorption properties of the molecular moieties, including the appearance of bands’ splitting, shifts, and asymmetric line shapes.77 The first evidence against this argument is that in this case dependence of the spectral modifications on the degree of coverage is typically recognized,77 which is not the case here.
To further corroborate the hypothesis on the nature of the plexcitonic states URB/LRB and URQ/LRQ, Boundary Element Method (BEM) electrostatic calculations have been performed. Different complex dielectric materials embedded in water have been considered to mimic the NP coupling with a porphyrin J-aggregate and to show the possible spectral resonance between aggregates of NPs and the porphyrin monomer.
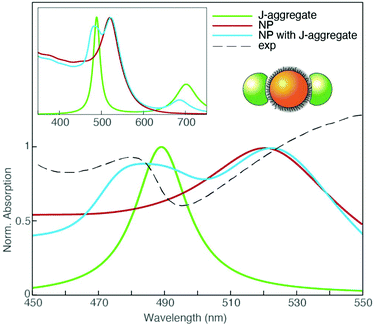
We employed the MNPBEM (v. 7) MATLAB toolbox for all computations.78 We modeled the monomer and J-aggregate dye polarizability as a linear combination of Lorentzian functions representing Q and B bands. Transition energies, bandwidths, and relative strengths for the monomer and J aggregate bands have been retrieved from the experimental absorption spectra and ref. 79 and 80. From the monomer and J-aggregate polarizability, the dielectric functions describing the monomer and J-aggregate as a continuous phase have been calculated through a Clausius–Mossotti relation. We used a concentration of 0.1 nm−3 and 0.625 nm−3 for the monomer and J-aggregate materials, respectively. Gold dielectric function is taken from ref. 81. Since the organic surfactant layer is not optically active in the spectral range of interest, it has been modeled as a continuous layer of polarizable material with a dielectric constant of 2.0. Geometrically, NPs were built up from an 11 nm diameter sphere of gold capped with a 1.2 nm thick layer of surfactant material. To model the coupling with J-aggregates, two promontories were located symmetrically with respect to the NP. Promontory shapes were obtained from a 9.84 nm diameter spheres centered at the NP surface, only the polarization parallel to the promontory axis was considered (see the cartoon inset in Fig. 5). The goal of this setup was to take into account the anisotropic optical response of the porphyrins.
The absorption spectrum obtained in these conditions is shown in Fig. 5 and compared with the experimental extinction spectrum at PPP = 520. The model successfully predicts the formation of plexciton bands in the B-band region, supporting our interpretation of the signals at 477 and 540 nm as upper and lower plexciton branches (URB/LRB).
In the case of NPs interacting with H2-TPPS2− in the monomer form, several arrangements of NPs aggregates and various distances between NPs inner cores have been explored. In particular, it was found that large linear aggregates of NPs can be tuned to be resonant with the monomer Q band and promote the building of an intermediate coupling regime and the formation of the URQ/LRQ resonances (Fig. S6†).
These findings demonstrate that in our systems, one or two sets of plexciton resonances can be selectively activated by controlling the aggregation state of the porphyrin on the particle surface, and the particles aggregation, as summarized in Table 1. This, in turn, is essentially obtained by tuning the relative ratio between particles and dyes in the samples. However, a fundamental contribution is also provided by the multivalent nature of H2-TPPS2− which, thanks to the four peripheral negative charges, can act as nanoparticles crosslinker both in the monomeric and J-aggregate form. When the H2-TPPS2− concentration is low enough, only individual dye molecules are present on the unsaturated particle surface. These conditions promote the aggregation of the particles with nanogaps formation and the sole URQ/LRQ plexciton is observed. It can be speculated that nanoparticles aggregation might induce H2-TPPS2− molecules to take a perpendicular (or anyway tilted) orientation with respect to the particle surface and this in turn reinforce the crosslinking ability of the dye. In the light of this, it is clear that a fine control of the orientation of the porphyrins on the metallic surface may reveal to be a crucial, although challenging, task.
As their concentration increases, porphyrins start to form J-aggregates on the surface of the nanoparticles, and this turns on the URB/LRB plexciton. In the end, the whole particle surface is coated by J-aggregates. This circumstance reduces the aggregation of the nanoparticles, as reported by Dynamic Light Scattering (DLS) measures (Fig. S5†), and increases the interparticle distance (Fig. S4†). In these conditions the sole URB/LRB plexciton is observed, likely because few or no particle-bound monomers are present in the sample. Finally, all the plexcitons can be easily deactivated by adding a species, as the sulfate anions, with a higher affinity for the particle surface.
These nanohybrids represent a substantial step further with respect to the few examples of ‘tunable’ plexcitons reported so far in the literature.19,25–27 Indeed, the degree of external control reached by our systems is not limited to a change in the coupling regime of the same plexciton resonance. Instead, exploiting the higher complexity of the porphyrin dye and its supramolecular interactions with nanoparticles, more than one plexciton resonance can be promoted, and each resonance can be selectively activated or deactivated acting on external conditions such as dye concentration and addition of anions (Table 1).
It should also be noted that the situation achieved at intermediate values of PPP, with the simultaneous presence of two sets of plexciton resonances, is quite different from the so-called ‘double Rabi splitting’,82 or ‘hybrid polaritons’9 where different molecular species are coupled with the plasmonic substrate and undergo optically driven mixing. Here the URB/LRB and URQ/LRQ resonances can be modulated independently, and, most importantly, they are formed starting from the same molecule in different aggregation forms rather than by multiple functionalization. Moreover, the two sets of plexciton resonances are connected by a relaxation phenomenon that promotes the PL emission from URQ/LRQ only upon excitation of LRB, whereas the PL is not activated by direct excitation. The presence of this relaxation channel, to be furtherly characterized, might imply a polaritonic-assisted mechanism, analogously to polariton-assisted energy transfer, recently demonstrated between different species coupled to the same plasmonic structure.9
The activation of a relaxation cascade mechanism among the two plexciton resonances opens exciting perspectives to control the flow of excitation energy for example in light-harvesting applications. From a general point of view, the presence of strong coupling among units involved in energy transport processes is currently recognized as a key design factor to control the mechanisms of energy transfer, through the activation of coherent transport channels.83,84
The presence of coherent channels has already been verified in H2-TPPS2− J-aggregates and the possibility to self-assemble these aggregates within suitably designed nanostructured environments has been already proposed as a viable strategy to control energy and charge transport.85 Indeed, the combination of molecular excitons and plasmons in strongly coupled hybrid systems is particularly attractive because of the very extensive control we have over the plasmon modes supported by metallic nanostructures. Such control derives from an established knowledge between the details of the nanostructure and the associated plasmon mode.5 Here we have demonstrated the feasibility of this approach preparing hybrid nanostructures where indeed a cascade relaxation channel can be activated or deactivated according to externally controlled conditions.
Conclusions
While the complexity of these systems surely calls for further steady-state and time-resolved characterizations, the results reported here demonstrate that it is possible to selectively activate and deactivate multiple plexciton resonances exploiting supramolecular interactions between cationic gold NPs and a polyanionic porphyrin. Tuning the relative ratio between the concentration of NPs and porphyrins, it is possible to prepare nanohybrids promoting the strong coupling between the NPs and the same molecule in different aggregation states. Two different sets of plexcitonic resonances can be prepared either in the B-band region, exploiting the strong coupling with the B-band of J-aggregates (URB/LRB), or in the Q band region (URQ/LRQ), forming plasmonic nanogaps with the monomeric species in the intermediate coupling regime. Differently from other proposed materials, here the presence of multiple plexcitons is not promoted by the sequential functionalization with different species, but using the same molecular species just tuning its aggregation state.In suitable conditions, nanohybrids, where both resonances are present simultaneously, can be prepared. In this situation, preliminary evidence also suggests the two sets of resonances are connected through a cascade relaxation mechanism that activates PL from the URQ/LRQ only upon LRB excitation. The presence of such a relaxation channel, which can be activated or deactivated through the control of external conditions exploiting well-established supramolecular chemistry methodologies, opens up exciting perspectives to control the energy flow in nanostructured systems, for example in light-harvesting and photonics applications.
Methods
The gold nanoparticles have been prepared following a modified Turkevich protocol, as described in ref. 40. The native citrate capping layer has then be replaced with a suitably synthesized 8-trimethylammonium octylthiol to make the NPs’ surface positively charged.40 The TEM analysis (recorded on a Jeol 300 PX electron microscope) revealed an average diameter of 11 ± 2 nm (Fig. 1(a) and Fig. S1†). From these analyses and from the TGA curves (Fig. S2†), we obtained an averaged formula of Au30891(SR)2426 (where SR is the cationic thiol). According to this formula, for convenience, the nanoparticle concentration has been converted into concentration of 8-trimethylammonium octylthiol units grafted on their surface by multiplying by 2426. NMR analysis confirmed the purity of the sample (Fig. S3†). Additional details about the synthesis and characterization of the thiol and the AuNPs are described in ESI.†To prepare the NP-TPPS_PPP samples, suitable volumes of MilliQ water (pH = 2.2, HCl) and of a concentrated NPs solution (5 mM), were added in this order to a 1 mM solution of H2-TPPS2− at pH 3.2. Table 2 reports the exact volumes used to prepare relevant examples of NP-TPPS_PPP samples.
| MilliQ water, μL | AuNPs (5 mM), μL | H2-TPPS2− (1 mM), μL | |
|---|---|---|---|
| NP-TPPS_5200 | 995 | 1 | 4 |
| NP-TPPS_1040 | 998 | 1 | 1 |
| NP-TPPS_100 | 994 | 6 | 0.5 |
The resulting solution was gently shaken to obtain a homogeneous solution and allowed to rest for a night. The final pH is 2.2. The absorption and PL spectra were recorded the day after the synthesis in order to allow the coupling among NPs and H2-TPPS2− to be complete.
For the samples of Fig. 3, MilliQ water (pH = 2.2, H2SO4), a concentrated NPs solution (5 mM) and a 1 mM solution of TPPS (pH = 7) were used. In particular, the samples in Fig. 3b were prepared with the same volumes of NP-TPPS_1040 (purple spectrum) and NP-TPPS_5200 (pink spectrum). In this latter, MilliQ water was 1 M in Na2SO4, in order to promote the aggregation of H2-TPPS2−.
The PL spectra were recorded after three washing steps, each one consists of (i) centrifugation at 10![[thin space (1/6-em)]](https://www.rsc.org/images/entities/char_2009.gif) 000 rpm for 10′, (ii) removal of the supernatant, (iii) addition of MilliQ water at pH = 2.2 and, finally, (iv) sonication for 20′.
000 rpm for 10′, (ii) removal of the supernatant, (iii) addition of MilliQ water at pH = 2.2 and, finally, (iv) sonication for 20′.
Extinction spectra were recorded with a Cary 5000 spectrophotometer, while a Jobyn Yvone FluoroMax 3 was employed for PL measurements. All the PL spectra have been recorded using a KV550 longpass filter (Newport®) before the detector to remove the unwanted contribution of scattered light below 550 nm.
Conflicts of interest
There are no conflicts of interest to declare.Acknowledgements
This research is funded by the ‘CQ-TECH’ STARS Grant 2019 (2019-UNPD0Z9- 0166571) from the University of Padova. GG and SC acknowledge funding from ERC under the grant ERC-CoG-681285 TAME-Plasmons.References
- F. Marquier, C. Sauvan and J.-J. Greffet, ACS Photonics, 2017, 4, 2091–2101 CrossRef CAS.
- J. T. Hugall, A. Singh and N. F. van Hulst, ACS Photonics, 2018, 5, 43–53 CrossRef CAS.
- M. Sukharev and A. Nitzan, J. Phys.: Condens. Matter, 2017, 29, 443003 CrossRef PubMed.
- S. A. Maier, Plasmonics: Fundamentals and Applications, Springer US, New York, 2007 Search PubMed.
- P. Törmä and W. L. Barnes, Rep. Prog. Phys., 2014, 78, 13901 CrossRef PubMed.
- E. Collini, F. Todescato, C. Ferrante, R. Bozio and G. D. Scholes, J. Am. Chem. Soc., 2012, 134, 10061–10070 CrossRef CAS PubMed.
- X. Zhong, T. Chervy, S. Wang, J. George, A. Thomas, J. A. Hutchison, E. Devaux, C. Genet and T. W. Ebbesen, Angew. Chem., Int. Ed., 2016, 55, 6202–6206 CrossRef CAS PubMed.
- T. W. Ebbesen, Acc. Chem. Res., 2016, 49, 2403–2412 CrossRef CAS PubMed.
- D. M. Coles, N. Somaschi, P. Michetti, C. Clark, P. G. Lagoudakis, P. G. Savvidis and D. G. Lidzey, Nat. Mater., 2014, 13, 712–719 CrossRef CAS PubMed.
- M. S. Tame, K. R. McEnery, Ş. K. Özdemir, J. Lee, S. A. Maier and M. S. Kim, Nat. Phys., 2013, 9, 329 Search PubMed.
- B. Kolaric, B. Maes, K. Clays, T. Durt and Y. Caudano, Adv. Quantum Technol., 2018, 1, 1800001 Search PubMed.
- E. M. Purcell, H. C. Torrey and R. V. Pound, Phys. Rev., 1946, 69, 37–38 CrossRef CAS.
- A. P. Manuel, A. Kirkey, N. Mahdi and K. Shankar, J. Mater. Chem. C, 2019, 7, 1821–1853 RSC.
- D. G. Baranov, M. Wersäll, J. Cuadra, T. J. Antosiewicz and T. Shegai, ACS Photonics, 2018, 5, 24–42 CrossRef CAS.
- A. Salomon, C. Genet and T. W. Ebbesen, Angew. Chem., Int. Ed., 2009, 48, 8748–8751 CrossRef CAS PubMed.
- G. P. Wiederrecht, J. E. Hall and A. Bouhelier, Phys. Rev. Lett., 2007, 98, 1–4 CrossRef PubMed.
- D. E. Gómez, S. S. Lo, T. J. Davis and G. V. Hartland, J. Phys. Chem. B, 2013, 117, 4340–4346 CrossRef PubMed.
- N. T. Fofang, N. K. Grady, Z. Fan, A. O. Govorov and N. J. Halas, Nano Lett., 2011, 11, 1556–1560 CrossRef CAS PubMed.
- S. Balci, B. Kucukoz, O. Balci, A. Karatay, C. Kocabas and G. Yaglioglu, ACS Photonics, 2016, 3, 2010–2016 CrossRef CAS.
- A. J. Haes, S. Zou, J. Zhao, G. C. Schatz and R. P. Van Duyne, J. Am. Chem. Soc., 2006, 128, 10905–10914 CrossRef CAS PubMed.
- W. Ni, T. Ambjörnsson, S. P. Apell, H. Chen and J. Wang, Nano Lett., 2010, 10, 77–84 CrossRef CAS PubMed.
- G. L. Liu, Y.-T. Long, Y. Choi, T. Kang and L. P. Lee, Nat. Methods, 2007, 4, 1015–1017 CrossRef CAS PubMed.
- T. Uwada, R. Toyota, H. Masuhara and T. Asahi, J. Phys. Chem. C, 2007, 111, 1549–1552 CrossRef CAS.
- M. Hertzog, M. Wang, J. Mony and K. Börjesson, Chem. Soc. Rev., 2019, 48, 937–961 RSC.
- D. Melnikau, R. Esteban, D. Savateeva, A. Sánchez-Iglesias, M. Grzelczak, M. K. Schmidt, L. M. Liz-Marzán, J. Aizpurua and Y. P. Rakovich, J. Phys. Chem. Lett., 2016, 7, 354–362 CrossRef CAS PubMed.
- G. A. Wurtz, P. R. Evans, W. Hendren, R. Atkinson, W. Dickson, R. J. Pollard, A. V. Zayats, W. Harrison and C. Bower, Nano Lett., 2007, 7, 1297–1303 CrossRef CAS PubMed.
- F. Nan, S. Ding, L. Ma, Z. Cheng, Y. Zhong, Y. Zhang, Y. Qiu, X. Li, L. Zhou and Q. Wang, Nanoscale, 2016, 15071–15078 RSC.
- N. Micali, F. Mallamace, A. Romeo, R. Purrello and L. Monsù Scolaro, J. Phys. Chem. B, 2000, 104, 5897–5904 CrossRef CAS.
- N. C. Maiti, S. Mazumdar and N. Periasamy, J. Phys. Chem. B, 1998, 102, 1528–1538 CrossRef CAS.
- I. G. Occhiuto, R. Zagami, M. Trapani, L. Bolzonello, A. Romeo, M. A. Castriciano, E. Collini and L. Monsù Scolaro, Chem. Commun., 2016, 52, 11520–11523 RSC.
- K. Misawa and T. Kobayashi, J. Chem. Phys., 1999, 110, 5844–5850 CrossRef CAS.
- M. A. Castriciano, A. Romeo, V. Villari, N. Angelini, N. Micali and L. M. Scolaro, J. Phys. Chem. B, 2005, 109, 12086–12092 CrossRef CAS PubMed.
- A. S. R. Koti and N. Periasamy, Chem. Mater., 2003, 15, 369–371 CrossRef CAS.
- E. Collini, C. Ferrante, R. Bozio, A. Lodi and G. Ponterini, J. Mater. Chem., 2006, 16, 1573–1578 RSC.
- L. Bolzonello, F. Fassioli and E. Collini, J. Phys. Chem. Lett., 2016, 7, 4996–5001 CrossRef CAS PubMed.
- A. Romeo, M. A. Castriciano and L. M. Scolaro, J. Porphyrins Phthalocyanines, 2010, 14, 713–721 CrossRef CAS.
- R. Rubires, J. Crusats, Z. El-Hachemi, T. Jaramillo, M. López, E. Valls, J.-A. Farrera and J. M. Ribó, New J. Chem., 1999, 23, 189–198 RSC.
- M. Trapani, G. De Luca, A. Romeo, M. A. Castriciano and L. M. Scolaro, Spectrochim. Acta, Part A, 2017, 173, 343–349 CrossRef CAS PubMed.
- M. Trapani, A. M. Castriciano, A. Romeo, G. De Luca, N. Machado, D. B. Howes, G. Smulevich and M. L. Scolaro, Nanomaterials, 2019, 9, 1026 CrossRef CAS PubMed.
- R. Bonomi, A. Cazzolaro and L. J. Prins, Chem. Commun., 2011, 47, 445–447 RSC.
- G. V. Hartland, Chem. Rev., 2011, 111, 3858–3887 CrossRef CAS PubMed.
- D. L. Akins, in J-aggregates, ed. T. Kobayashi, World Scientific, Singapore, 1996, pp. 67–94 Search PubMed.
- J-aggregates, ed. Y. Kobayashi, World Scientific, Singapore, 1996 Search PubMed.
- M. Trapani, G. De Luca, A. Romeo, M. A. Castriciano and L. M. Scolaro, Spectrochim. Acta, Part A, 2017, 173, 343–349 CrossRef CAS PubMed.
- L. Đorđević, F. Arcudi, A. D'Urso, M. Cacioppo, N. Micali, T. Bürgi, R. Purrello and M. Prato, Nat. Commun., 2018, 9, 3442 CrossRef PubMed.
- J. Li, K. Ueno, H. Uehara, J. Guo, T. Oshikiri and H. Misawa, J. Phys. Chem. Lett., 2016, 7, 2786–2791 CrossRef CAS PubMed.
- A. Salomon, S. Wang, J. A. Hutchison, C. Genet and T. W. Ebbesen, ChemPhysChem, 2013, 14, 1882–1886 CrossRef CAS PubMed.
- A. Salomon, C. Genet and T. W. Ebbesen, Angew. Chem., Int. Ed., 2009, 48, 8748–8751 CrossRef CAS PubMed.
- T. Hümmer, F. J. García-Vidal, L. Martín-Moreno and D. Zueco, Phys. Rev. B: Condens. Matter Mater. Phys., 2013, 87, 115419 CrossRef.
- A. Auffèves, D. Gerace, J.-M. Gérard, M. F. Santos, L. C. Andreani and J.-P. Poizat, Phys. Rev. B: Condens. Matter Mater. Phys., 2010, 81, 245419 CrossRef.
- P. Törmö and W. L. Barnes, Rep. Prog. Phys., 2015, 78, 13901 CrossRef PubMed.
- J. Flick, N. Rivera and P. Narang, Nanophotonics, 2018, 7, 1479–1501 CAS.
- Y. Luo and J. Zhao, Nano Res., 2019, 12, 2164–2171 CrossRef CAS.
- Á. Martínez, Y. Lyu, F. Mancin and P. Scrimin, Nanomaterials, 2019, 9, 622 CrossRef PubMed.
- H. Leng, B. Szychowski, M. C. Daniel and M. Pelton, Nat. Commun., 2018, 9, 4012 CrossRef PubMed.
- M. Pelton, S. D. Storm and H. Leng, Nanoscale, 2019, 11, 14540–14552 RSC.
- N. Murata, R. Hata and H. Ishihara, J. Phys. Chem. C, 2015, 119, 25493–25498 CrossRef CAS.
- X. Wu, S. K. Gray and M. Pelton, Opt. Express, 2010, 18, 23633–23645 CrossRef CAS PubMed.
- J. Sun, H. Hu, D. Zheng, D. Zhang, Q. Deng, S. Zhang and H. Xu, ACS Nano, 2018, 12, 10393–10402 CrossRef CAS PubMed.
- V. Krivenkov, S. Goncharov, I. Nabiev and Y. P. Rakovich, Laser Photonics Rev., 2019, 13, 1800176 CrossRef.
- M. Pelton, S. D. Storm and H. Leng, Nanoscale, 2019, 11, 14540–14552 RSC.
- X. Wu, S. K. Gray and M. Pelton, Opt. Express, 2010, 18, 23633–23645 CrossRef CAS PubMed.
- D. Van Haute, J. M. Longmate and J. M. Berlin, Adv. Mater., 2015, 27, 5158–5164 CrossRef CAS PubMed.
- S. Wang, T. Chervy, J. George, J. A. Hutchison, C. Genet and T. W. Ebbesen, J. Phys. Chem. Lett., 2014, 5, 1433–1439 CrossRef CAS PubMed.
- A. Yoshida and N. Kometani, J. Phys. Chem. C, 2010, 114, 2867–2872 CrossRef CAS.
- H. Wang, H.-Y. Wang, H.-B. Sun, A. Cerea, A. Toma, F. De Angelis, X. Jin, L. Razzari, D. Cojoc, D. Catone, F. Huang and R. Proietti Zaccaria, Adv. Funct. Mater., 2018, 28, 1801761 CrossRef.
- R. Thomas, A. Thomas, S. Pullanchery, L. Joseph, S. M. Somasundaran, R. S. Swathi, S. K. Gray and K. G. Thomas, ACS Nano, 2018, 12, 402–415 CrossRef CAS PubMed.
- R. Chikkaraddy, B. de Nijs, F. Benz, S. J. Barrow, O. A. Scherman, E. Rosta, A. Demetriadou, P. Fox, O. Hess and J. J. Baumberg, Nature, 2016, 535, 127 CrossRef CAS PubMed.
- S. Baieva, O. Hakamaa, G. Groenhof, T. T. Heikkilä and J. J. Toppari, ACS Photonics, 2017, 4, 28–37 CrossRef CAS.
- A. L. Rodarte and A. R. Tao, J. Phys. Chem. C, 2017, 121, 3496–3502 CrossRef CAS.
- F. Würthner, T. E. Kaiser and C. R. Saha-Möller, Angew. Chem., Int. Ed., 2011, 50, 3376–3410 CrossRef PubMed.
- P. Gu, W. Zhang and G. Zhang, Adv. Mater. Interfaces, 2018, 5, 1800648 CrossRef.
- N. Murata, R. Hata and H. Ishihara, J. Phys. Chem. C, 2015, 119, 25493–25498 CrossRef CAS.
- K.-H. Su, Q.-H. Wei, X. Zhang, J. J. Mock, D. R. Smith and S. Schultz, Nano Lett., 2003, 3, 1087–1090 CrossRef CAS.
- N. Jiang, X. Zhuo and J. Wang, Chem. Rev., 2018, 118, 3054–3099 CrossRef CAS PubMed.
- P. Pramod and K. G. Thomas, Adv. Mater., 2008, 20, 4300–4305 CrossRef CAS.
- B. Auguié, B. L. Darby and E. C. Le Ru, Nanoscale, 2019, 11, 12177–12187 RSC.
- U. Hohenester and A. Trügler, Comput. Phys. Commun., 2012, 183, 370–381 CrossRef CAS.
- R. Improta, C. Ferrante, R. Bozio and V. Barone, Phys. Chem. Chem. Phys., 2009, 11, 4664–4673 RSC.
- E. Tokunaga and K. Nakata, in J-Aggregates, Volume 2, ed. T. Kobayashi, World Scientific, Singapore, 2012, pp. 213–246 Search PubMed.
- P. B. Johnson and R. W. Christy, Phys. Rev. B: Solid State, 1972, 6, 4370–4379 CrossRef CAS.
- D. Melnikau, A. A. Govyadinov, A. Sánchez-Iglesias, M. Grzelczak, I. R. Nabiev, L. M. Liz-Marzán and Y. P. Rakovich, J. Phys. Chem. Lett., 2019, 10, 6137–6143 CrossRef CAS PubMed.
- E. Collini, Chem. Soc. Rev., 2013, 42, 4932 RSC.
- J. Cao, R. J. Cogdell, D. F. Coker, H.-G. Duan, J. Hauer, U. Kleinekathöfer, T. L. C. Jansen, T. Mančal, R. J. D. Miller, J. P. Ogilvie, V. I. Prokhorenko, T. Renger, H.-S. Tan, R. Tempelaar, M. Thorwart, E. Thyrhaug, S. Westenhoff and D. Zigmantas, Sci. Adv., 2020, 6, eaaz4888 CrossRef CAS PubMed.
- L. Bolzonello, F. Fassioli and E. Collini, J. Phys. Chem. Lett., 2016, 7, 4996–5001 CrossRef CAS PubMed.
Footnotes |
| † Electronic supplementary information (ESI) availableAdditional details on synthetic procedures and NPs’ characterization (TEM, DLS). Additional extinction and PL spectra, also at 77 K. Additional details on simulation procedures. See DOI: 10.1039/d1nr00775k |
| ‡ present address: Institute of Cybernetics, Mathematics and Physics (ICIMAF), La Habana, Cuba. |
| This journal is © The Royal Society of Chemistry 2021 |

