 Open Access Article
Creative Commons Attribution 3.0 Unported Licence
Untangling the physics of water transport in boron nitride nanotubes†
S.
Mistry
 *a,
R.
Pillai
a,
D.
Mattia
b and
M. K.
Borg
 a
a
aSchool of Engineering, Institute of Multiscale Thermofluids, The University of Edinburgh, Edinburgh EH9 3FB, UK. E-mail: S.Mistry@ed.ac.uk
bDepartment of Chemical Engineering and Centre for Advanced Separations Engineering, University of Bath, Bath BA2 7AY, UK
First published on 7th October 2021
Abstract
Carbon nanotubes (CNTs) have long been heralded as the material of choice for next-generation membranes. Some studies have suggested that boron nitride nanotubes (BNNTs) may offer higher transport of pure water than CNTs, while others conclude otherwise. In this work, we use a combination of simulations and experimental data to uncover the causes of this discrepancy and investigate the flow resistance through BNNT membranes in detail. By dividing the resistance of the nanotube membranes into their contributing components, we study the effects of pore end configuration, membrane length, and BNNT atom partial charges. Most molecular simulation studies of BNNT membranes use short membranes connected to high and low pressure reservoirs. Here we find that flow resistances in these short membranes are dominated by the resistance at the pore ends, which can obscure the understanding of water transport performance through the nanotubes and comparison between different nanotube materials. In contrast, it is the flow resistance inside the nanotubes that dominates microscale-thick laboratory membranes, and end resistances tend to be negligible. Judged by the nanotube flow resistance alone, we therefore find that CNTs are likely to consistently outperform BNNTs. Furthermore, we find a large role played by the choice of partial charges on the BN atoms in the flow resistance measurements in our molecular simulations. This paper highlights a way forward for comparing molecular simulations and experimental results.
1. Introduction
The scarcity of fresh drinking water is currently one of the world's leading causes of malnutrition and other ills.1 With climate change affecting natural water cycles throughout the planet,2,3 desalination technologies are considered to be one of the main ways out of this crisis.4–6 In the last decade, carbon nanotubes (CNTs) and boron nitride nanotubes (BNNTs) were heralded as the materials of choice for fabricating desalination membranes, potentially offering significantly higher permeance than commercial membranes.7–9 Despite early indications showing that BNNTs might outperform CNTs,10,11 research into BNNTs lagged behind, primarily due to difficulties in synthesizing laboratory scale membranes.12 Recently, we synthesized BNNT membranes and showed that they offer advantages of similar selectivity as CNTs but for larger nanotube diameters, which leads to a higher net water permeation.13 Siria et al.14 also find advantages of using BNNTs for energy conversion due to the presence of surface charges inside the nanotubes. The literature on water flows through BNNT membranes, however, appears to contain contradictions, especially when BNNTs are compared to CNTs. Some studies, such as Won et al.,10 Hilder et al.,11 Suk et al.,15 Liang et al.16 and Azamat et al.17 show BNNTs of small nanotube diameters (D ≤ 1 nm) permit higher flux of water compared to CNTs. Other studies, such as Ritos et al.,18 Wei et al.,19 Sam et al.20 and Secchi et al.21 indicate BNNTs conduct lower water flux when compared to CNTs, especially at D > 1 nm.To resolve this discrepancy, we investigated whether: (a) BNNTs indeed offer lower flow resistance compared to CNTs and (b) under what conditions this can occur. We studied the effects of various entry configurations, the role of atomic partial charges, and a range of nanotube diameters (D = 0.81–4.068 nm) which cover the sub-nanometre and nanometre scales. At D > 4 nm, the nanotubes are expected to show a continuum-like behaviour with fixed wall slip, while in the sub-nanometre scale we expected to see the more pronounced effects of confinement.22 The reports of slip lengths, friction coefficients, flow enhancements and volumetric flow rates found in the literature cannot be easily interpolated or compared, as they contain assumptions and use different values for fluid properties, such as density or viscosity, which cannot be defined unambiguously in these confined flows. Therefore, in this work we present our results in terms of resistance to flow that requires no such assumptions of fluid properties, thereby allowing for comparisons between multiple published studies, including experiments.
2. Methods
2.1. Simulation: molecular dynamics
Our simulations were performed using the molecular dynamics (MD) software LAMMPS.23 We studied two different setups, one where we simulated a short membrane of 20 nm thickness, consisting of a reservoir of water on each side and a nanotube embedded within graphene or BN sheets. The absolute pressure in the upstream reservoir was set as 200 MPa, while the downstream reservoir was set as 0.1 MPa. The mass flow rate resulting from this pressure drop was measured to calculate the flow resistances (details in the next section).The second setup was an infinitely long, periodic nanotube. We filled the periodic nanotubes using measurements of number density obtained from our simulations of the corresponding short membranes. Partial charges on the BNNTs were set using the charge equilibration method as implemented within LAMMPS.24 Here we used the default parameters of electronegativity, self-Coulomb potential and the valence orbital exponent found in the REAXFF parametrization given by Han et al.25 This produced charges q = ±0.959e, which we then fixed as constant for all BNNT atoms (except for the cases where the effects of varying partial charges are being studied). The TIP4P/2005 model26 was used to simulate the water molecules at temperature T = 300 K. Further details about the MD simulations are available in the ESI.†
2.2. Theory
For a membrane, the total flow resistance is kt = ΔP/ṁ, which is the ratio of pressure drop ΔP to the mass flow rate ṁ. With no other assumptions of density and viscosity, this formulation helps connect nanoscale simulations to laboratory scale experiments as the pressure drop and mass flow rate are easily available at both these scales. This is in contrast to measurements such as volumetric flow rate Q, or slip length. Calculation of Q would require knowledge of the density inside nanotubes, which is ambiguous especially at high confinements. The slip length, on the other hand, cannot be measured directly inside laboratory scale membranes but must be extrapolated from the flow rates.The total resistance kt can be broken down into two principal components: the end resistance k1 and the nanotube flow resistance k2.27 Note that in general terms, kt = k1 + k2 = k1 + k′2L, where L is the nanotube length and k′2 is the nanotube flow resistance per unit length. We first calculated kt for our short membrane simulations, followed by k′2 from the periodic nanotube simulations, set at the corresponding water density from the short membrane setup. We then calculated the end resistance k1 = kt–k2. The expected value of k1 can be arrived at theoretically using Weissberg's28 equation: k1 = 8μC/ρDh3, where μ is the viscosity, Dh is the hydraulic diameter29,30 and C (∼3.0) is a constant arising from Weissberg's derivation. The nanotube flow resistance is more challenging to predict and cannot be done while ignoring the material properties of the nanotube such as the slip length Ls and the fluid properties under confinement by μ. The Hagen–Poiseuille (HP) equation can be used to arrive at a theoretical nanotube resistance k′2 = 128μ/ρπDh4(1 + 8Ls/Dh). The theoretical values obtained are used only as guides for this study to compare with the actual resistances obtained from our simulations. Flow resistances can be found directly from both simulations and experiments using just the mass flow rate, pressure drop and membrane properties (e.g. pore size distribution, membrane area) and does not require the above theoretical resistance formulations.
3. Results
We first present our MD simulation findings for end-pore and nanotube resistance separately, then the comparison between our simulations and our experiments, and finally discuss the bigger picture of water transport in BNNTs using these results.3.1. End resistance
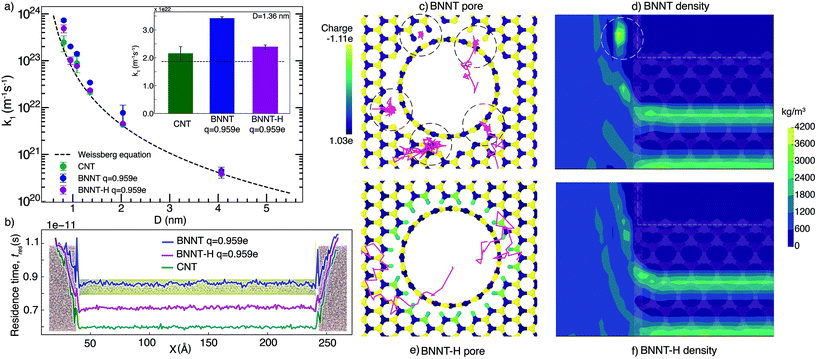
Fig. 1(a) shows the end resistances k1 for BNNTs and CNTs, which largely follow the Weissberg prediction for a laminar flow entering a pipe. Our results show that BNNTs with high partial charges q = ±0.959e at the pore entrance/exit may lead to higher end resistances, which occur because of high irregularities in the electric field. To demonstrate this, we consider two BNNT membrane cases, one which includes hydrogenation at the membrane pore ends (BNNT-H) and another that does not (BNNT), while keeping the same partial charge on the BN atoms of the nanotube. Measurement of molecular residence times tres (see the ESI† for details) is used to identify where molecules are spending their time during a single trip from the left (upstream) to right (downstream) reservoirs. A higher local tres translates to a larger local resistance. Fig. 1(b) shows the source of the entrance loss in the form of a spike in tres at the entrance and exit regions. A drop in the residence time in the central region of the nanotube is also an indication of a drop in the overall flow resistance of the membrane. A pronounced decrease in the end resistance is seen in Fig. 1(a) for all diameters when the BNNT membrane pores are functionalized.We further analysed the trajectory of a few water molecules at the entrance and plotted the density profile of water near the entrance. Fig. 1(c) shows that, in the case of the non-functionalized pore, some water molecules were spending more time at the entrance of the pore—seemingly trapped at the discontinuity between the membrane surface and the nanotube. This appears as a local region of high concentration on the plot of density in Fig. 1(d). A comparison of the trajectories and density profiles between BNNTs with and without hydrogenation shows no such phenomenon (see Fig. 1(e) and (f)). The cause of the resistance in the non-hydrogenated cases are indicative of trapped water molecules reducing the transport of other flowing water molecules, which is more dominant at the smaller nanotube diameters considered.
In reality, the pore configuration depends on the method of synthesis. In our experiments,13 where the nanotubes are synthesised using chemical vapour deposition, the membrane edge folds into the nanotube in one continuous sheet, with some defects arising at the pore. These defects would likely bind to functional groups or other nearby atoms to smoothen the electric field at the pore ends, but this smoothening needs to be done explicitly in MD. Another reason for the strong electric fields at the pore edges could be edge termination with ionic groups, similar to the structure studied by Zhang et al.31 The incongruity of the membrane surface and the nanotube is typically overcome in simulations by using a flat, 2-D layer to construct the surface and model the pore as a hole cut into this surface, aligned with a nanotube. This, in turn is akin to modelling a defective entrance in terms of both structure and the local electric field. We have studied alternate configurations of the entrance and presented the results in the ESI.† While studies of hydrogenation of the CNT and its edges have shown a decrease in flow rate (and the corresponding increase in resistance),32,33 a decrease in end resistance (and therefore increase in flow rate) is seen here in the case of hydrogenation of BNNTs. This occurs because hydrogenation reduces the irregularity of the electric field at the pore entrance/exit regions caused due to the partial charge of the BN atoms.
3.2. Nanotube flow resistance
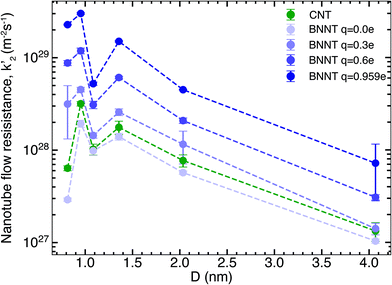
We next studied the effect of partial charges on the nanotube flow resistance k′2, as shown by our results in Fig. 2. As indicated by Wei et al.19 for carbon nanotubes and Govindrajan et al.34 for 2D hexagonal boron nitride (hBN) sheets, electrostatic interactions tend to increase the friction offered by the membrane surface to the flow of water, which has been ascribed to changes in the structure of water and deepening of potential energy wells on the nanotube surface (see the ESI†). These effects make it more difficult for water molecules to travel over the surface. Here, we studied the effect of changing the partial charges from 0 to ±0.959e on the flow resistance inside long, periodic BNNTs. This was intended to be a theoretical exercise to distinguish the contribution of electrostatic and van der Waals forces to the flow resistance and to capture any crossover of flow resistance between BNNTs and CNTs that might arise inside the nanotube due to the partial charges. For each value of the partial charge used, we also performed droplet simulations to establish the contact angle. The magnitude of partial charge within the range of 0 to ±0.959e did not have any effect on the contact angle, which remained close to the experimental value of 78° (ref. 13) (droplet simulations are presented in the ESI†). The solid/liquid intermolecular potentials were therefore unchanged. Fig. 2 shows that there is a large reduction of nanotube flow resistance k′2 accompanying the reduction in partial charges from ±0.959e to 0. For the smallest diameters which we studied, a change in partial charges from ±0.959e to 0 also resulted in a change in resistance of two orders of magnitude. This shows that not only does the partial charge play a severe role in the nanotube flow resistance but this role is especially pronounced for smaller diameters, which are required for applications such as molecular sieving and desalination. Furthermore, when the BNNT charges are close to zero, the BNNT flow resistance is seen to fall below that of the CNT. We discuss the implications of these observations when we discuss the bigger picture in later sections. The increasing monotonic trend is disrupted by a sudden drop in k′2 at a diameter of 1.08 nm when compared to both higher and lower diameters. This non-monotonic behaviour (recognised by the W-shape in k′2 at small D) likely arises due to changes in the hydrogen bond network and reordering of the structure of water due to confinement and has been widely reported for CNTs.22,29,35 Here we note that the same W-shape is maintained no matter whether it is a CNT or a BNNT with any partial charge, which tells us that it is the confinement effects of water and not the nanotube material that is responsible for this non-monotonic behaviour.3.3. Experimental comparisons
In this section, we compare the flow resistances between MD and our recent water transport experiments in CNT36 and BNNT13 membranes. All the BNNT membranes studied had a thickness of 50 μm. Since CNT membranes36 used in the experiments were of different thicknesses, they have all been scaled to L = 50 μm by multiplying their measured resistance with the ratio L/Li, where Li is the measured thickness of an arbitrary membrane. As we reveal later, this scaling is acceptable because the experiments have negligible end losses. Fig. 3 shows the resistance for BNNTs appears to be generally higher than that for CNTs. The experimental resistance for BNNTs lies on the line predicted by the HP equation for zero slip, indicating the BNNT membranes are showing near zero slip.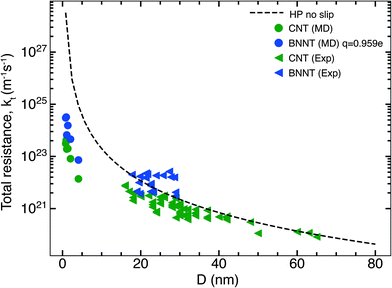 | ||
| Fig. 3 Variation of total resistance kt for one nanotube with diameter compared between our MD and experiments. Data from the experimental membranes have been scaled to reflect the resistance of a single nanotube.13,36 Comparisons are made with MD simulations of the smallest diameters and the no slip HP equation. All membranes considered have been scaled to 50 μm. Entrance/exit resistances k1 are negligible. | ||
The high resistance of the experimental membranes might be attributed to the presence of defects in the nanotubes as reported by Nicholls et al.37 Predictions of the resistance for a membrane of similar thickness as the experiments, using k1 and k′2 obtained from our simulations, gives a similar picture for smaller diameters than the experiments. The BNNT (q = ±0.959e) resistance is seen to be higher than that of CNTs, albeit with substantially lower resistance than the HP prediction due to the curvature effects from pristine nanotubes at low diameters as noted by Falk et al.38 for CNTs.
3.4. Understanding the literature
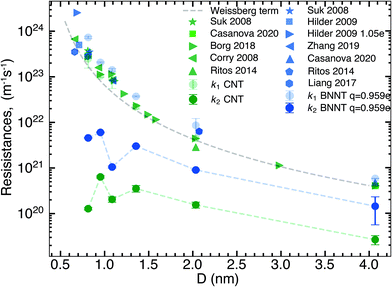
We have plotted the end resistance k1 obtained from our short membrane simulations alongside those obtained from the literature in Fig. 4. Not only do our end resistances line up very well with the values from the literature but all results also follow the Weissberg prediction. Due to the computational cost of MD, most of the simulation studies of membranes in the literature have thicknesses smaller than 20 nm and this has an implication in interpreting the results. Plotted in Fig. 4 is also the nanotube flow resistance, k2, scaled for 20 nm long membranes that contain no end losses. By doing this, we show thatk2 for BNNTs is consistently an order of magnitude higher than CNTs, but both CNT and BNNT nanotube flow resistances are negligible compared to the end resistance for these short membranes. Most MD simulations that compare short nanotube membranes of different materials are in essence capturing and comparing differences between two types of flow physics: (a) the resistance due to the characteristics of the pore entrance (k1) and (b) resistance due to the characteristics of the flow inside the nanotube (k2). Since k2 is orders of magnitude smaller than k1 for nanotubes shorter than 20 nm, the nanotube transport performance cannot be inferred from the total resistance kt (and therefore, from measures such as the flow rate or slip length) as kt ≅ k1 in these short membrane simulations. Changes to the end resistance can be dependent on partial charges, van der Waals interactions, functional groups and pore geometry but not all of these factors affect the nanotube flow resistance. This is why we need to untangle the physics of end and nanotube flow resistances when looking at nanotube membranes, in particular BNNTs in which charges play a role in both the flow through the ends and slip flow inside the nanotube.At this point, using the data of sections 3.1 and 3.2, we can answer the question that arose from the discrepancy in literature, namely: why have BNNTs sometimes been shown to outperform CNTs, especially at smaller diameters? We see in Fig. 1(a) that BNNT-H has similar k1 to CNTs. While there is a small difference at some of the nanotube diameters we have studied where BNNTs have lower end resistance, this difference is much less than the noise, and k1 can therefore be roughly considered to be equal for BNNT-H and CNTs. Regarding the nanotube flow resistance k′2, a crossover is seen in Fig. 2 when changing the partial charge.
Partial charges on BN atoms play a profound role in determining what the predicted flow rate will be. As we see from Fig. 2, the flow resistance is particularly sensitive to the value of partial charges chosen for B and N atoms for small D, where a majority of the discrepancies in the literature lie. There is a possibility that, if there is no partial charge, BNNTs can offer lower resistance than CNTs at any D, probably due to the differences in the van der Waals forces. However, there cannot be zero partial charges on B and N atoms due to the nature of the covalent bond between them which forms a dipole. Our experimental evidence in this work for BNNTs13 and CNTs36 suggests that the nanotube flow resistance for BNNTs is higher than CNTs, as can be seen in Fig. 3. This not only reveals the presence of partial charges but also indicates they may be on the higher side of the range between ±0.3e–±1.05e.
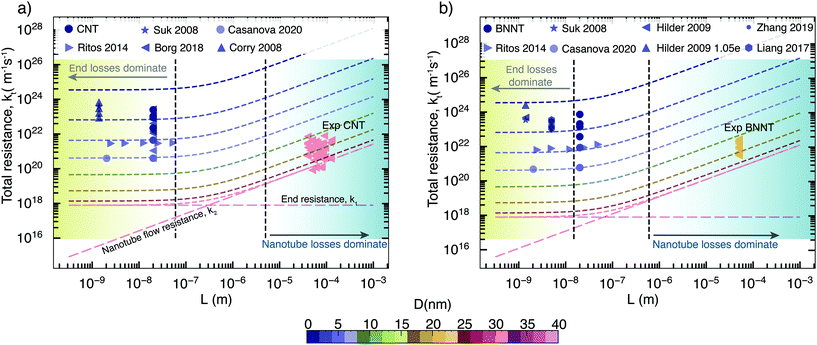
Taking the above components of end and flow resistance together, we can build a realistic picture of total resistance for practical membranes, which have nanotubes longer than a micrometre. As we can see from Fig. 5 at micrometre length, it is the nanotube flow resistance that dominates over the entrance resistance. Prediction of flow through experimental membranes from short membrane MD simulations should, therefore, give more weightage to the nanotube flow resistance, which can be predicted from long, periodic nanotubes. In MD/experimental comparison studies, membrane-style MD simulations can only be used to provide the correct density inside the tubes that is required to prime the periodic nanotube simulations, as looking at their flow response may be misleading, especially when the pore–entrance physics changes. Simulations of the full membrane, with entrance and exit effects, should only be considered when the experimental membranes are similarly shorter, which also depends on the slip length of the nanotube considered; however, such nanoscale-thick experimental nanotube membranes do not yet exist. Therefore, the experimental relevance of full membrane simulation studies is not yet important. The selective layer in commercial RO polymer membranes is of the order of 100 nm, while experimental nanotube membranes have thicknesses in the order of micrometers due to handling and fragility issues. For CNTs, the transition to resistance being dominated by nanotube flow resistance k2 happens when the membrane length is around 500 nm (Fig. 5a), while for BNNTs, it is about 100 nm as they have a slightly lower slip (Fig. 5b). This is comparable to the CNT membrane length of 300 nm reported in the MD simulations of Walther et al.30 beyond which end resistance stops playing a significant role. Therefore, assuming that BNNTs have high partial charges, we can say that it is unlikely that BNNTs would have lower resistance than CNTs, even at smaller diameters. The low resistance of BNNTs appears only under certain conditions, such as when there are more favourable interactions between water and the functional groups at the ends of the membrane. However, this is not enough to cause impact at the scale of experimental membranes, where end losses are negligible on the transport.
4. Conclusions
BNNT membranes have recently been shown to have an added advantage over CNTs when it comes to the rejection of negatively charged particles from water. However, for pure water flows, the comparison of CNTs with BNNTs was not fully understood, with some studies showing BNNTs to outperform CNTs and others concluding otherwise. In this study, we showed that the disagreements in the literature for pure water flows might have arisen due to the short membranes considered, for which the total resistance is dominated by end resistance. This masks the much lower flow resistances inside nanotubes, which dominates in the laboratory scale membranes and is lower for CNTs when compared to BNNTs. The most important factor that governs end resistance in simulations was found to be the nature of the nanotube–membrane surface interface and the discontinuities in the partial charge landscape particularly increased the end resistance. For the nanotube flow resistance, electrostatic interactions were shown to play a large role for BNNTs, and the uncertainty of the partial charges to be used affects the quality of predictions from MD simulations. Further work needs to be done to more accurately define the partial charges for these small diameters to better predict the flow properties of membranes with partial atomic charges such as BNNTs. This work also presents a unifying method to test these transport problems, whether it is for MD simulations or to compare with the experiments.Conflicts of interest
There are no conflicts to declare.Acknowledgements
This research is supported by the Engineering and Physical Sciences Research Council (EPSRC), UK under grants EP/N016602/1, EP/R007438/1 and EP/V012002/1. SM thanks the Commonwealth Scholarship for their support. The authors thank Dr Saikat Datta of the University of Edinburgh for discussions on measuring molecular residence time. All MD simulations were run on ARCHER and ARCHER2, the UK's National Supercomputing Service, funded by an EPSRC/ARCHER2 Pioneer Project.References
- M. V. Fanucchi, International Encyclopedia of Public Health, 2016, pp. 350–360 Search PubMed.
- S. N. Gosling and N. W. Arnell, Clim. Change, 2016, 134, 371–385 CrossRef.
- J. Schewe, J. Heinke, D. Gerten, I. Haddeland, N. W. Arnell, D. B. Clark, R. Dankers, S. Eisner, B. M. Fekete, F. J. Colón-González, S. N. Gosling, H. Kim, X. Liu, Y. Masaki, F. T. Portmann, Y. Satoh, T. Stacke, Q. Tang, Y. Wada, D. Wisser, T. Albrecht, K. Frieler, F. Piontek, L. Warszawski and P. Kabat, Proc. Natl. Acad. Sci. U. S. A., 2014, 111, 3245–3250 CrossRef CAS PubMed.
- H. March, D. Saurí and A. M. Rico-Amorós, J. Hydrol., 2014, 519, 2642–2651 CrossRef.
- C. Fritzmann, J. Löwenberg, T. Wintgens and T. Melin, Desalination, 2007, 216, 1–76 CrossRef CAS.
- M. A. Shannon, P. W. Bohn, M. Elimelech, J. G. Georgiadis, B. J. Marĩas and A. M. Mayes, Nature, 2008, 452, 301–310 CrossRef CAS PubMed.
- J. K. Holt, H. G. Park, Y. Wang, M. Stadermann, A. B. Artyukhin, C. P. Grigoropoulos, A. Noy and O. Bakajin, Science, 2006, 312, 1034–1037 CrossRef CAS PubMed.
- B. Corry, J. Phys. Chem. B, 2008, 112, 1427–1434 CrossRef CAS PubMed.
- C. Y. Won and N. R. Aluru, J. Phys. Chem. C, 2008, 112, 1812–1818 CrossRef CAS.
- C. Y. Won and N. R. Aluru, J. Am. Chem. Soc., 2007, 129, 2748–2749 CrossRef CAS PubMed.
- T. A. Hilder, D. Gordon and S. H. Chung, Small, 2009, 5, 2183–2190 CrossRef CAS PubMed.
- D. Golberg, Y. Bando, Y. Huang, T. Terao, M. Mitome, C. Tang and C. Zhi, ACS Nano, 2010, 4, 2979–2993 CrossRef CAS PubMed.
- S. Casanova, S. Mistry, S. Mazinani, M. K. Borg, Y. M. Chew and D. Mattia, Nanoscale, 2020, 12, 21138–21145 RSC.
- A. Siria, P. Poncharal, A. L. Biance, R. Fulcrand, X. Blase, S. T. Purcell and L. Bocquet, Nature, 2013, 494, 455–458 CrossRef CAS PubMed.
- M. E. Suk, A. V. Raghunathan and N. R. Aluru, Appl. Phys. Lett., 2008, 92, 133120 CrossRef.
- L. Liang, J. C. Li, L. Zhang, Z. Zhang, J. W. Shen, L. Li and J. Wu, Phys. Chem. Chem. Phys., 2017, 19, 30031–30038 RSC.
- J. Azamat, A. Khataee and S. W. Joo, J. Mol. Model., 2016, 22, 1–8 CrossRef CAS PubMed.
- K. Ritos, D. Mattia, F. Calabrò and J. M. Reese, J. Chem. Phys., 2014, 140, 014702 CrossRef PubMed.
- X. Wei and T. Luo, J. Phys. Chem. C, 2018, 122, 5131–5140 CrossRef CAS.
- A. Sam, R. Hartkamp, S. K. Kannam and S. P. Sathian, Nanotechnology, 2018, 29, 485404 CrossRef PubMed.
- E. Secchi, S. Marbach, A. Niguès, D. Stein, A. Siria and L. Bocquet, Nature, 2016, 537, 210–213 CrossRef CAS PubMed.
- J. A. Thomas and A. J. McGaughey, Phys. Rev. Lett., 2009, 102, 184502 CrossRef PubMed.
- S. Plimpton, J. Comput. Phys., 1995, 117, 1–19 CrossRef CAS.
- H. M. Aktulga, J. C. Fogarty, S. A. Pandit and A. Y. Grama, Parallel Comput., 2012, 38, 245–259 CrossRef.
- S. S. Han, J. K. Kang, H. M. Lee, A. C. Van Duin and W. A. Goddard, J. Chem. Phys., 2005, 123, 114703 CrossRef PubMed.
- J. L. Abascal and C. Vega, J. Chem. Phys., 2005, 123, 234505 CrossRef CAS PubMed.
- M. E. Suk and N. R. Aluru, Nanoscale Microscale Thermophys. Eng., 2017, 21, 247–262 CrossRef CAS.
- H. L. Weissberg, Phys. Fluids, 1962, 5, 1033–1036 CrossRef.
- M. K. Borg, D. A. Lockerby, K. Ritos and J. M. Reese, J. Membr. Sci., 2018, 567, 115–126 CrossRef CAS.
- J. H. Walther, K. Ritos, E. R. Cruz-Chu, C. M. Megaridis and P. Koumoutsakos, Nano Lett., 2013, 13, 1910–1914 CrossRef CAS PubMed.
- L. Zhang, L. Jia, J. Zhang, J. Li, L. Liang, Z. Kong, J. W. Shen, X. Wang, W. Zhang and H. Wang, Desalination, 2019, 464, 84–93 CrossRef CAS.
- Z. Song and Z. Xu, Sci. Rep., 2015, 5, 1–9 CrossRef.
- E. M. Kotsalis, J. H. Walther and P. Koumoutsakos, Int. J. Multiphase Flow, 2004, 30, 995–1010 CrossRef CAS.
- A. Govind Rajan, M. S. Strano and D. Blankschtein, Nano Lett., 2019, 19, 1539–1551 CrossRef CAS PubMed.
- X. Qin, Q. Yuan, Y. Zhao, S. Xie and Z. Liu, Nano Lett., 2011, 11, 2173–2177 CrossRef CAS PubMed.
- D. Mattia, H. Leese and K. P. Lee, J. Membr. Sci., 2015, 475, 266–272 CrossRef CAS.
- W. D. Nicholls, M. K. Borg, D. A. Lockerby and J. M. Reese, Mol. Simul., 2012, 38, 781–785 CrossRef CAS.
- K. Falk, F. Sedlmeier, L. Joly, R. R. Netz and L. Bocquet, Nano Lett., 2010, 10, 4067–4073 CrossRef CAS PubMed.
Footnote |
| † Electronic supplementary information (ESI) available. See DOI: 10.1039/d1nr04794a. Sample LAMMPS input scripts and data files are available. See DOI: 10.7488/ds/3150 |
| This journal is © The Royal Society of Chemistry 2021 |

