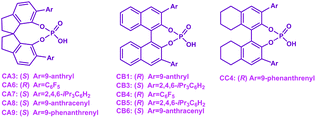
Chiral phosphoric acid catalyzed atroposelective C–H amination of arenes: mechanisms, origin and influencing factors of enantioselectivity†
Ka
Lu
a,
Peng-Yu
Liang
a,
Chao-Xian
Yan
a,
Fang-Ling
Yang
a,
Xing
Yang
a,
Wei
Dou
a,
Qinwei
Yu
b,
Jianming
Yang
b and
Pan-Pan
Zhou
 *a
*a
aState Key Laboratory of Applied Organic Chemistry, Key Laboratory of Special Function Materials and Structure Design of Ministry of Education, Advanced Catalysis Center, College of Chemistry and Chemical Engineering, Lanzhou University, 222 South Tianshui Road, 730000, Lanzhou, P. R. China. E-mail: zhoupp@lzu.edu.cn; Fax: +86-931-8912582; Tel: +86 931 8912862
bState Key Laboratory of Fluorine & Nitrogen Chemicals, Xi'an Modern Chemistry Research Institute, Xi'an, 710065, P. R. China
First published on 3rd November 2020
Abstract
The amination reaction between azonaphthalene and carbazole to achieve the C–H amination of an arene can be effectively accomplished by the usage of a chiral phosphoric acid catalyst, which can generate the important N-arylcarbazole framework compound with high yield and excellent enantioselectivity. To figure out the reaction mechanism, origin and influencing factors of enantioselectivity, quantum mechanical calculations were carried out. The results indicate that two pathways lead to the experimental desired major product while other two pathways lead to the enantiomeric minor product. The theoretical ee value is 90% which is in agreement with the experimental 96% ee value. Quantum theory of atoms in molecules was employed to illustrate the roles of weak intermolecular interactions in the reaction process. A detailed analysis of the types of chiral phosphoric acids was performed to elaborate on what factors affect the enantioselectivity and how they cause the effect, and a statistical analysis of the performances of different types of chiral phosphoric acids in the C–N and C–C bond formation reactions was conducted. It is expected that the present work would be insightful for understanding the chiral phosphoric acid catalyzed C–N cross-coupling reaction and thus can guide the selection of chiral phosphoric acids for the asymmetry reaction.
1. Introduction
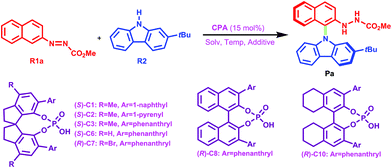
Organic molecules containing N-arylcarbazole skeletons are prevalently found in natural products1,2 which exhibit significant biological activities and organic light-emitting diodes (OLEDs)3–15 as well as dye-sensitized solar cells (DSSCs)16–20 which possess unique electronic properties. Consequently, many efforts have been devoted to exploring these structurally novel molecules in the past decades. Conventionally, transition-metal catalysis has been a powerful method to promote C–N bond formation in the carbazole N-arylation reaction.21–23 For instance, Wu et al. applied the carbazole N-arylation reaction catalyzed by Pd to synthesize a novel bipolar material which can be used for the enhancement of electrophosphorescence.14 Chu and co-workers reported that Pd(II)-catalyzed one-pot syntheses of 9-(pyridin-2-yl)-9H-carbazoles can be achieved through a tandem C–H activation and C–N cross-coupling process.24 Hung et al. suggested that biscarbazoles can be obtained through Pd-catalyzed inter- and intramolecular coupling reactions of anilines.22,25 Fu et al. employed a Cu(I)–carbazolide complex to accomplish a photoinduced Ullmann-type coupling which led to N-arylcarbazole compounds.23,26 But it is noted that the efficiency of the aforementioned reactions is affected due to the necessary prefunctionalization of the arene substrate and the resultant waste production.27In recent years, organocatalysis28–34 has been rapidly developed and has become a very promising field in organic synthesis, especially for the reactions catalyzed by chiral phosphoric acids (CPAs) through hydrogen-bonding (HB) interactions.33–35 Organocatalytic C–H arylation of arenes with CPAs has been successively accomplished by Tan et al.36,37 in which the C nucleophile has been applied in the aromatic nucleophilic substitution. Inspired by this intriguing work, a more interesting and challenging idea was proposed by Tan's group, that is, how to use the N nucleophile to realize C–H amination of arenes to synthesize N-arylcarbazole frameworks in an organocatalytic way? Excitingly, for the first time, an efficient organocatalytic strategy has been elegantly developed by Tan and coworkers,27 and they utilized a CPA (i.e., the catalyst (S)-C6) to catalyze the C–H amination of an azonaphthalene derivative with 2-tert-butyl-9H-carbazole via C–N cross-coupling and obtained the N-arylcarbazole compound in good yield with excellent enantiocontrol, as shown in Scheme 1. The reactants azonaphthalene derivative and 2-tert-butyl-9H-carbazole are denoted as R1 and R2, respectively. It can be seen that the axially chiral N-arylcarbazole product (denoted as P) with a high yield of 96% and an excellent enantioselectivity of 96% ee is achieved. The proton-donating and accepting abilities of the CPA enable it to act as an efficient bifunctional catalyst.38,39 Thereby, the dual HB activation mode38,40–45 can be expected to be applicable to the reaction system in Scheme 1 in which both R1 and R2 would simultaneously interact with (S)-C6 through HBs and thus would be activated. This significant success in organocatalytic C–C and C–N cross-couplings achieved with CPAs greatly stimulates our interest, because the C–C cross-coupling reaction between an azobenzene derivative and indole has been theoretically investigated by us recently;46 thus in the present work we aim at figuring out the reaction mechanism, origin of enantioselectivity and role of the catalyst in the C–N cross-coupling reaction between 2-tert-butyl-9H-carbazole and the azonaphthalene derivative catalyzed by (S)-C6, and meanwhile, a comparison of organocatalytic C–C and C–N cross-couplings achieved by the CPA will be made to explore and elucidate their similarity and difference. It is expected that the results would be insightful for the organocatalytic C–C and C–N cross-couplings.
 | ||
| Scheme 1 (S)-C6 catalyzed C–H amination reaction of an azonaphthalene derivative with 2-tert-butyl-9H-carbazole via C–N cross-coupling. | ||
2. Computational details
All the reactants, catalyst, complexes, transition states, intermediates and products were fully optimized at the M06-2X47/6-31G(d,p) level of theory using the Gaussian 09 software package.48 The vibrational frequency calculation was also carried out at this level and the temperature was set to 323 K in terms of the experimental temperature. The solvation effect of CHCl3 was taken into account by using the SMD continuum solvation model.49 There are no imaginary frequencies for the optimized reactants, intermediates and products, while only one imaginary frequency was found for each transition state which was also evaluated by intrinsic reaction coordinate (IRC)50,51 calculations at the M06-2X/6-31G(d,p) level of theory. Single point calculations were performed at the M06-2X/Def2-TZVP level of theory for each optimized structure to gain more accurate energy because the basis set superposition error (BSSE) is less sensitive to the TZVP basis.52 The GaussView (Version 5)53 and CYLview (version 1.0b)54 software packages were employed to present the optimized structures.Based on the optimized structures of the reactants, the global and local reactivity indexes within the framework of conceptual density functional theory (CDFT)55,56 were applied in assessing the reactivity tendency and the reactive sites. The electronic chemical potential (μ) and chemical hardness (η) can be calculated based on the energies of the highest occupied molecular orbital (EHOMO) and the lowest unoccupied molecular orbital (ELUMO) using the equations μ = (EHOMO + ELUMO)/2 and η = ELUMO − EHOMO. The global electrophilicity index (ω) can be calculated in terms of μ and η using ω = (μ2/2η). The global nucleophilicity index (N) can be calculated according to the definition by Domingo and coworkers,57–60 which can be defined as the HOMO energy difference between the reactant (R) and tetracyanoethylene (TCE): N = EHOMO(R) − EHOMO(TCE). The molecule tetracyanoethylene (TCE) has the lowest EHOMO compared to a large series of molecules,61 so it is taken as a reference. Herein, the HOMO energies are obtained within the Kohn–Sham scheme.62 Additionally, to evaluate the reactivity of an atom k in each reactant, the local reactivity indexes like the condensed-to-atom versions of the Fukui functions56,63–67 were employed:
Herein, qk is the electronic charge of an atom k and N is the number of electrons. When the value of fk+ is positive and large, it means that atom k in a molecule is susceptible to nucleophilic attack (electron-accepting). But when the value of fk− is positive and large, it indicates that atom k in a molecule is susceptible to electrophilic attack (electron-donating). The negative Fukui function will not be taken into account because it is usually obtained from the inability of a molecule to accommodate orbital relaxation due to a change in the number of electrons and/or improper charge partitioning techniques68–70 or distorted molecular structures.67,71–73
The powerful theoretical tools including quantum theory of atoms in molecules (QTAIM)74–76 analyses were utilized to illustrate the roles of intermolecular interactions formed in the complexes, transition states and intermediates. QTAIM analyses can be used to reveal the topological properties at the bond critical points (BCPs) of HB, van der Waals, and π–π interactions.61,77–85 Natural bond orbital (NBO)86,87 analyses were used to obtain the natural atomic charge. The plots were obtained using Multiwfn (Version 3.588) software.
3. Results and discussion
3.1 Evaluating the reactivity of the reactants R1 and R2
For the (S)-C6-catalyzed amination reaction displayed in Scheme 1, it is evident that the bonding reaction occurs between the C1 atom of R1 and N3 atom of R2, which finally leads to the axially chiral N-arylcarbazole product P. To understand the electrophilic and nucleophilic reactivities of the reactants R1 and R2, the global electrophilicity (ω) and nucleophilicity (N) indexes were calculated, as summarized in Table 1. Meanwhile, the bonding site selectivity of R1 and R2 was also assessed based on the condensed-to-atom Fukui functions, as outlined in Table 2. It can be seen that R1 has a larger electrophilicity index than R2, meaning that it will act as an electrophile, while R2 has a larger nucleophilicity index than R1, and hence it will serve as a nucleophile. From Table 2, it can be seen that the C1 atom of R1 has the largest f+ value while the N3 atom of R2 has the largest f− value, so the C1 atom of R1 has the most electrophilic characteristic while the N3 atom of R2 has the most nucleophilic characteristic. Accordingly, the bonding sites for the reaction between R1 and R2 should appear between the C1 and N3 atoms, agreeing with the experiment result.| E HOMO | E LUMO | μ | η | ω | N | |
|---|---|---|---|---|---|---|
| R1 | −7.449 | −1.996 | −4.723 | 5.453 | 2.045 | 3.058 |
| R2 | −6.911 | −0.124 | −3.518 | 6.788 | 0.911 | 3.596 |
| Reactant | Atom | f + | f − |
|---|---|---|---|
| a The atomic numbers of the selected C and N atoms in the reactants R1 and R2 are shown in Scheme 1. | |||
| R1 | C1 | 0.133 | 0.117 |
| C2 | −0.032 | 0.025 | |
| C3 | 0.016 | 0.081 | |
| C4 | 0.026 | 0.151 | |
| C5 | 0.048 | −0.040 | |
| C6 | 0.003 | 0.156 | |
| C7 | 0.059 | 0.031 | |
| C8 | 0.011 | 0.073 | |
| C9 | 0.034 | 0.136 | |
| C10 | −0.017 | −0.024 | |
| R2 | C1 | 0.087 | 0.102 |
| C2 | 0.000 | −0.024 | |
| N3 | 0.020 | 0.190 | |
| C4 | 0.007 | −0.004 | |
| C5 | 0.073 | 0.093 | |
| C6 | 0.106 | −0.003 | |
| C7 | −0.003 | 0.136 | |
| C8 | 0.114 | 0.023 | |
| C9 | 0.039 | 0.064 | |
| C10 | 0.048 | 0.034 | |
| C11 | 0.126 | 0.041 | |
| C12 | −0.003 | 0.105 | |
| C13 | 0.113 | 0.000 | |
3.2 Mechanisms of (S)-C6-catalyzed amination reaction between R1 and R2 which leads to the chiral N-arylcarbazole
For the amination reaction shown in Scheme 1, there are four different orientations for R1 and R2, as displayed in Fig. 1, so the reaction could proceed via four different modes corresponding to four pathways (i.e., paths I–IV). In each pathway, R1 and R2 simultaneously interact with (S)-C6via dual HB activation mode, that is, the O2–H2 group of (S)-C6 serves as one HB donor to interact with the N2 atom in the N1![[double bond, length as m-dash]](https://www.rsc.org/images/entities/char_e001.gif) N2CO2Me group of R1 (i.e., O2–H2⋯N2 HB) while the O1 atom in the P
N2CO2Me group of R1 (i.e., O2–H2⋯N2 HB) while the O1 atom in the P![[double bond, length as m-dash]](https://www.rsc.org/images/entities/char_e001.gif) O1 group of (S)-C6 acts as one HB acceptor to interact with the N3–H3 group of R2 (i.e., O1⋯H3–N3 HB). As shown in Fig. 1, the reaction paths I and III generate the experimental desired product P with a yield ratio of 96%, while paths II and IV lead to the minor enantiomer of product P (denoted as ent-P) with a yield ratio of 4%, and the enantioselectivity ratio of P1
O1 group of (S)-C6 acts as one HB acceptor to interact with the N3–H3 group of R2 (i.e., O1⋯H3–N3 HB). As shown in Fig. 1, the reaction paths I and III generate the experimental desired product P with a yield ratio of 96%, while paths II and IV lead to the minor enantiomer of product P (denoted as ent-P) with a yield ratio of 4%, and the enantioselectivity ratio of P1![[thin space (1/6-em)]](https://www.rsc.org/images/entities/char_2009.gif) :
:![[thin space (1/6-em)]](https://www.rsc.org/images/entities/char_2009.gif) ent-P1 is 98
ent-P1 is 98![[thin space (1/6-em)]](https://www.rsc.org/images/entities/char_2009.gif) :
:![[thin space (1/6-em)]](https://www.rsc.org/images/entities/char_2009.gif) 2 (Scheme 1).
2 (Scheme 1).
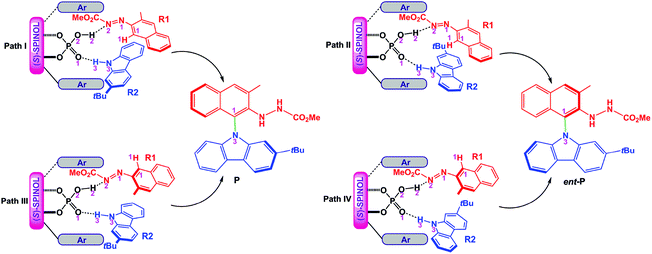 | ||
| Fig. 1 Four modes of the reaction between R1 and R2 catalyzed by (S)-C6 and the resultant products P and ent-P. | ||
As depicted in Fig. 2, the Gibbs free energy profile for path I indicates that the overall reaction leading to the product P goes through the dimeric and trimeric complexes (i.e., DI and COMI), two transition states (i.e., TSI-1 and TSI-2) and four intermediates (i.e., IMI-1–IMI-4). The optimized geometries of the reactants, catalyst, complexes, transition states, intermediates and product are shown in Fig. 3. Both the reactants (R1 and R2) can interact with the catalyst (S)-C6 to form the dimeric complex, but the calculation results suggest that the dimeric complex formed between R1 and (S)-C6 (i.e., DI) has a lower Gibbs free energy than that between R2 and (S)-C6 (see Table S1 in the ESI† for details), meaning that the complex DI is more favorable. An energy of 4.2 kcal mol−1 is needed in the formation of DI. In DI, the O2–H2⋯N2 HB forms between the N1![[double bond, length as m-dash]](https://www.rsc.org/images/entities/char_e001.gif) N2R group of R1 and the O2–H2 group of (S)-C6 (see Fig. S2 and Table S2 in the ESI†). The subsequent interaction between DI and R2 forms the trimeric complex COMI in which the O1⋯H3–N3 HB between the N3–H3 group of R2 and the P
N2R group of R1 and the O2–H2 group of (S)-C6 (see Fig. S2 and Table S2 in the ESI†). The subsequent interaction between DI and R2 forms the trimeric complex COMI in which the O1⋯H3–N3 HB between the N3–H3 group of R2 and the P![[double bond, length as m-dash]](https://www.rsc.org/images/entities/char_e001.gif) O1 group of (S)-C6 (see Fig. S3 and Table S3 in the ESI†), and an energy of 2.1 kcal mol−1 are needed for DI to COMI. The H2⋯N2 distance increases after the formation of COMI (i.e., 1.72 Å in DI and 1.73 Å in COMI). From Table 3, it can be seen that the O2–H2⋯N2 HB in COMI has a shorter H2⋯N2 distance than the O1⋯H3 distance of O1⋯H3–N3 HB, and the O2–H2⋯N2 HB strength is stronger than O1⋯H3–N3 HB strength. The natural atomic charge of the C1 atom in COMI becomes less negative than that in R1, indicating that the C1 atom of R1 is electrophilic, while the natural atomic charge of the N3 atom in COMI becomes more negative than that in R2, suggesting that the N3 atom of R2 is nucleophilic. Then the proton transfer occurs from (S)-C6 to R1 which leads to the conversion of the O2–H2⋯N2 HB into O2⋯H2–N2 HB in TSI-1 (see Fig. S4 and Table S4 in the ESI†). Meanwhile, the nucleophilic attack of the N3 atom on the C1 atom also takes places, as can be seen from the decreased C1⋯N3 distance (i.e., 2.08 Å) relative to that in COMI (i.e., 3.12 Å). The C1–N3 bond with a bond length of 1.55 Å forms in IMI-1 (Fig. 3), and an energy release of 7.0 kcal mol−1 is observed for the process from TSI-1 to IMI-1. Due to the proton transfer of the H3 atom to O1 atom, one new O1–H3⋯N3 HB also forms in IMI-1 (see Fig. S5 and Table S5 in the ESI†). From COMI to IMI-1, the tautomerization of (S)-C6 finishes the conversions of the phosphorus–oxygen bond from a single bond (i.e., P–O2 in COMI) to a double bond (i.e., P
O1 group of (S)-C6 (see Fig. S3 and Table S3 in the ESI†), and an energy of 2.1 kcal mol−1 are needed for DI to COMI. The H2⋯N2 distance increases after the formation of COMI (i.e., 1.72 Å in DI and 1.73 Å in COMI). From Table 3, it can be seen that the O2–H2⋯N2 HB in COMI has a shorter H2⋯N2 distance than the O1⋯H3 distance of O1⋯H3–N3 HB, and the O2–H2⋯N2 HB strength is stronger than O1⋯H3–N3 HB strength. The natural atomic charge of the C1 atom in COMI becomes less negative than that in R1, indicating that the C1 atom of R1 is electrophilic, while the natural atomic charge of the N3 atom in COMI becomes more negative than that in R2, suggesting that the N3 atom of R2 is nucleophilic. Then the proton transfer occurs from (S)-C6 to R1 which leads to the conversion of the O2–H2⋯N2 HB into O2⋯H2–N2 HB in TSI-1 (see Fig. S4 and Table S4 in the ESI†). Meanwhile, the nucleophilic attack of the N3 atom on the C1 atom also takes places, as can be seen from the decreased C1⋯N3 distance (i.e., 2.08 Å) relative to that in COMI (i.e., 3.12 Å). The C1–N3 bond with a bond length of 1.55 Å forms in IMI-1 (Fig. 3), and an energy release of 7.0 kcal mol−1 is observed for the process from TSI-1 to IMI-1. Due to the proton transfer of the H3 atom to O1 atom, one new O1–H3⋯N3 HB also forms in IMI-1 (see Fig. S5 and Table S5 in the ESI†). From COMI to IMI-1, the tautomerization of (S)-C6 finishes the conversions of the phosphorus–oxygen bond from a single bond (i.e., P–O2 in COMI) to a double bond (i.e., P![[double bond, length as m-dash]](https://www.rsc.org/images/entities/char_e001.gif) O2 in IMI-1) and from the double bond (i.e., P
O2 in IMI-1) and from the double bond (i.e., P![[double bond, length as m-dash]](https://www.rsc.org/images/entities/char_e001.gif) O1 in COMI) to a single bond (i.e., P–O1 in IMI-1), and (S)-C6 is converted into its tautomer in IMI-1. But then the O1–H3⋯N3 HB breaks in IMI-2 (see Fig. S6 and Table S6 in the ESI†), and the N3 atom recovers back to the sp2 hybridized state. In the process of conversion from IMI-1 to IMI-2, the tendency of the axial chirality along the C1–N3 bond appears. The ionization of the tautomerized (S)-C6 in IMI-2 makes the protonation of the N1 atom possible which leads to the formation of the N1–H3 bond. After this, the left O1− group is able to approach the H1 atom of the H1–C1 group and forms the O1−⋯H1 interaction with a distance of 2.03 Å in IMI-3 (see Fig. S7 and Table S7 in the ESI†). The processes from IMI-1 to IMI-3 have a total energy release of 9.8 kcal mol−1. The H1 atom gradually shifts to the O1− anion which goes through the transition state TSI-2, and the O1−⋯H1 and C1⋯H1 distances in TSI-2 are 1.38 and 1.29 Å, respectively (Fig. 3 and S8, Table S8†). An energy of 6.2 kcal mol−1 is absorbed (Fig. 2) from IMI-3 to TSI-2. The O2⋯H2 distance of O2⋯H2–N2 HB becomes longer (i.e., 1.96 Å) in TSI-2. The O1–H1 bond finally forms in the intermediate IMI-4 and thus the catalyst (S)-C6 is recovered which releases an energy of 28.1 kcal mol−1 (Fig. 2). In IMI-4, (S)-C6 interacts with the experimental favorable axially chiral product Pvia O2⋯H2–N2 and O1–H1⋯N1 HBs (see Fig. S9 and Table S9 in the ESI†). After the breakage of the O2⋯H2–N2 and O1–H1⋯N1 HBs, the catalyst is separated from IMI-4 and the major product P is finally generated.
O1 in COMI) to a single bond (i.e., P–O1 in IMI-1), and (S)-C6 is converted into its tautomer in IMI-1. But then the O1–H3⋯N3 HB breaks in IMI-2 (see Fig. S6 and Table S6 in the ESI†), and the N3 atom recovers back to the sp2 hybridized state. In the process of conversion from IMI-1 to IMI-2, the tendency of the axial chirality along the C1–N3 bond appears. The ionization of the tautomerized (S)-C6 in IMI-2 makes the protonation of the N1 atom possible which leads to the formation of the N1–H3 bond. After this, the left O1− group is able to approach the H1 atom of the H1–C1 group and forms the O1−⋯H1 interaction with a distance of 2.03 Å in IMI-3 (see Fig. S7 and Table S7 in the ESI†). The processes from IMI-1 to IMI-3 have a total energy release of 9.8 kcal mol−1. The H1 atom gradually shifts to the O1− anion which goes through the transition state TSI-2, and the O1−⋯H1 and C1⋯H1 distances in TSI-2 are 1.38 and 1.29 Å, respectively (Fig. 3 and S8, Table S8†). An energy of 6.2 kcal mol−1 is absorbed (Fig. 2) from IMI-3 to TSI-2. The O2⋯H2 distance of O2⋯H2–N2 HB becomes longer (i.e., 1.96 Å) in TSI-2. The O1–H1 bond finally forms in the intermediate IMI-4 and thus the catalyst (S)-C6 is recovered which releases an energy of 28.1 kcal mol−1 (Fig. 2). In IMI-4, (S)-C6 interacts with the experimental favorable axially chiral product Pvia O2⋯H2–N2 and O1–H1⋯N1 HBs (see Fig. S9 and Table S9 in the ESI†). After the breakage of the O2⋯H2–N2 and O1–H1⋯N1 HBs, the catalyst is separated from IMI-4 and the major product P is finally generated.
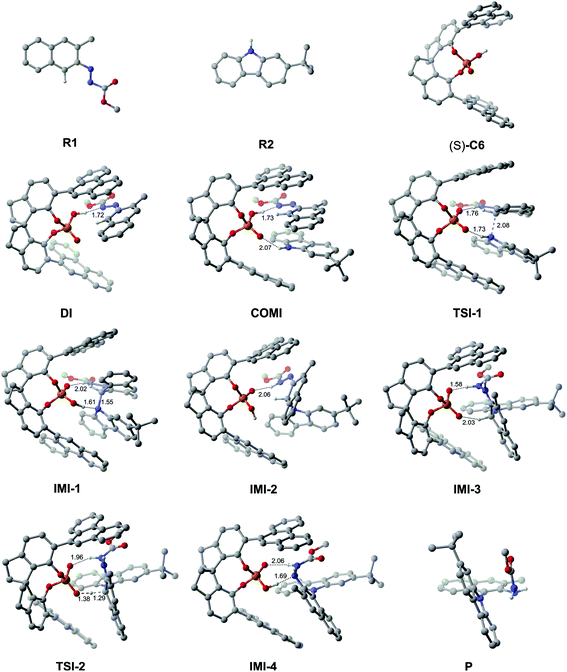 | ||
| Fig. 3 The optimized geometries of the reactants, catalyst, complexes, transition states, intermediates and product in path I. The distances are in Å. Some hydrogen atoms are omitted for clarity. | ||
| Complex | HBb | Natural atomic chargec | ||
|---|---|---|---|---|
| O1⋯H3–N3 | O2–H2⋯N2 | q C1 | q N3 | |
| a The atomic number is shown in Scheme 1. b The HB strength can be calculated using EHB = −0.429GBCP, in which GBCP is the local electronic kinetic energy density at the bond critical point (BCP) of HB. c The natural atomic charge on the C1 atom in R1 (qC1) is −0.1352 electrons, and that on the N3 atom in R2 (qN3) is −0.5261 electrons. | ||||
| COMI | d (O1⋯H1) = 2.07 | d (H2⋯N2) = 1.73 | −0.1036 | −0.5438 |
| E HB = −4.2 | E HB = −7.9 | |||
| COMII | d (O1⋯H1) = 1.95 | d (H2⋯N2) = 1.68 | −0.1041 | −0.5459 |
| E HB = −5.4 | E HB = −9.0 | |||
| COMIII | d (O1⋯H1) = 1.99 | d (H2⋯N2) = 1.71 | −0.1247 | −0.5415 |
| E HB = −4.6 | E HB = −8.5 | |||
| COMIV | d (O1⋯H1) = 2.06 | d (H2⋯N2) = 1.68 | −0.0841 | −0.5459 |
| E HB = −4.4 | E HB = −9.3 | |||
Path II is the most favorable pathway in generating the product ent-P (Fig. 1). The Gibbs free energy profile for the whole reaction processes of path II is shown in Fig. 4, and the optimized geometries of the complexes, transition states, intermediates and product are shown in Fig. 5. Similar to the reaction processes occurring in path I, the catalyst (S)-C6 firstly interacts with R1 and forms the dimeric complex DIIvia the O2–H2⋯N2 HB (see Fig. S10 and Table S10 in the ESI†) which needs an energy of 4.2 kcal mol−1. Then R2 participates in the interaction and its H3–N3 group interacts with the P![[double bond, length as m-dash]](https://www.rsc.org/images/entities/char_e001.gif) O1 group of (S)-C6via the O1⋯H3–N3 HB (see Fig. S11 and Table S11 in the ESI†), resulting in the trimeric complex COMII. This process is endothermic and needs an energy of 4.8 kcal mol−1. In COMII, the H2⋯N2 distance of the O2–H2⋯N2 HB is 1.68 Å which becomes shorter than that in DII (i.e., 1.72 Å), while the O1⋯H3–N3 HB has an intermolecular O1⋯H3 distance of 1.95 Å (Fig. 5). Also, it can be seen from Table 3 that the H2⋯N2 distance of the O2–H2⋯N2 HB in COMII is shorter and the O2–H2⋯N2 HB is stronger. The variation of the natural atomic charge of the C1 (or N3) atom in COMI relative to that in R1 (or R2) indicates that the C1 atom of R1 is electrophilic, while the N3 atom of R2 is nucleophilic. Then the proton transfer takes place in which the H2 atom in the O2–H2 group of (S)-C6 is shifted to the N2 atom of R1 and forms a new O2−⋯H2–N2 HB with an O2−⋯H2 distance of 1.76 Å in TSII-1. As shown in Fig. 5, the O1⋯H3 distance of the O1⋯H3–N3 HB in TSII-1 is contracted (i.e., 1.86 Å). The nucleophilic attack of the N3 atom on the C1 atom is observed in TSII-1, and the C1⋯N3 distance is 2.05 Å (Fig. 5 and S12, Table S12†). The process of conversion from COMII to TSII-1 needs to overcome an energy barrier of 19.1 kcal mol−1 (Fig. 4). Due to the tautomerization of (S)-C6 in TSII-1, the original P–O2 single bond is converted into a P
O1 group of (S)-C6via the O1⋯H3–N3 HB (see Fig. S11 and Table S11 in the ESI†), resulting in the trimeric complex COMII. This process is endothermic and needs an energy of 4.8 kcal mol−1. In COMII, the H2⋯N2 distance of the O2–H2⋯N2 HB is 1.68 Å which becomes shorter than that in DII (i.e., 1.72 Å), while the O1⋯H3–N3 HB has an intermolecular O1⋯H3 distance of 1.95 Å (Fig. 5). Also, it can be seen from Table 3 that the H2⋯N2 distance of the O2–H2⋯N2 HB in COMII is shorter and the O2–H2⋯N2 HB is stronger. The variation of the natural atomic charge of the C1 (or N3) atom in COMI relative to that in R1 (or R2) indicates that the C1 atom of R1 is electrophilic, while the N3 atom of R2 is nucleophilic. Then the proton transfer takes place in which the H2 atom in the O2–H2 group of (S)-C6 is shifted to the N2 atom of R1 and forms a new O2−⋯H2–N2 HB with an O2−⋯H2 distance of 1.76 Å in TSII-1. As shown in Fig. 5, the O1⋯H3 distance of the O1⋯H3–N3 HB in TSII-1 is contracted (i.e., 1.86 Å). The nucleophilic attack of the N3 atom on the C1 atom is observed in TSII-1, and the C1⋯N3 distance is 2.05 Å (Fig. 5 and S12, Table S12†). The process of conversion from COMII to TSII-1 needs to overcome an energy barrier of 19.1 kcal mol−1 (Fig. 4). Due to the tautomerization of (S)-C6 in TSII-1, the original P–O2 single bond is converted into a P![[double bond, length as m-dash]](https://www.rsc.org/images/entities/char_e001.gif) O2 double bond in IMII-1, while the original P
O2 double bond in IMII-1, while the original P![[double bond, length as m-dash]](https://www.rsc.org/images/entities/char_e001.gif) O1 double bond is converted into a P–O1 single bond, and thus (S)-C6 is converted into its tautomer in IMII-1. In IMII-1, the H3 atom is abstracted from the H3–N3 group and is shifted to the O1 atom, leading to the O1–H3 bond. Two intermolecular HBs (i.e., O2⋯H2–N2 and O1–H3⋯N3 HBs) exist in IMII-1 (see Fig. S13 and Table S13 in the ESI†), and the C1–N3 bond forms with a bond length of 1.54 Å. After the breakage of the O1–H3⋯N3 HB (see Fig. S14 and Table S14 in the ESI†), the N3 atom is recovered to the sp2 hybridization state and the axial chirality along C1–N3 bond tends to appear in IMII-2. The acidity of IMII-2 enables it to give its proton in the O1–H3 group to the N1 atom leaving the O1− anion which tends to approach the H1 atom in the C1–H1 group in the intermediate IMII-3. QTAIM analyses of IMII-2 and IMII-3 are shown in Fig. S14, S15 and Tables S14, S15.† The process from IMII-1 to IMII-3 is exothermic. Due to the strong attraction between the O1− anion and H1 atom, the H1 atom gradually shifts to the O1− anion in the transition state TSII-2. QTAIM analyses of TSII-2 are shown in Fig. S16 and Table S16.† As shown in Fig. 5, the interaction distance between the O1− anion and H1 atom is 1.33 Å, while the distance between C1 and H1 atoms is 1.31 Å. The energy barrier for the process from IMII-3 to TSII-2 is 5.4 kcal mol−1. The O1–H1 bond forms in IMII-4, in which the O2⋯H2–N2 HB remains (see Fig. S17 and Table S17 in the ESI†). After the breakage of the O2⋯H2–N2 HB, the catalyst (S)-C6 is regenerated and the minor product ent-P is yielded.
O1 double bond is converted into a P–O1 single bond, and thus (S)-C6 is converted into its tautomer in IMII-1. In IMII-1, the H3 atom is abstracted from the H3–N3 group and is shifted to the O1 atom, leading to the O1–H3 bond. Two intermolecular HBs (i.e., O2⋯H2–N2 and O1–H3⋯N3 HBs) exist in IMII-1 (see Fig. S13 and Table S13 in the ESI†), and the C1–N3 bond forms with a bond length of 1.54 Å. After the breakage of the O1–H3⋯N3 HB (see Fig. S14 and Table S14 in the ESI†), the N3 atom is recovered to the sp2 hybridization state and the axial chirality along C1–N3 bond tends to appear in IMII-2. The acidity of IMII-2 enables it to give its proton in the O1–H3 group to the N1 atom leaving the O1− anion which tends to approach the H1 atom in the C1–H1 group in the intermediate IMII-3. QTAIM analyses of IMII-2 and IMII-3 are shown in Fig. S14, S15 and Tables S14, S15.† The process from IMII-1 to IMII-3 is exothermic. Due to the strong attraction between the O1− anion and H1 atom, the H1 atom gradually shifts to the O1− anion in the transition state TSII-2. QTAIM analyses of TSII-2 are shown in Fig. S16 and Table S16.† As shown in Fig. 5, the interaction distance between the O1− anion and H1 atom is 1.33 Å, while the distance between C1 and H1 atoms is 1.31 Å. The energy barrier for the process from IMII-3 to TSII-2 is 5.4 kcal mol−1. The O1–H1 bond forms in IMII-4, in which the O2⋯H2–N2 HB remains (see Fig. S17 and Table S17 in the ESI†). After the breakage of the O2⋯H2–N2 HB, the catalyst (S)-C6 is regenerated and the minor product ent-P is yielded.
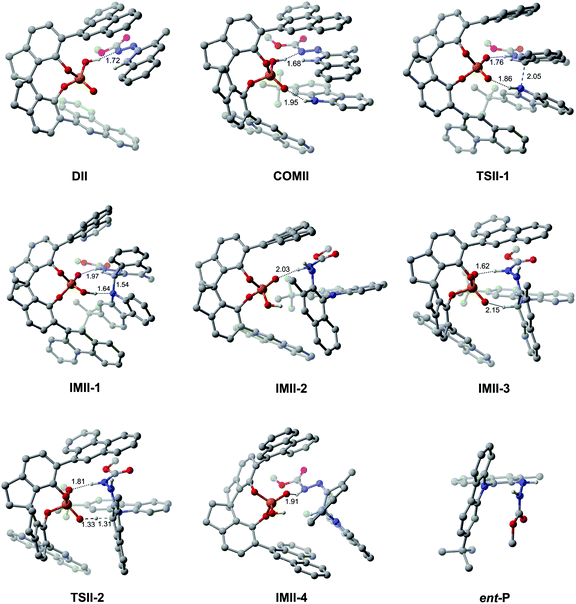 | ||
| Fig. 5 The optimized geometries of the complexes, transition states and intermediates in path II. The distances are in Å. Some hydrogen atoms are omitted for clarity. | ||
Both the reaction paths I and III result in the experimental desired product P, while both the reaction paths II and IV lead to the minor product as ent-P, so the mechanism of path III (or IV) is similar to that of path I (or II), and therefore, the detailed reaction mechanisms for paths III and IV are presented in the ESI† for simplicity.
A comparison of the energy barriers in paths I–IV suggests that the enantioselectivity-determining steps correspond to the rate-determining steps in which the transition states TSI-1, TSII-1, TSIII-1, and TSIV-1 in paths I–IV with the highest energies determine the enantioselectivity of (S)-C6-catalyzed amination reaction. From Fig. 2, 4, S18 and S19,† we can see that the energies of TSI-1, TSII-1, TSIII-1, and TSIV-1 in paths I–IV follow an order of TSI-1 (26.2 kcal mol−1) < TSII-1 (28.1 kcal mol−1) < TSIV-1 (38.5 kcal mol−1) < TSIII-1 (39.5 kcal mol−1), indicating that path I is the most favorable pathway leading to the experimental desired product P and path II is the most favorable pathway leading to the product ent-P. In addition, we found that the trimeric complex COMI (or COMII) with a lower energy is more favorable than COMIII (or COMIV) in converting into the corresponding transition state.
The calculated ee value (see the ESI† for details) matches well with the experimental one (96% ee, Scheme 1). The results show that the amination reaction between R1 and R2 catalyzed by (S)-C6 proceeds through path I which leads to the major product P, while the minor product ent-P is achieved through path II.
3.3 Origin and influencing factors of enantioselectivity
To assess what factors affect the enantioselectivity and how they cause the effect, as a representative, we first analyzed and made a comparison of the transition states TSI-1 and TSII-1. As shown in Fig. 6, in TSI-1 and TSII-1, (S)-C6 provides one proton to R1 and interacts with R1via the O2⋯H2–N2 HB while it interacts with R2via the O1⋯H3–N3 HB simultaneously. It is evident that (S)-C6 anions and R1 cations in TSI-1 and TSII-1 have similar orientations, while R2 in them has the opposite orientation, and the large chiral pocket of the (S)-C6 anion allows it to accommodate the R1 cation and R2. Noticeably, a greater extent of twisting is observed for the phenanthryl group of the (S)-C6 anion in TSII-1 than that in TSI-1. This phenomenon should be attributed to the close contact of the –tBu group of R2 and the phenanthryl group of the (S)-C6 anion in TSII-1 which causes a large steric hindrance. Thereby, in fact, (S)-C6 is flexible in controlling the size of its chiral pocket, and whether the reactants match with the size of the chiral pocket or not will finally determine the enantioselectivity.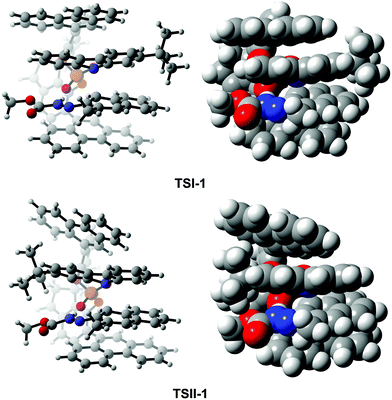 | ||
| Fig. 6 The orientations of the reactants and catalyst in the optimized structures of TSI-1 and TSII-1. | ||
Accordingly, in the following sections, the size of the chiral pocket of the CPA which affects the enantioselectivity will be elaborated in detail. To gain a good understanding of the relationship between the sizes of chiral pockets of CPA catalysts and their enantioselective performance, the amination reactions between 2-(naphthalen-2-yl)diazenecarboxylate (denoted as R1a) and 2-tBu-9H-carbazole (R2) catalyzed by a series of CPA catalysts with different –R and –Ar groups were selected and investigated, as outlined in Table 4. From the previous analysis of the (S)-C6 catalyzed amination reaction between R1 and R2, it can be found that paths I and II are more favorable and they mainly lead to the respective products P and ent-P, while paths III and IV are less favorable and they make a small contribution in leading to the respective products P and ent-P, so the final ee value is determined by paths I and II. Because the transition state with the highest energy determines the enantioselectivity of the amination reaction, the transition states of the two favorable pathways resulting in the main product and its enantiomer for the amination reactions (Table 4) were taken into account to explain the influence of the structures of CPAs on the ee values. As shown in Fig. 7, the theoretical ee value is in agreement with the experimental ee value, and the result indicates that the catalytic performance in the stereocontrol of BINOL-derived CPAs (i.e., (R)-C8, (R)-C10) is inferior to that of SPINOL-derived CPAs (i.e., (S)-C1, (S)-C2, (S)-C3, (S)-C6) in the amination reactions between R1a and R2 (Table 4).
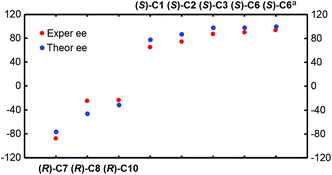 | ||
| Fig. 7 The relationship between the experimental and theoretical ee values for the amination reactions catalyzed by CPA catalysts. | ||
| CPA | Solvent | T | ΔΔGTS![[thin space (1/6-em)]](https://www.rsc.org/images/entities/char_2009.gif) b b |
Exper. ee | Theor. ee |
|---|---|---|---|---|---|
| a 10 mol% of (S)-C6 was used, and 3 Å molecular sieves (MS) were added, DCE = 1,2-dichlorethane. b ΔΔGTS is the energy difference between the Gibbs free energies of the transition states in the two favorable pathways resulting in the main product and its enantiomer for the amination reactions. | |||||
| (S)-C1 | CH2Cl2 | 40 | 1.3 | 65 | 78 |
| (S)-C2 | CH2Cl2 | 40 | 1.6 | 74 | 87 |
| (S)-C3 | CH2Cl2 | 40 | 2.7 | 87 | 98 |
| (S)-C6 | CH2Cl2 | 40 | 3.0 | 90 | 98 |
| (R)-C7 | CH2Cl2 | 40 | −1.2 | −88 | −76 |
| (R)-C8 | CH2Cl2 | 40 | −0.6 | −25 | −46 |
| (R)-C10 | CH2Cl2 | 40 | −0.4 | −24 | −31 |
| (S)-C6a | CHCl3 | 50 | 4.1 | 93 | 100 |
To assess the role of the –Ar group in the CPA catalyst, a comparison was made. Herein, the –Ar group of (S)-C6 is replaced by a H atom to obtain a new catalyst (denoted as (S)-C6H), and then the interactions of (S)-C6H, R1a and R2 were optimized and they are similar to the previous paths I and II. Accordingly, the two transition states TSIH-1 and TSIIH-1 corresponding to two paths IH and IIH for the (S)-C6H catalyzed reaction between R1a and R2 can be obtained, and TSIH-1 has a higher Gibbs free energy than TSIIH-1 by 1.2 kcal mol−1. It can be seen from their optimized geometries displayed in Fig. 8 that the C1⋯N3 distance in TSIIH-1 is longer than that in TSIH-1 by 0.05 Å (i.e., 2.09 Å in TSIH-1 and 2.14 Å in TSIIH-1), which can be attributed to the intermolecular repulsion between the –tBu group of R2 and the azo group of R1a. The relatively lower Gibbs free energy of TSIIH-1 compared to that of TSIH-1 indicates that the smaller chiral pocket of (S)-C6H cannot cause significant steric hindrance for the interaction between R2 and R1a. Similarly, the reaction between R1a and R2 catalyzed by (S)-C6 with the –Ar group also occurs following paths IAr and IIAr, and the C1⋯N3 distance of TSIIAr-1 is 0.06 Å longer than that in TSIAr-1 (i.e., 2.03 Å in TSIAr-1 and 2.09 Å in TSIIAr-1). It can be seen that the protonated R1a interacts with R2 with an appropriate C1⋯N3 distance in TSIAr-1, and the –tBu group of R2 is out of the chiral pocket of the (S)-C6 anion, and these arrangements make the complex between the protonated R1a and R2 match well with the chiral pocket of the (S)-C6 anion. In contrast, the interaction between the protonated R1a and R2 in TSIIAr-1 has a different arrangement in which the –tBu group of R2 is located in the chiral pocket of the (S)-C6 anion, causing a longer C1⋯N3 distance. Clearly, such an arrangement results in a stronger steric repulsion between the aromatic ring of the protonated R1a (or R2) and the –Ar group of the (S)-C6 anion, so a relatively higher Gibbs free energy (ca. 3.0 kcal mol−1) of TSIIAr-1 compared to that of TSIAr-1 is observed.
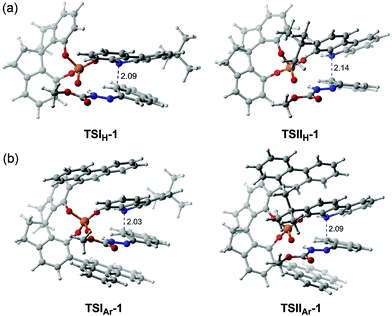 | ||
| Fig. 8 The transition states (a) TSIH-1 and TSIIH-1 for (S)-C6H catalyzed and (b) TSIAr-1 and TSIIAr-1 for (S)-C6 catalyzed reactions between R1a and R2. The C1⋯N1 distances are in Å. | ||
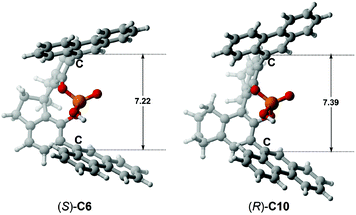
To further illustrate the effect of the chiral pocket of the CPA catalyst, a comparison between (S)-C6 and (R)-C10 was made, as shown in Fig. 9. The chiral pocket is measured from the distance between the C atoms of –Ar groups connected to the main skeleton of the CPA. Compared to (S)-C6, (R)-C10 provides a similar chiral environment, but the (R)-C10 catalyzed reaction between R1a and R2 offers the opposite axially chiral product with a lower ee value. The reason can be the fact that (R)-C10 provides a larger chiral pocket which can effectively reduce the steric repulsion between the –tBu group of R2 and the –Ar group of the (R)-C10 anion in the transition state which is denoted as TSI(R)-C10-1 or TSII(R)-C10-1. Consequently, the Gibbs free energies for the transition states TSI(R)-C10-1 and TSII(R)-C10-1 have a few differences (ca. 0.4 kcal mol−1, Table 4), so a lower enantioselectivity (i.e., −24% ee) is observed.
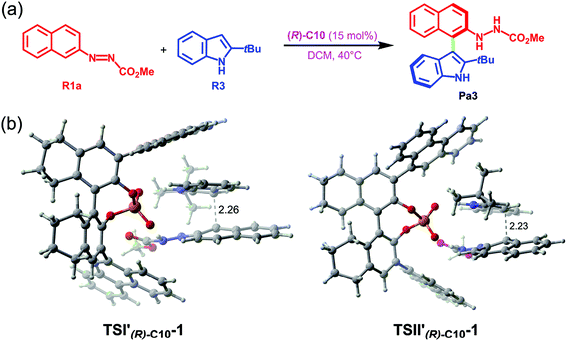
In terms of the above analyses, for the amination reaction in which the C–N bond forms, it appears that the BINOL-derived CPA catalyst possessing the larger size of the chiral pocket like (R)-C10 shows poor performance while the SPINOL-derived CPA catalyst with the smaller size of the chiral pocket like (S)-C6 shows good performance. In the transition states, given that the C–N bond is shorter than the C–C bond, it can be hypothesized and expected that the BINOL-derived CPA catalyst could catalyze the reaction system in which the C–C bond forms because the C⋯C distance in the transition state for C–C bond formation reaction is usually longer than the C⋯N distance in the transition state for C–N bond formation reaction. To verify this, the BINOL-derived CPA (i.e., (R)-C10) catalyzed C–C bond formation reaction between 2-(naphthalen-2-yl)diazenecarboxylate (denoted as R1a) and 2-tBu-indole (R3) was investigated, as shown in Fig. 10a. It can be seen from Fig. 10 that the C⋯C distances in the transition states (i.e., TSI′(R)-C10-1 and TSII′(R)-C10-1) for (R)-C10 catalyzed reactions are longer than the C⋯N distances in the transition states (i.e., TSIAr-1, TSIIAr-1) for the (S)-C6 catalyzed reaction between R1a and R2 by about 0.23 or 0.14 Å. Note that the size of the chiral pocket of BINOL-derived CPAs like (R)-C10 (i.e., the C⋯C distance between the C atoms of –Ar groups connected to the main skeletons of (R)-C10 shown in Fig. 9) is larger than that of SPINOL-derived CPAs like (S)-C6 (i.e., the C⋯C distance between the C atoms of –Ar groups connected to the main skeletons of (S)-C6 shown in Fig. 9) by about 0.17 Å. Therefore, the size of the chiral pocket of BINOL-derived CPAs seems to be suitable for catalyzing the C–C bond formation reaction, but actually the catalytic performance of BINOL-derived CPAs is also related to the sizes of substrates.
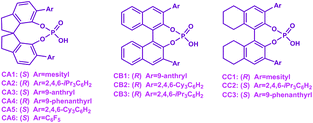
Furthermore, a statistical analysis of the previous experimental work37,89–99 was conducted to assess the tendencies of SPINOL- and BINOL-derived CPAs in catalyzing C–C and C–N bond formation reactions. The reactions catalyzed by CPAs including SPINOL- and BINOL-derived catalysts to form the C–N and C–C bonds are summarized in Tables 5 and 6, respectively. As shown in Fig. 11, the C–N bond formation reaction systems catalyzed by the SPINOL-derived CPAs provide higher ee values and better yields than those catalyzed by the BINOL-derived CPAs. In contrast, the C–C bond formation reaction systems catalyzed by the BINOL-derived CPAs lead to higher ee values and better yields than those catalyzed by the SPINOL-derived CPAs. Thereby, it can be concluded that the type of CPA does significantly affect the experimental results in terms of both the ee value and yield, and to a certain extent the SPINOL-derived CPA possessing a moderate chiral pocket functions more efficiently for the C–N bond formation reaction system while the BINOL-derived CPA possessing a larger chiral pocket functions more efficiently for the C–C bond formation reaction system, and the reason is that the sizes of substrates match well with the chiral pocket of these CPAs. Further analyses suggest that the SPINOL-derived CPA can function excellently in catalyzing not only the C–N bond formation reaction but also the C–C bond formation reaction,100 or even better than the BINOL-derived CPA,101 while the BINOL-derived CPA can also catalyze the C–N bond formation reaction with good performance.102 Obviously, the good performance of either the SPINOL- or BINOL-derived CPA is significantly dependent upon the precondition that the sizes of substrates should match well with the chiral pocket of CPA. In addition, it should be noted that the chiral pocket of the CPA catalyst is decided not only by the backbone but also by the substituent on the –Ar group. The bigger hindrance the substituent provides, the smaller pocket the CPA catalyst has. The relationship between the substituent on the –Ar group and the size of the chiral pocket of the CPA will be taken into account in future work.
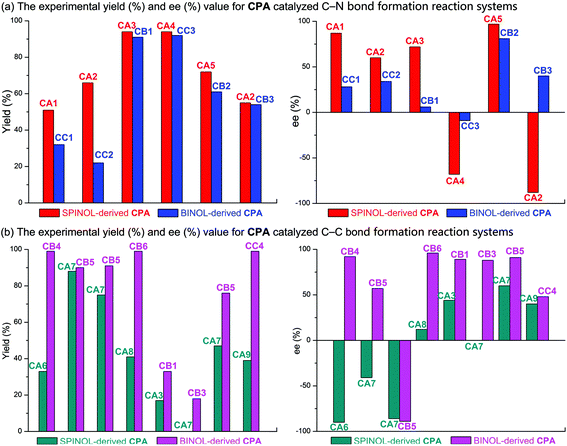 | ||
| Fig. 11 The experimental yield (%) and ee (%) value for (a) the C–N and (b) C–C bond formation reactions catalyzed by SPINOL- and BINOL-derived CPAs. | ||
| Reaction | CPA | Yield | ee | Refa |
|---|---|---|---|---|
| a Ref.: The reaction, yield (%) and ee (%) value are taken from the previous experimental work. | ||||

|
CA6 | 33 | −90 | 37 |
| CB4 | 99 | 92 | ||

|
CA7 | 88 | −41 | 93 |
| CB5 | 90 | 57 | ||

|
CA7 | 75 | −86 | 94 |
| CB5 | 91 | −89 | ||

|
CA8 | 41 | 12 | 95 |
| CB6 | 99 | 96 | ||

|
CA3 | 17 | 44 | 96 |
| CB1 | 33 | 89 | ||

|
CA7 | Traces | — | 97 |
| CB3 | 18 | 88 | ||

|
CA7 | 47 | 60 | 98 |
| CB5 | 76 | 91 | ||

|
CA9 | 39 | 40 | 99 |
| CC4 | 99 | 48 | ||
4. Conclusions
Theoretical investigations on the C–N cross-coupling reaction between azonaphthalene (R1) and carbazole (R2) using the chiral phosphoric acid (i.e., (S)-C6) were carried out. The results show that four pathways (I–IV) may exist in which paths I and II dominantly generate the main and minor products, respectively. The amination reaction between R1 and R2 catalyzed by (S)-C6 was promoted by dual HB activation mode. The roles of intermolecular interactions in the complexes, intermediates and transition states in the four pathways were illustrated by QTAIM analysis. It is demonstrated that the types of chiral phosphoric acids significantly affect the enantioselectivity, and the SPINOL-derived CPAs like (S)-C6 are suitable for the asymmetric C–N bond formation reaction systems while the BINOL-derived CPAs like (R)-C10 are suitable for the asymmetric C–C bond formation reaction systems to a certain extent, but it should be emphasized that the performance of either the SPINOL- or BINOL-derived CPA catalyst significantly depends upon the condition whether the sizes of substrates match well with the chiral pocket of CPA or not.Conflicts of interest
The authors declare that they have no conflict of interest.Acknowledgements
We acknowledge the financial support from the Natural Science Foundation of Gansu Province, China (No. 20JR5RA289), the Fundamental Research Funds for the Central Universities (lzujbky-2020-kb06) and the Open and Cooperation Innovation Fund from Xi'an Modern Chemistry Research Institute.References
- C. Börger, O. Kataeva and H.-J. Knölker, Novel approach to biscarbazole alkaloids via Ullmann coupling–synthesis of murrastifoline-A and bismurrayafoline-A, Org. Biomol. Chem., 2012, 10, 7269–7273 RSC.
- A. W. Schmidt, K. R. Reddy and H.-J. Knölker, Occurrence, biogenesis, and synthesis of biologically active carbazole alkaloids, Chem. Rev., 2012, 112, 3193–3328 CrossRef CAS.
- X. Cao, D. Zhang, S. Zhang, Y. Tao and W. Huang, CN-Containing donor–acceptor-type small-molecule materials for thermally activated delayed fluorescence OLEDs, J. Mater. Chem. C, 2017, 5, 7699–7714 RSC.
- Y.-C. Chen, G.-S. Huang, C.-C. Hsiao and S.-A. Chen, High Triplet Energy Polymer as Host for Electrophosphorescence with High Efficiency, J. Am. Chem. Soc., 2006, 128, 8549–8558 CrossRef CAS.
- S. Feuillastre, M. Pauton, L. Gao, A. Desmarchelier, A. J. Riives, D. Prim, D. Tondelier, B. Geffroy, G. Muller, G. Clavier and G. Pieters, Design and Synthesis of New Circularly Polarized Thermally Activated Delayed Fluorescence Emitters, J. Am. Chem. Soc., 2016, 138, 3990–3993 CrossRef CAS.
- H. Fu, H. Wu, X. Hou, F. Xiao and B. Shao, N-Aryl carbazole derivatives for non-doped red OLEDs, Synth. Met., 2006, 156, 809–814 CrossRef CAS.
- S. Hirata, Y. Sakai, K. Masui, H. Tanaka, S.-Y. Lee, H. Nomura, N. Nakamura, M. Yasumatsu, H. Nakanotani, Q. Zhang, K. Shizu, H. Miyazaki and C. Adachi, Highly efficient blue electroluminescence based on thermally activated delayed fluorescence, Nat. Mater., 2015, 14, 330–336 CrossRef CAS.
- H. Jian and J. M. Tour, En route to surface-bound electric field-driven molecular motors, J. Org. Chem., 2003, 68, 5091–5103 CrossRef CAS.
- S. Sebastian, D. Kondakov, B. Lüssem and K. Leo, Degradation mechanisms and reactions in organic light-emitting devices, Chem. Rev., 2015, 8449–8503 Search PubMed.
- P. Strohriegl and J. V. Grazulevicius, Charge-Transporting Molecular Glasses, Adv. Mater., 2002, 14, 1439–1452 CrossRef CAS.
- K. R. J. Thomas, J. T. Lin, Y.-T. Tao and C.-W. Ko, Light-emitting carbazole derivatives: potential electroluminescent materials, J. Am. Chem. Soc., 2001, 123, 9404–9411 CrossRef CAS.
- B. Wex and B. R. Kaafarani, Perspective on carbazole-based organic compounds as emitters and hosts in TADF applications, J. Mater. Chem. C, 2017, 5, 8622–8653 RSC.
- W. Y. Wong, C.-L. Ho, Z. Q. Gao, B.-X. Mi, C.-H. Chen, K. W. Cheah and Z. Y. Lin, Multifunctional iridium complexes based on carbazole modules as highly efficient electrophosphors, Angew. Chem., Int. Ed., 2006, 45, 7800–7803 CrossRef CAS.
- C.-S. Wu, J.-W. Wu and Y. Chen, Bipolar material with spiro-fluorenyl terminals: synthesis, characterization and application for enhancement of electrophosphorescence, J. Mater. Chem., 2012, 22, 23877–23884 RSC.
- Z. Yang, Z. Mao, Z. Xie, Y. Zhang, S. Liu, J. Zhao, J. Xu, Z. Chi and M. P. Aldred, Recent advances in organic thermally activated delayed fluorescence materials, Chem. Soc. Rev., 2017, 46, 915–1016 RSC.
- E. M. Barea, C. Zafer, B. Gultekin, B. Aydin, S. Koyuncu, S. Icli, F. F. Santiago and J. Bisquert, Quantification of the Effects of Recombination and Injection in the Performance of Dye-Sensitized Solar Cells Based on N-Substituted Carbazole Dyes, J. Phys. Chem. C, 2010, 114, 19840–19848 CrossRef CAS.
- T. Duan, K. Fan, C. Zhong, T. Peng, J. Qin and X. Chen, New organic dyes containing tert-Butyl-capped N-Arylcarbazole moiety for Dye-sensitized solar cells, RSC Adv., 2012, 2, 7081–7086 RSC.
- D. Kim, J. K. Lee, S. O. Kang and J. Ko, Molecular engineering of organic dyes containing N-aryl carbazole moiety for solar cell, Tetrahedron, 2007, 63, 1913–1922 CrossRef CAS.
- S. Tao, N. Liu and B. Dai, One-pot two-step synthesis of N-arylcarbazole-based skeleton, RSC Adv., 2016, 6, 43250–43260 RSC.
- C. Teng, X. C. Yang, C. Z. Yuan, C. Y. Li, R. K. Chen, H. N. Tian, S. F. Li, A. Hagfeldt and L. C. Sun, Two Novel Carbazole Dyes for Dye-Sensitized Solar Cells with Open-Circuit Voltages up to 1 V Based on Br−/Br3− Electrolytes, Org. Lett., 2009, 11, 5542–5545 CrossRef CAS.
- J. Bariwal and E. Van der Eycken, C-N bond forming cross-coupling reactions: an overview, Chem. Soc. Rev., 2013, 42, 9283–9303 RSC.
- P. Ruiz-Castillo and S. L. Buchwald, Applications of palladium-catalyzed C-N cross-coupling reactions, Chem. Rev., 2016, 116, 12564–12649 CrossRef CAS.
- C. Sambiagio, S. P. Marsden, A. J. Blacker and P. C. McGowan, Copper catalysed Ullmann type chemistry: from mechanistic aspects to modern development, Chem. Soc. Rev., 2014, 43, 3525–3550 RSC.
- J.-H. Chu, P.-S. Lin, Y.-M. Lee, W.-T. Shen and M.-J. Wu, Palladium(II)-Catalyzed One-Pot Syntheses of 9-(Pyridin-2-yl)-9H-carbazoles through a Tandem C–H Activation/C–X (X=C or N) Formation Process, Chem. – Eur. J., 2011, 17, 13613–13620 CrossRef CAS.
- T. Q. Hung, N. N. Thang, D. H. Hoang, T. T. Dang, A. Villinger and P. Langer, Efficient synthesis of biscarbazoles by palladium-catalyzed twofold C-N coupling and C-H activation reactions, Org. Biomol. Chem., 2014, 12, 2596–2605 RSC.
- S. E. Creutz, K. J. Lotito, G. C. Fu and J. C. Peters, Photoinduced Ullmann C-N coupling: demonstrating the viability of a radical pathway, Science, 2012, 338, 647–651 CrossRef CAS.
- W. Xia, Q.-J. An, S.-H. Xiang, S. Li, Y.-B. Wang and B. Tan, Chiral Phosphoric Acid Catalyzed Atroposelective C-H Amination of Arenes, Angew. Chem., 2020, 132, 6841–6845 CrossRef.
- S. Bertelsen and K. A. Jorgensen, Organocatalysis—after the gold rush, Chem. Soc. Rev., 2009, 38, 2178–2189 RSC.
- A. Dondoni and A. Massi, Asymmetric organocatalysis: from infancy to adolescence, Angew. Chem., Int. Ed., 2008, 47, 4638–4660 CrossRef CAS.
- A. G. Doyle and E. N. Jacobsen, Small-molecule H-bond donors in asymmetric catalysis, Chem. Rev., 2007, 107, 5713–5743 CrossRef CAS.
- D. W. C. MacMillan, The advent and development of organocatalysis, Nature, 2008, 455, 304–308 CrossRef CAS.
- P. M. Pihko, Hydrogen Bonding in Organic Synthesis. WILEY-VCH Verlag GmbH & Co. KGaA, Weinheim, 2009 Search PubMed.
- Z.-L. Xia, Q.-F. Xu-Xu, C. Zheng and S.-L. You, Chiral phosphoric acid-catalyzed asymmetric dearomatization reactions, Chem. Soc. Rev., 2020, 49, 286–300 RSC.
- Y.-C. Zhang, F. Jiang and F. Shi, Organocatalytic asymmetric synthesis of indole-based chiral heterocycles: strategies, reactions, and outreach, Acc. Chem. Res., 2020, 53, 425–446 CrossRef CAS.
- D. Parmar, E. Sugiono, S. Raja and M. Rueping, Complete field guide to asymmetric BINOL-phosphate derived Brønsted acid and metal catalysis: history and classification by mode of activation; Brønsted Acidity, Hydrogen Bonding, Ion Pairing, and Metal Phosphates, Chem. Rev., 2014, 114, 9047–9153 CrossRef CAS.
- L.-W. Qi, S. Li, S.-H. Xiang, J. Wang and B. Tan, Asymmetric construction of atropisomeric biaryls via a redox neutral cross-coupling strategy, Nat. Catal., 2019, 2, 314–323 CrossRef CAS.
- L.-W. Qi, J.-H. Mao, J. Zhang and B. Tan, Organocatalytic asymmetric arylation of indoles enabled by azo groups, Nat. Chem., 2018, 10, 58–64 CrossRef CAS.
- J. Li, S. Grosslight, S. J. Miller, M. S. Sigman and F. D. Toste, Site-Selective Acylation of Natural Products with BINOL-Derived Phosphoric Acids, ACS Catal., 2019, 9, 9794–9799 CrossRef CAS.
- Y.-P. Li, Z.-Q. Li, B. Zhou, M.-L. Li, X.-S. Xue, S.-F. Zhu and Q.-L. Zhou, Chiral Spiro Phosphoric Acid-Catalyzed Friedel-Crafts Conjugate Addition/Enantioselective Protonation Reactions, ACS Catal., 2019, 9, 6522–6529 CrossRef CAS.
- P. A. Champagne and K. N. Houk, Origins of selectivity and general model for chiral phosphoric acid-catalyzed oxetane desymmetrizations, J. Am. Chem. Soc., 2016, 138, 12356–12359 CrossRef CAS.
- M. E. Diener, A. J. Metrano, S. Kusano and S. J. Miller, Enantioselective Synthesis of 3-Arylquinazolin-4(3H)-ones via Peptide-Catalyzed Atroposelective Bromination, J. Am. Chem. Soc., 2015, 137, 12369–12377 CrossRef CAS.
- M. N. Grayson, Z. Yang and K. N. Houk, Chronology of CH⋯O hydrogen bonding from molecular dynamics studies of the phosphoric acid-catalyzed allylboration of benzaldehyde, J. Am. Chem. Soc., 2017, 139, 7717–7720 CrossRef CAS.
- R. Miyaji, K. Asano and S. Matsubara, Bifunctional Organocatalysts for the Enantioselective Synthesis of Axially Chiral Isoquinoline N-Oxides, J. Am. Chem. Soc., 2015, 137, 6766–6769 CrossRef CAS.
- L. M. Overvoorde, M. N. Grayson, Y. Luo and J. M. Goodman, Mechanistic Insights into a BINOL-Derived Phosphoric Acid-Catalyzed Asymmetric Pictet-Spengler Reaction, J. Org. Chem., 2015, 80, 2634–2640 CrossRef CAS.
- L. Simon and J. M. Goodman, DFT Study on the Factors Determining the Enantioselectivity of Friedel-Crafts Reactions of Indole with N-Acyl and N-Tosylimines Catalyzed by BINOL-Phosphoric Acid Derivatives, J. Org. Chem., 2010, 75, 589–597 CrossRef CAS.
- K. Lu, X. Feng, C.-X. Yan, F.-L. Yang, X. Yang, P.-P. Zhou and Z. Yang, Chiral phosphoric acid catalyzed asymmetric arylation of indoles via nucleophilic aromatic substitution: mechanisms and origin of enantioselectivity, Catal. Sci. Technol., 2020, 10, 2277–2292 RSC.
- Y. Zhao and D. G. Truhlar, The M06 suite of density functionals for main group thermochemistry, thermochemical kinetics, noncovalent interactions, excited states, and transition elements: two new functionals and systematic testing of four M06-class functionals and 12 other functionals, Theor. Chem. Acc., 2008, 120, 215–241 Search PubMed.
- M. J. Frisch, G. W. Trucks, H. B. Schlegel, G. E. Scuseria, M. A. Robb, J. R. Cheeseman, G. Scalmani, V. Barone, B. Mennucci, G. A. Petersson, H. Nakatsuji, M. Caricato, X. Li, H. P. Hratchian, A. F. Izmaylov, J. Bloino, G. Zheng, J. L. Sonnenberg, M. Hada, M. Ehara, K. Toyota, R. Fukuda, J. Hasegawa, M. Ishida, T. Nakajima, Y. Honda, O. Kitao, H. Nakai, T. Vreven, J. J. A. Montgomery, J. E. Peralta, F. Ogliaro, M. Bearpark, J. J. Heyd, E. Brothers, K. N. Kudin, V. N. Staroverov, T. Keith, R. Kobayashi, J. Normand, K. Raghavachari, A. Rendell, J. C. Burant, S. S. Iyengar, J. Tomasi, M. Cossi, N. Rega, J. M. Millam, M. Klene, J. E. Knox, J. B. Cross, V. Bakken, C. Adamo, J. Jaramillo, R. Gomperts, R. E. Stratmann, O. Yazyev, A. J. Austin, R. Cammi, C. Pomelli, J. W. Ochterski, R. L. Martin, K. Morokuma, V. G. Zakrzewski, G. A. Voth, P. Salvador, J. J. Dannenberg, S. Dapprich, A. D. Daniels, O. Farkas, J. B. Foresman, J. V. Ortiz, J. Cioslowski and D. J. Fox, D. J. Gaussian 09, Revision D.01, Gaussian, Inc., Wallingford, CT, 2013 Search PubMed.
- A. V. Marenich, C. J. Cramer and D. G. Truhlar, Performance of SM6, SM8, and SMD on the SAMPL1 Test Set for the Prediction of Small-Molecule Solvation Free Energies, J. Phys. Chem. B, 2009, 113, 4538–4543 CrossRef CAS.
- K. Fukui, The Path of Chemical Reactions-The IRC Approach, Acc. Chem. Res., 1981, 14(12), 363–368 CrossRef CAS.
- C. Gonzalez and B. Schlegel, An improved algorithm for reaction path following, J. Chem. Phys., 1989, 90, 2154–2161 CrossRef CAS.
- A. Armstrong, R. A. Boto, P. Dingwall, J. Contreras-Garcia, M. J. Harvey, N. J. Mason and H. S. Rzepa, The Houk-List transition states for organocatalytic mechanisms revisited, Chem. Sci., 2014, 5, 2057–2071 RSC.
- R. Dennington, T. Keith and J. Millam, GaussView Version 5, Semichem Inc., Shawnee Mission, KS, 2009 Search PubMed.
- C. Y. Legault, CYLview, version 1.0b, Universite de Sherbrooke, http://www.cylview.org/, 2009 Search PubMed.
- P. Geerlings, F. D. Proft and W. Langenaeker, Conceptual Density Functional Theory, Chem. Rev., 2003, 103, 1793 CrossRef CAS.
- S. B. Liu, Conceptual Density Functional Theory and Some Recent Developments, Acta Phys.-Chim. Sin., 2009, 25, 590–600 CAS.
- C. D. D. Rosa, P. M. E. Mancini, M. N. Kneeteman, A. F. L. Baena, M. A. Suligoy and L. R. Domingo, Polar Diels-Alder reactions using electrophilic nitrobenzothiophenes. A combined experimental and DFT study, J. Mol. Struct., 2015, 1079, 47–53 CrossRef.
- L. R. Domingo and P. Perez, Global and local reactivity indices for electrophilic/nucleophilic free radicals, Org. Biomol. Chem., 2013, 11, 4350–4358 RSC.
- L. R. Domingo, P. Perez and J. A. Saez, Understanding the local reactivity in polar organic reactions through electrophilic and nucleophilic Parr functions, RSC Adv., 2013, 3, 1486–1494 RSC.
- L. R. Domingo, J. A. Saez, R. J. Zaragoza and M. Arno, Understanding the participation of quadricyclane as nucleophile in polar [2σ + 2σ + 2π] cycloadditions toward electrophilic π molecules, J. Org. Chem., 2008, 73, 8791–8799 CrossRef CAS.
- C.-X. Yan, F. Yang, X. Yang, D.-G. Zhou and P.-P. Zhou, Insights into the Diels-Alder Reaction between 3-Vinylindoles and Methyleneindolinone without and with the Assistance of Hydrogen-Bonding Catalyst Bisthiourea: Mechanism, Origin of Stereoselectivity, and Role of Catalyst, J. Org. Chem., 2017, 82, 3046–3061 CrossRef CAS.
- L. J. Sham and W. Kohn, One-particle properties of an inhomogeneous interacting electron gas, Phys. Rev., 1966, 145, 561–567 CrossRef CAS.
- P. W. Ayers and M. Levy, Perspective on ‘Density Functional Approach to the Frontier-Electron Theory of Chemical Reactivity’, Theor. Chem. Acc., 2000, 103, 353 Search PubMed.
- R. G. Parr and W. Yang, Density Functional Approach to the Frontier-Electron Theory of. Chemical Reactivity, J. Am. Chem. Soc., 1984, 106, 4049–4050 CrossRef CAS.
- C.-X. Yan, F. Yang, R.-Z. Wu, D.-G. Zhou, X. Yang and P.-P. Zhou, Application of natural orbital Fukui functions and bonding reactivity descriptor in understanding bond formation mechanisms underlying [2 + 4] and [4 + 2] cycloadditions of o-thioquinones with 1, 3-dienes, Acta Phys.-Chim. Sin., 2018, 34, 497–502 CAS.
- W. Yang and R. G. Parr, Hardness, softness, and the fukui function in the electronic theory of metals and catalysis, Proc. Natl. Acad. Sci. U. S. A., 1985, 82, 6723–6726 CrossRef CAS.
- P.-P. Zhou, S. Liu, P. W. Ayers and R.-Q. Zhang, Bonding reactivity descriptor from conceptual density functional theory and its applications to elucidate bonding formation, J. Chem. Phys., 2017, 147, 134303 CrossRef.
- R. K. Roy, K. Hirao, S. Krishnamurty and S. Pal, Mulliken population analysis based evaluation of condensed Fukui function indices using fractional molecular charge, J. Chem. Phys., 2001, 115, 2901 CrossRef.
- R. K. Roy, K. Hirao and S. Pal, On non-negativity of Fukui function indices. II, J. Chem. Phys., 2000, 113, 1372 CrossRef.
- R. K. Roy, S. Pal and K. Hirao, On non-negativity of Fukui function indices, J. Chem. Phys., 1999, 110, 8236 CrossRef CAS.
- P. Bultnick and R. Carbó-Dorca, Negative and infinite Fukui functions: the role of diagonal dominance in the hardness matrix, J. Math. Chem., 2003, 34, 67 CrossRef.
- P. Bultnick, R. Carbó-Dorca and W. Langenaeker, Negative Fukui functions: New insights based on electronegativity equalization, J. Chem. Phys., 2003, 118, 4349 CrossRef.
- P. Zhou, P. W. Ayers, S. Liu and T. Li, Natural orbital Fukui function and application in understanding cycloaddition reaction mechanisms, Phys. Chem. Chem. Phys., 2012, 14, 9890–9896 RSC.
- R. F. W. Bader, Atoms in Molecules, Acc. Chem. Res., 1985, 18, 9–15 CrossRef CAS.
- R. F. W. Bader, Atoms in Molecules: A Quantum Theory, Oxford University Press, Oxford, UK, 1990 Search PubMed.
- R. F. W. Bader, A Quantum Theory of Molecular Structure and Its Applications, Chem. Rev., 1991, 91, 893–928 CrossRef CAS.
- Z. Czyznikowska, R. W. Gora, R. Zalesny, P. Lipkowski, K. N. Jarzembska, P. M. Dominiak and J. Leszczynski, Structural Variability and the Nature of Intermolecular Interactions in Watson-Crick B-DNA Base Pairs, J. Phys. Chem. B, 2010, 114, 9629–9644 CrossRef CAS.
- Y. Qiao, W. Yang, D. Wei and J. Chang, Theoretical investigations toward TMEDA-catalyzed [2 + 4] annulation of allenoate with 1-aza-1,3-diene: mechanism, regioselectivity, and role of the catalyst, RSC Adv., 2016, 6, 70723–70731 RSC.
- Y. Wang, M. Tang, Y. Wang and D. Wei, Insights into Stereoselective Aminomethylation Reaction of α,β-Unsaturated Aldehyde with N,O-Acetal via N-Heterocyclic Carbene and Brønsted Acid/Base Cooperative Organocatalysis, J. Org. Chem., 2016, 81, 5370–5380 CrossRef CAS.
- Y. Wang, D. Wei, Y. Wang, W. Zhang and M. Tang, N-Heterocyclic Carbene (NHC)-Catalyzed sp3β-C-H Activation of Saturated Carbonyl Compounds: Mechanism, Role of NHC, and Origin of Stereoselectivity, ACS Catal., 2016, 6, 279–289 CrossRef CAS.
- Y. Wang, B. Wu, L. Zheng, D. Wei and M. Tang, DFT perspective toward [3 + 2] annulation reaction of enals with α-ketoamides through NHC and Brønsted acid cooperative catalysis: mechanism, stereoselectivity, and role of NHC, Org. Chem. Front., 2016, 3, 190–203 RSC.
- C.-X. Yan, P.-P. Zhou, F.-L. Yang, R.-Z. Wu, X. Yang, F. Yang and X. Shao, Chiral bisoxazoline catalyzed decarboxylative aldol reactions between β-carbonyl acids and trifluoroacetaldehyde hemiacetals as well as trifluoroacetaldehyde: the mechanism, the origin of enantioselectivity and the role of a catalyst, Org. Chem. Front., 2018, 5, 2692–2709 RSC.
- L. Zheng, M. Tang, Y. Wang, X. Guo, D. Wei and Y. Qiao, A DFT study on PBu3-catalyzed intramolecular cyclizations of N-allylic substituted α-amino nitriles for the formation of functionalized pyrrolidines: mechanisms, selectivities, and the role of catalysts, Org. Biomol. Chem., 2016, 14, 3130–3141 RSC.
- P.-P. Zhou and W.-Y. Qiu, Red-shifted hydrogen bonds and blue-shifted van der Waals contact in the standard Watson-Crick adenine-thymine base pair, J. Phys. Chem. A, 2009, 113, 10306–10320 CrossRef CAS.
- P.-P. Zhou and W.-Y. Qiu, Red- and Blue-Shifted Hydrogen Bonds in the Cis-Trans Noncyclic Formic Acid Dimer, ChemPhysChem, 2009, 10, 1847–1858 CrossRef CAS.
- A. E. Reed, R. B. Weinstock and F. Weinhold, Natural population analysis, J. Chem. Phys., 1985, 83, 735–746 CrossRef CAS.
- A. E. Reed, L. A. Curtiss and F. Weinhold, Intermolecular interactions from a natural bond orbital, donor-acceptor viewpoint, Chem. Rev., 1988, 88, 899–926 CrossRef CAS.
- T. Lu and F. Chen, Multiwfn: A Multifunctional Wavefunction Analyzer, J. Comput. Chem., 2012, 33, 580–592 CrossRef CAS.
- L. Zhang, B. Wu, Z. Chen, J. Hu, X. Zeng and G. Zhong, Chiral phosphoric acid catalyzed enantioselective N-alkylation of indoles with in situ generated cyclic N-acyl ketimines, Chem. Commun., 2018, 54, 9230–9233 RSC.
- J. Zhang, P. Yu, S.-Y. Li, H. Sun, S.-H. Xiang, J. Wang, K. N. Houk and B. Tan, Asymmetric phosphoric acid–catalyzed four-component Ugi reaction, Science, 2018, 361, eaas8707 CrossRef.
- L. Zhang, J. Zhang, J. Ma, D.-J. Cheng and B. Tan, Highly atroposelective synthesis of arylpyrroles by catalytic asymmetric Paal-Knorr reaction, J. Am. Chem. Soc., 2017, 139, 1714–1717 CrossRef CAS.
- J. Zhang, Y.-Y. Wang, H. Sun, S.-Y. Li, S.-H. Xiang and B. Tan, Enantioselective three-component Ugi reaction catalyzed by chiral phosphoric acid, Sci. China: Chem., 2020, 63, 47–54 CrossRef CAS.
- Y.-H. Chen, D.-J. Cheng, J. Zhang, Y. Wang, X.-Y. Liu and B. Tan, Atroposelective synthesis of axially chiral biaryldiols via organocatalytic arylation of 2-naphthols, J. Am. Chem. Soc., 2015, 137, 15062–15065 CrossRef CAS.
- L. Zhang, S.-H. Xiang, J. Wang, J. Xiao, J.-Q. Wang and B. Tan, Phosphoric acid-catalyzed atroposelective construction of axially chiral arylpyrroles, Nat. Commun., 2019, 10, 566 CrossRef.
- Y. Zhu, W. He, W. Wang, C. E. Pitsch, X. Wang and X. Wang, Enantioselective Tandem Cyclization of Alkyne-Tethered Indoles Using Cooperative Silver(I)/Chiral Phosphoric Acid Catalysis, Angew. Chem., 2017, 129, 12374–12377 CrossRef.
- J. Zhang, S.-X. Lin, D.-J. Cheng, X.-Y. Liu and B. Tan, Phosphoric acid-catalyzed asymmetric classic passerini reaction, J. Am. Chem. Soc., 2015, 137, 14039–14042 CrossRef CAS.
- J. T. M. Correia, B. List and F. Coelho, Catalytic Asymmetric Conjugate Addition of Indolizines to α, β-Unsaturated Ketones, Angew. Chem., Int. Ed., 2017, 56, 7967–7970 CrossRef CAS.
- Y. Wang, L. Jiang, L. Li, J. Dai, D. Xiong and Z. Shao, An Arylation Strategy to Propargylamines: Catalytic Asymmetric Friedel–Crafts–type Arylation Reactions of C–Alkynyl Imines, Angew. Chem., Int. Ed., 2016, 55, 15142–15146 CrossRef CAS.
- H.-H. Zhang, C.-S. Wang, C. Li, G.-J. Mei, Y. Li and F. Shi, Design and Enantioselective Construction of Axially Chiral Naphthyl–Indole Skeletons, Angew. Chem., Int. Ed., 2017, 56, 116–121 CrossRef CAS.
- M. Chen and J. Sun, Catalytic Asymmetric N-Alkylation of Indoles and Carbazoles through 1,6-Conjugate Addition of Aza-para-quinone Methides, Angew. Chem., Int. Ed., 2017, 56, 4583–4587 CrossRef CAS.
- W. Zhao, Z. Wang, B. Chu and J. Sun, Enantioselective Formation of All–Carbon Quaternary Stereocenters from Indoles and Tertiary Alcohols Bearing A Directing Group, Angew. Chem., Int. Ed., 2015, 54, 1910–1913 CrossRef CAS.
- M. Chen, Y. Han, D. Ma, Y. Wang, Z. Lai and J. Sun, Organocatalytic Enantioselective Synthesis of Chiral Diarylmethylamines from Racemic Alcohols, Chin. J. Chem., 2018, 36, 587–593 CrossRef CAS.
Footnote |
| † Electronic supplementary information (ESI) available: The optimized geometries of the dimeric complexes in paths I–IV, and their relative Gibbs free energies and intermolecular interaction energies; QTAIM analyses and for the complexes, transition states and intermediates; the mechanisms of paths III and IV for the enantioselective (S)-C6 catalyzed atroposelective C–H amination reaction; and Cartesian coordinates. See DOI: 10.1039/d0qo01160f |
| This journal is © the Partner Organisations 2021 |


