 Open Access Article
CaCO3 blowing agent mixing method for biomass composites improved buffer packaging performance
Kai-qiang Sunab,
Fang-yi Li *ab,
Jian-yong Li*ab,
Jian-feng Liab,
Chuan-wei Zhangab,
Mao-cheng Jiab and
Zi-yu Guoab
aKey Laboratory of High Efficiency and Clean Mechanical Manufacture, Ministry of Education, School of Mechanical Engineering, Shandong University, Jinan 250061, China. E-mail: lifangyi@sdu.edu.cn
bNational Demonstration Center for Experimental Mechanical Engineering Education, Shandong University, Jinan 250061, China
First published on 11th January 2021
Abstract
Biodegradable composites with an open-cell structure were developed to replace petroleum-based buffer packaging materials. To overcome the problem of uneven and insufficient foam in the composites, CaCO3 was used as a nucleating agent to prepare porous composites. At 5 wt% CaCO3, more uniform and dense composite cells with better cushioning performance were obtained. A further increase in the CaCO3 content caused the density of the cells and the cushioning properties of the composites to decrease. The addition of CaCO3 improved the thermal stability and water barrier properties. The moisture absorption was reduced by 15%. X-ray diffraction analysis indicated that the addition of CaCO3 destroyed the crystalline structure of the starch and produced a new crystalline peak, resulting in a significant reduction in the crystallinity. The decrease in the crystallinity of the starch resulted in the formation of a homogeneous slurry that produced a uniform foam in the composites.
1. Introduction
Petroleum-based materials are widely used as packaging materials due to their low cost, good mechanical properties, and resistance to water. However, these materials are non-biodegradable, and they cause huge environmental problems due to their accumulation.1 Several researchers have investigated natural renewable resources to replace petroleum-based materials.2 The alternative materials include biodegradable composites based on plant fibers,3 starch,4 chitosan,5 and polylactic acid (PLA).6 Starch and plant fiber are the most researched because of their low cost and complete biodegradability.3,4 For example, Li et al. used plant fiber and starch as the skeleton and matrix, respectively, to prepare a new class of biomass materials with fully open-cell structures to replace package cushioning materials through a foaming process.7–17 As a result of their open-cell structure, acoustic absorption, insulation, and cushioning property, cellular composites could be used in different applications, including transport, packaging, and in-door decorations.18 However, the mechanical properties, thermal stability, and hygroscopic property requirements for buffer packaging were difficult to meet by these composites.Zhang proposed a new modification method of plant fiber, that is, hydrogen peroxide–urea modified plant fiber at low temperature, to prepare hydrogen peroxide–urea modified plant fiber (OUF), in order to improve the compatibility of plant fiber and starch.14 He also prepared thermoplastic oxidized starch (TPOS) by composite modification method of oxidation and plasticization to improve the mechanical properties of materials.13 Wang et al. used formamide/urea as a plasticizer to improve the mechanical properties of the composite materials. They found that the mass ratio of starch/formamide/urea that achieved the best mechanical properties was 10/2/1. They also studied the impact of different fibers on the mechanical properties and found that sisal fiber is the best plant fiber for reinforcing the composites.7 Chen subjected starch to single/compound modification using plasticization, oxidation, and esterification to break its internal hydrogen bond, the results showed that the oxidized esterified starch-based composite (OESC) exhibited the best toughness compared with a native starch-based composite.10 M. F. Ashby's research showed that the mechanical properties of porous materials mainly depend on their cellular structure.19
Chemical foaming agents and their combined materials (FC) have a huge impact on the formation of cells during the foaming process.12 Therefore, the mechanical properties could be improved by changing FC. CaCO3, which is a low-cost inorganic compound abundantly found in nature, has been used as a nucleating agent in polyethylene, polypropylene to prepare foamed materials.20,21 However, nucleating agents used as petroleum-based materials were mostly, it is more used as filler to improve the materials performance when biomass foam materials were applied. Among the many natural polymer materials, starch was proven to combine well with CaCO3.21 So it is feasible to mix it with starch containing foaming agent.
In addition, thermal stability was a significant concern for biomass composites and was also an important index to evaluate the application environment of buffer packaging materials. Cui et al. added magnesium hydroxide (MH) to the material to improve the thermal stability, they found that the thermal stability of the composite material increased with the MH content, and the maximum reduction in thermal decomposition rate was obtained at 15% MH.11 Other researchers also studied methods to improve the thermal stability of starch, e.g., Zhang, who added nano-crystalline cellulose,22 and R. Lin, who studied the crosslinking of tetraethylene glycol diacrylate with starch under nitrogen atmosphere.23
A disadvantage of the starch-based composites is that the strong moisture absorption of starch-based materials leads to poor mechanical properties due to excessive water absorption. Wilpiszewska, K. et al. reduced water absorption by adding citric acid to starch-based biomass materials. And when the CA content was 45%, the material had the lowest hygroscopicity.24 Another way to reduce water absorption is to improve the surface water resistance of the material. The surface water contact angle is an important index to evaluate the water resistance of the material surface. In order to reduce moisture absorption, scientists were modified using ZnO,25 poly(vinyl alcohol),26 and acylation/esterification27 to improve their water barrier properties, but these modification methods reduced the degradation rate of biomass materials. The mixing of CaCO3 and starch has been confirmed to have no related problems. Sun et al. investigated the addition of poly-methyltriethoxysilane (PTS) to these composites and found that increasing PTS resulted in an increase followed by a decrease in the water absorption of the composite material. The lowest water absorption rate of the composite was that obtained at a 15 g added amount of PTS (PTS-15).9 Compared with PTS, CaCO3 is less expensive and more promising.
If the mixture of calcium carbonate and foaming agent is used as a binder, it can improve the performance of molded foaming materials when used as cushioning packaging materials. The effect of CaCO3 content on various properties, such as mechanical, thermal, and moisture absorption, was studied. These were investigated through mechanical testing, thermogravimetric analysis, constant temperature, and humidity test experiments. The microstructure changes were characterized using Fourier-transform infrared spectroscopy (FTIR), scanning electron microscope (SEM), X-ray powder diffraction (XRD) microscope.
2. Materials and methods
2.1 Materials
The amylose content of cornstarch is about 26.2%, determined using dual-wavelength spectrophotometry method, which was purchased from Hebei Huachen Starch Sugar Co., Ltd. (Hebei, China). Sisal fiber, with an average length of 5 mm and an average diameter close to 60 μm, determined using optic microscopy, was prepared in our laboratory. CaCO3, whose average diameter was 70 microns, was purchased from Boke International Trade Co. Ltd. (Jinan, China). Glycerol and ethylene glycol (99% purity), which were used as plasticizing agent, were purchased from Tianjin Fuyu Fine Chemical Co., Ltd. (Tianjin, China). Talc powder (400 mesh) was purchased from Tianjin Fuyu Fine Chemical Co., Ltd., and used as a filler to improve the mechanical properties of the composites. The foaming agent azodicarbonamide (AC) was purchased from Jinan Xinweiye Co., Ltd. Other reagents used were NaOH and distilled water was purchased from Yantai Shuangshuang Chemical Co. Ltd. Absolute ethyl alcohol was purchased from Boke International Trade Co. Ltd. (Jinan, China).2.2 Preparation of biodegradable packing composites
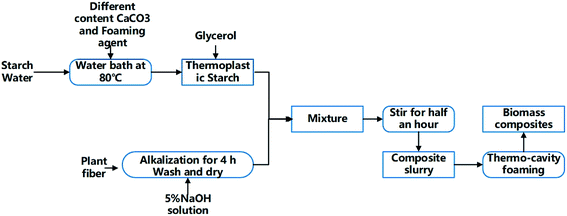
Table 1 shows the components of the starch/plant fiber composites. The preparation process was divided into four stages: preparation of thermoplastic starch (TPS), fiber pretreatment, slurry mixing, and hot pressing and foaming (Fig. 1).| Composites component | TPS | Sisal fiber | Talcum powder | AC | CaCO3 |
| Mass | 50 g | 20 g | 20 g | 2 g | 0.5%, 10%, 15% |
(1) Preparation of TPS containing CaCO3 and foaming agent: TPS was prepared by the procedure reported in the litrature.7 Cornstarch was proportionally mixed with water and gelatinized in a water bath at 80 °C. Different contents of CaCO3 (0%, 5%, 10%, and 15%) were added. During churning, the starch was added with a plasticizer containing a glycerol–glycol mixture at the optimal plasticizing mass ratio (starch/glycerol/glycol = 10/2/1). Then add the foaming agent 2 g separately.
(2) Fiber pretreatment: the fibers were soaked in a sodium hydroxide solution (5%) for 30 min. They were then removed from the solution, washed 3 to 5 times in deionized water, and left to dry naturally.
(3) Slurry mixing: the TPS and treated fibers were placed in the churning machine and subjected to a 15 min churning. The slurry and talcum powder were mixed until a homogeneous phase was reached.
(4) Hot pressing and foaming: the mold temperature was set to 200–210 °C, and the pressure was fixed at 3.5–5 MPa. The composite slurry obtained at the homogeneous phase was placed into the mold and baked for 10 min to obtain a biodegradable packing composite. These composites with 0, 5%, 10% and 15% CaCO3 added are denoted as TF/TF + 5% CaCO3/TF + 10% CaCO3/TF + 15% CaCO3.
2.3 Compression and bending testing
The compressive stress was calculated as follows:
where ε is the compression strain, %; X is the displacement of the press plate, mm; and T is the original thickness of the test sample, mm. Finally, the energy absorption efficiency was calculated as follows:
where E is the energy absorption efficiency corresponding to a strain ε and σ(ε) is the stress corresponding to a strain ε.
2.4 Thermal properties (TGA)
To investigate the effect of different CaCO3 contents on the thermal stability of starch/plant fiber composites, the composites were analyzed using hermogravimetric analysis (TGA-Q500, TA Instruments, New Castle, DE, USA). The heating rate was set to 10 °C min−1 within a temperature range of 30–600 °C.2.5 Hydrophilic testing
(1) Moisture absorption test:The moisture absorption was determined using the gravimetric method. The samples were dried and weighed to obtain their initial mass (M0). Then they were placed in a humidity box at constant temperature of 25 °C and humidity of 50% RH, 60% RH, 70% RH, and 80% RH for 48 h. The final weight (M1) was then obtained and the moisture absorption calculation (Ma) was calculated as follows:
(2) Water contact angle test:
The sample (length × width × height = 20 mm × 20 mm × 5 mm) was horizontally placed on the experimental platform of the contact angle meter.28 The horizontal height of the sample was adjusted to the appropriate position, the knob of the dropper was turned, distilled water (50 μm) was titrated for each test, and the reading was recorded using the device software. The water contact angle was recorded at the initial stages (i.e., after 2 min, 4 min, 6 min, and 8 min). The test was repeated three times for each sample and the results were averaged.
2.6 SEM
The internal structure of the fracture surface of the TF/TF + 5% CaCO3/TF + 10% CaCO3/TF + 15% CaCO3 were investigated using a scanning electron microscope (FEG250) with an accelerating voltage of 10 kV. Prior to the SEM observation, all samples were mounted on aluminium stubs with ribbons and sputter coated with gold to make them electrically conductive.2.7 Porosity testing
The porosity of the fabricated bio-composites was analyzed as per the reported procedure.29 Initially, the bio-composites were submerged in alcohol. The weight of the sponges before and after submersion in calculated. The porosity was calculated by the following formula,| % = (X2 − X1)/ρV1 |
2.8 Measurement of rheological properties with a digital rotational viscometer
A digital rotational viscometer (type: DV-79 + pro) was used in this test. F type rotor was chosen as test rotor. The speed was set at 150 r/s. The digital rotational viscometer was equipped with a hydraulic pump for controlling the temperature of the water bath. The viscometer could be programmed for rheological measurement. The viscometer was preheated to 45 °C and left idle for 6 seconds to obtain stable data. Samples were placed into the test tube and the rotor was turned on to reduce experimental error. Each measurement was repeated 10 times and the average value was taken as the final value. The time interval of each data was 6 seconds and the program was repeated five times. After data collection, the rheological characteristic curve was drawn after deleting unreliable data points.3. Results and discussion
3.1 Mechanical property analysis
Fig. 2(a) shows the stress–strain diagram based on the compression test results of composites. Table 2 shows the compression yield strength and the stress of composites at an 80% strain (σ(80%)). The point marked in Fig. 2 is that when the composites start to yield. The results indicated that CaCO3 improved the compression yield strength and of the composites. At a CaCO3 of 5%, the compression yield strength of the composites reached its maximum (3.2 MPa), which increased indicates a 156% increase. However, further increasing the CaCO3 content caused a decrease in the compression yield strength of the composites. σ(80%) followed the same pattern.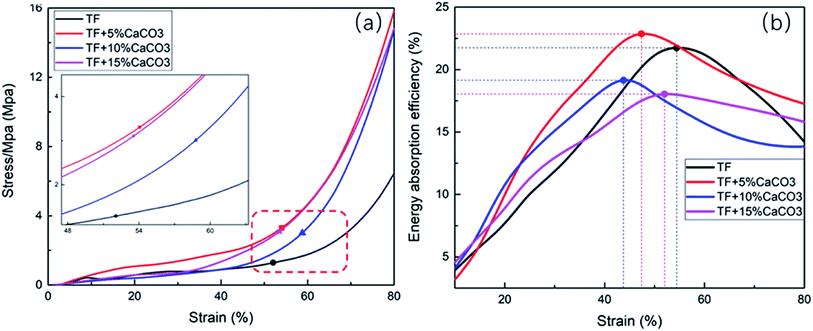 | ||
| Fig. 2 Compression test (a) stress–strain curve, (b) energy buffer coefficient–strain curve of TF/TF + 5% CaCO3/TF + 10% CaCO3/TF + 15% CaCO3. | ||
| Composites | TF | TF + 5% CaCO3 | TF + 10% CaCO3 | TF + 15% CaCO3 |
| Yield strength (MPa) | 1.25 | 3.21 | 3.09 | 3.10 |
| Emax (%) | 21.9 | 22.8 | 19.1 | 18.2 |
| σ(80%) (MPa) | 6.19 | 16.15 | 15.09 | 15.12 |
| Elasticity modulus (MPa) | 2035 | 2669 | 2623 | 1699 |
| R (MPa) | 22.42 | 22.61 | 27.82 | 33.31 |
| Viscosity (mPa s−1) | 7318 | 7350 | 7377 | 7405 |
| Porosity (%) | 62.35 | 77.63 | 60.59 | 55.74 |
The energy absorption efficiency–strain curve was drawn based on E calculated during the compression of the composites (Fig. 2(b)). The buffering performance of the composites was generally expressed by their E. The buffering performance of the composites was found to improve with the increase in E.30 The maximum value of E (Emax) is given in Table 2. Fig. 3 showed that adding CaCO3 (5%) improved the cushioning property of the composites as the energy absorption efficiency was 22.8%, which reflects a 4.2% increase. However, a further increase in the CaCO3 content results in a decrease in E and in the cushioning property of the composites.
The test results of the bending experiment on the material are shown in Table 2. The E was the largest when 5% CaCO3 was added, which was 2669 MPa. It was 31.2% higher than TPS. When the CaCO3 content exceeds 5%, as the CaCO3 content increases, the elastic modulus of the material will gradually decrease. The elastic strength of the material gradually increases with the increase of CaCO3 content. It indicates that TPS + 5% CaCO3 has the strongest resistance to deformation.
3.2 Thermal analysis
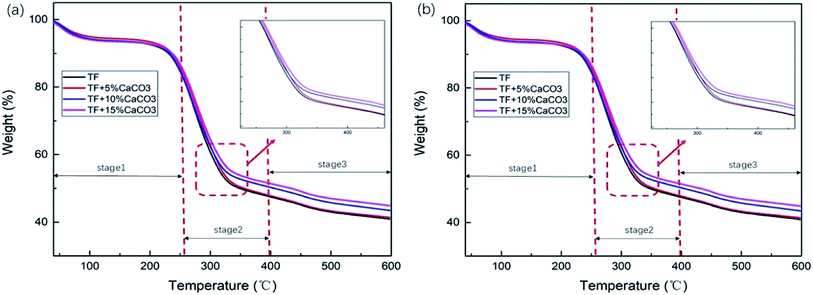
To determine the effect of the CaCO3 content on the thermal stability of the composites, thermogravimetric analysis was performed on the composite under nitrogen atmosphere. Fig. 3 showed TG and differential thermal analysis (DTG) curves of TF/TF + 5% CaCO3/TF + 10% CaCO3/TF + 15% CaCO3. The relevant data are shown in Table 3. The decomposition of the composites was divided into three stages. In stage 1 (30–270 °C), the mass loss was caused by the volatilization of water in composites and the decomposition of starch plasticizer.31 Stage 2 (270–400 °C) was the main stage in which the mass loss occurred. This was caused by the decomposition of starch and fibers and the formation of levoglucan, furan and furan derivatives, as well as other volatile substances.32 Stage 3 (400–600 °C) was the carbonization stage.11| T50% | W400 | W600 | Vmax | TVmax | |
|---|---|---|---|---|---|
| TF | 348 | 47.31 | 40.91 | −5.36 | 269.82 |
| TF + 5% CaCO3 | 351 | 47.57 | 41.16 | −5.04 | 270.00 |
| TF + 10% CaCO3 | 406 | 50.00 | 43.47 | −4.99 | 272.71 |
| TF + 15% CaCO3 | 432 | 51.41 | 44.87 | −4.87 | 277.91 |
T50% is the temperature at which 50% mass loss occurred; W400 °C and W600 °C represent the residual mass from the thermal decomposition of the composites when the temperature was 400 °C and 600 °C, respectively; Vmax is the maximum decomposition rate of composites, and TVmax is the temperature corresponding to the maximum decomposition rate of composites. Their relevant data are shown in Table 3. Increasing the CaCO3 content in the composites caused a gradual increase in T50%, W400 °C, and W600 °C, which indicated that the addition of CaCO3 at the same temperature reduced the mass loss. On the other hand, the increase in the CaCO3 content caused a gradual decrease in Vmax and TVmax. This indicated that the addition of CaCO3 effectively reduced the rate of the reduction in composite mass and increased the temperature corresponding to the maximum decomposition rate of the composites. These results prove that the addition of CaCO3 increased the thermal stability of the composites. The thermal stability of the composites gradually increased with the CaCO3 content. The addition of magnesium hydroxide caused a decrease in the composites W400 °C and W600 °C by 5.38% and 2.7%;11 while the addition of 15% CaCO3 caused them to decrease by 8.39% and 9.67%, respectively. Compared to magnesium hydroxide, CaCO3 was found to improve the thermal stability of starch–plant fiber composites.
The viscosity test results are listed in Table 1. With the increase of CaCO3 content, the paste viscosity increased. But the increase was small.
3.3 Water resistance test results
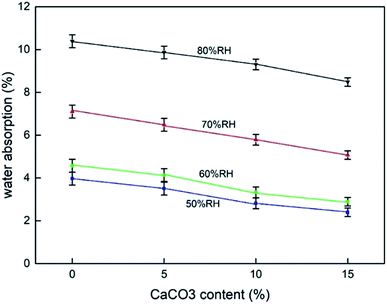
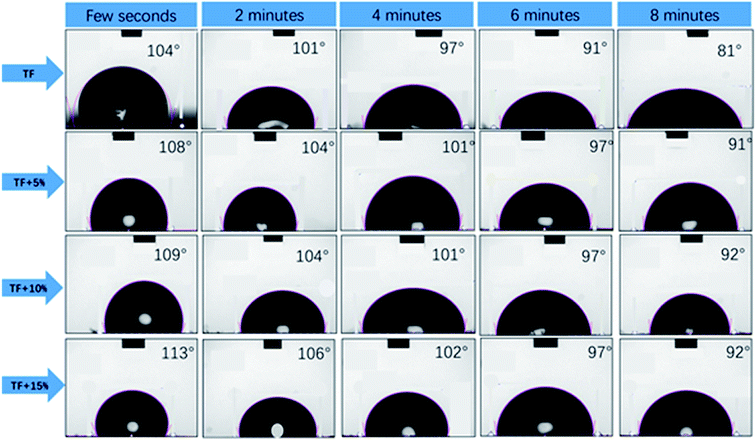
The hygroscopicity of composites in humid environment is also an important factor to evaluate buffer packaging composites. Water absorption by the biomass composites reduces their mechanical properties.33 Fig. 4 shows the results of the moisture absorption test at different CaCO3 content under different humidity conditions. The results indicated that the increase in the CaCO3 content caused a gradual decrease in the hygroscopic rate of the composites at all humidity conditions. This effect was more pronounced ar higher the humidity conditions. This proved the beneficial effect of CaCO3 on the composites to be used in buffer packaging.Fig. 5 shows the results of the water contact angle test of the composites. A larger water contact angle reflects a better waterproof property of the composites.28 The results showed that the addition of CaCO3 increased the water contact angle of the composites and slowed the water adsorption performance of the composites surface. A gradual increase in the water contact angle was observed with the increase in the CaCO3 content. This proves that the addition of CaCO3 could improve the water resistance of the composites, which is also beneficial in their application in buffer packaging.
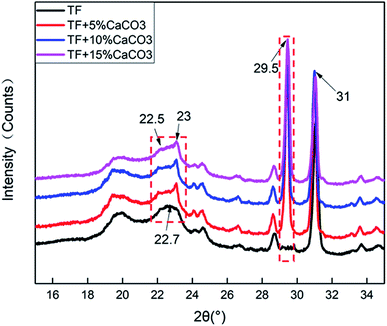
3.4 X-ray diffraction analysis
Fig. 6 shows the XRD test results of the composites. The results were analysed by JADE software attributed the peak near 22.5° to TPS. The addition of CaCO3 resulted in a new peak at 23°. It indicated that the addition of CaCO3 destroyed the crystal structure of TPS. The crystallization peak of CaCO3 was observed at 29.5°. The peak value gradually increased with the CaCO3 content. This indicated that CaCO3 was well combined with the composites.Table 4 shows the crystallinity of the composites. The addition of CaCO3 reduced the crystallinity of the composites. The crystallinity of the composites was found to increase with the CaCO3 content. At 5% CaCO3, the crystallinity of the composites decreased, because CaCO3 destroyed the lattice structure of TPS. This caused the fluidity to increase as the free starch grains in the composites increased because the starch was no longer attached to the surface of the fiber in large clumps. This also enhanced its combination with the surrounding fibers and other ingredients. This tight binding would offset a part of the gas expansion stress generated in the process of gas foaming during foam forming. The cellular structure became more compact as the cells of the composites became smaller. This tight binding also increased the compression strength and thermal stability of the composites.
| Composites | TF | TF + 5% CaCO3 | TF + 10% CaCO3 | TF + 15% CaCO3 |
| Crystallinity (%) | 92.49 | 52.37 | 60.50 | 69.37 |
3.5 Morphology of the cellular structure in the composites
Fig. 7 and 8 show the composites pore structure under white light microscope and SEM, respectively. Fig. 9 shows the fiber lap structure of the composites under SEM. As shown in Fig. 8, TF had multiple broken cells, which could be attributed to the weakness of the starch–fiber bond strength that was easily broken as a result of the expansion that occurred during the foaming process. Moreover, Fig. 9 showed that the diameter of the cells of TF was relatively large (greater than 300 μm). Fig. 10 indicated that the TF fibers were attached to a large amount of clumps of starch, which caused multiple fibers to connect together. This resulted in small cell density and inadequate cushioning property of composites. However, the cells generated by TF + 5% CaCO3 were relatively uniform, and the cells rupture hardly occurred. The resulting pores were smaller in diameter (mostly around 250 μm). Most fibers existed in a single form, which prevented the fibers from coalescing. More fibers were wrapped over more cells. This lead to the formation of high-density cells and improved the cushioning performance of the composites. However, the fewer cells in TF + 10% and TF + 15% resulted in a reduction in the foam holes in the composits with the increase of CaCO3 content because the free CaCO3 filled the cells, reducing their number. This reduced the buffering performance of the composites, which agrees with the XRD and mechanical properties test results.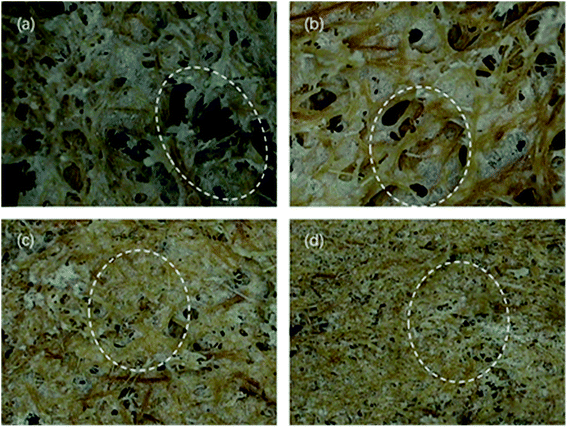 | ||
| Fig. 7 Optical profilometer test results of (a) TF, (b) TF + 5% CaCO3, (c) TF + 10% CaCO3 and (d) TF + 15% CaCO3 pore structure. | ||
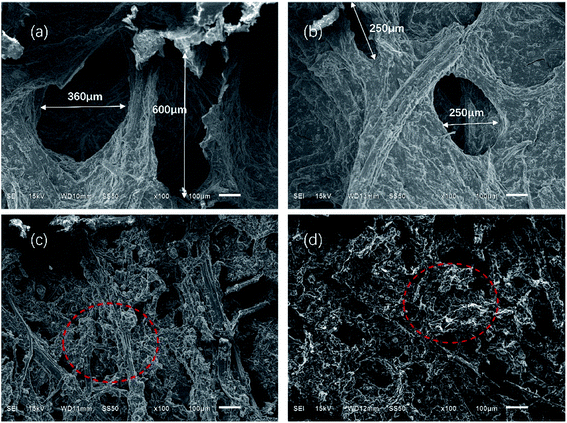 | ||
| Fig. 8 SEM results of (a) TF, (b) TF + 5% CaCO3, (c) TF + 10% CaCO3, and (d) TF + 15% CaCO3 pore structure. | ||
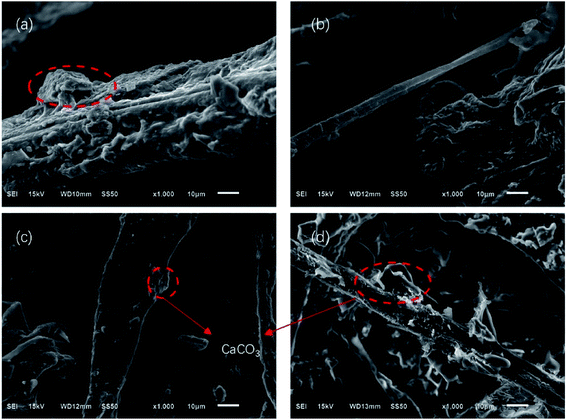 | ||
| Fig. 9 SEM results of (a) TF, (b) TF + 5% CaCO3, (c) TF + 10% CaCO3, and (d) TF + 15% CaCO3 fiber structure. | ||
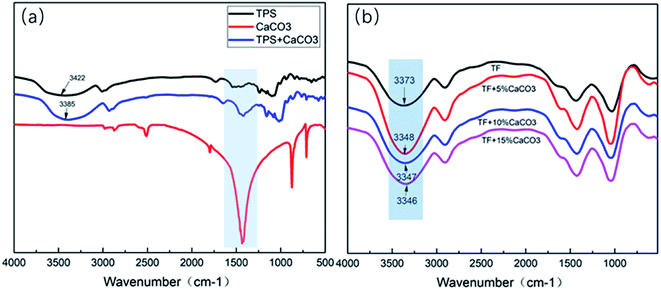 | ||
| Fig. 10 FTIR test results of (a) TPS/CaCO3/TPS + CaCO3, (b) TF/TF + 5% CaCO3/TF + 10% CaCO3/TF + 15% CaCO3. | ||
The test results of porosity are shown in Table 1. The results are the same as those shown in Fig. 7 and 8. The porosity of TPS + 5% CaCO3 reached 77.63% at the highest, which was 24.5% higher than that of TPS. When CaCO3 content exceed 5%, the porosity decreased gradually with the increase of CaCO3 content.
3.6 The infrared spectrum analysis
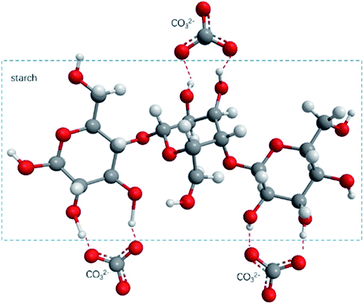
Fig. 10(a) shows the FTIR test results of TPS/CaCO3/TPS + CaCO3. The O–H stretching vibration absorption peak was observed within 3300–3600 cm−1.34 When two or more substances were mixed, the formation of hydrogen bonds changed the vibrational frequency of the hydroxyl groups.35 The low vibrational frequency of the hydroxyl groups indicated the strong hydrogen bonds in the composites.36 The O–H absorption peak of TPS was observed at 3422 cm−1 and that of TPS + CaCO3 was observed at 3389 cm−1. This indicated that TPS + CaCO3 had formed more hydrogen bonds. The addition of CaCO3 leads to the increase in the hydrogen bonds in TPS. Because of the exposure of the composites to the CO32−, which has a large number of oxygen atoms, more hydrogen bonds were formed with the O–H in starch (Fig. 11). This allowed the components of the composites to bond more closely and improved their mechanical properties and thermal stability. The reduction of O–H on the surface of composite material also reduced the affinity for water molecules, making it less hygroscopic.The FTIR test results of TF/TF + 5% CaCO3/TF + 10% CaCO3/TF + 15% CaCO3 are shown in Fig. 10(b). The O–H absorption peak of TF was observed at 3372 cm−1 and that of TPS + 5% CaCO3/TPS + 10% CaCO3/TPS + 15% CaCO3 was 3348/3347/3346 cm−1, respectively. This indicated that the addition of CaCO3 was favorable for the formation of hydrogen bonds and improved the compression strength of the composite materials. However, further increase in the CaCO3 content did not change the hydrogen bond strength of the composites, because not enough hydroxyl groups in the starch were available to form additional hydrogen bonds. Thus, the compression strength of the composites did not increase. This is in good agreement with the results of XRD, TG, and mechanical tests.
4. Conclusion
In this paper, CaCO3 was used to improve the performance of the materials. It is to combine calcium carbonate and foaming agent plasticized starch as a binder, rather than simply filling. In this way, the cell uniformity and porosity of the materials was improved. And it also improved the thermal stability of the materials, reduced the moisture absorption, and improved the mechanical properties of the cushioning packaging.The addition of CaCO3 significantly affected the cellular structure of the composite. Adding 5% CaCO3 resulted in more uniform and dense cells of the composites with better cushioning performance. When CaCO3 content was further increased, the excess CaCO3 clogged the cells of the composites. With the increase in the CaCO3 content, the density of cells decreased and the buffering property of the composites weakened.
CaCO3 greatly improved the mechanical properties of the composites. The compression yield strength of the composite was increased by 156%. In addition, the addition of CaCO3 improved the thermal stability of the composites. Increasing the CaCO3 content resulted in a gradual increase in the thermal stability of the composites. The addition of CaCO3 reduced the moisture absorption and surface water absorption of the composites. The increase in the CaCO3 content resulted in a slight improvement in the water barrier property of the composites.
The XRD test results showed that the addition of CaCO3 destroyed the original crystalline structure of the starch. It lead to a significant reduction in the crystallinity of the composite and improved the combination efficiency between the matrix and reinforcement.
Conflicts of interest
There are no conflicts to declare.Acknowledgements
This work was financially supported by National Natural Science Foundation of China (No. 52075304 ), National Natural Science Foundation of China (No. 51775318), Key Research and Development Program of Shandong Province (No. 2019GGX104015) and The Inter-disciplinary Cultivation Project of Shandong University (No. 2018JC043). We would like to thank our colleagues from Shandong University.References
- J. R. Jambeck, Q. Ji, Y.-G. Zhang, D. Liu, D. M. Grossnickle and Z.-X. Luo, Plastic waste inputs from land into the ocean, Science, 2015, 347(6223), 764–768 CrossRef.
- A. Gandini, The irruption of polymers from renewable resources on the scene of macromolecular science and technology, Green Chem., 2011, 13(5), 1061–1083 RSC.
- O. Faruk, A. K. Bledzki, H. P. Fink and M. Sain, Biocomposites reinforced with natural fibers: 2000-2010, Prog. Polym. Sci., 2012, 37(11), 1552–1596 CrossRef CAS.
- A. L. Da Róz, A. J. F. Carvalho, A. Gandini and A. A. S. Curvelo, The effect of plasticizers on thermoplastic starch compositions obtained by melt processing, Carbohydr. Polym., 2006, 63(3), 417–424 CrossRef.
- I. Younes and M. Rinaudo, Chitin and chitosan preparation from marine sources. Structure, properties and applications, Mar. Drugs, 2015, 13(3), 1133–1174 CrossRef CAS.
- D. Garlotta, A Literature Review of Poly (Lactic Acid) A Literature Review of Poly (Lactic Acid), J. Polym. Environ., 2019, 9(2), 63–84 CrossRef.
- C. Z. Wang, et al., Research on thermoplastic starch and different fiber reinforced biomass composites, RSC Adv., 2015, 5(62), 49824–49830 RSC.
- C. W. Zhang, et al., Research on rheological behavior of biobased composite slurry composed of sisal fiber and thermoplastic oxidized starch, J. Biobased Mater. Bioenergy, 2017, 11(2), 119–124 CrossRef CAS.
- X. Sun, et al., Effect of poly-methyltriethoxysilane on the waterproof property of starch/fiber composites with open cell structures, RSC Adv., 2019, 9(34), 19508–19517 RSC.
- S. Chen, et al., Effects of single-modification/cross-modification of starch on the mechanical properties of new biodegradable composites, RSC Adv., 2018, 8(22), 12400–12408 RSC.
- J. F. Cui, et al., Effects of magnesium hydroxide on the properties of starch/plant fiber composites with foam structure, RSC Adv., 2019, 9(30), 17405–17413 RSC.
- Q. Xie, et al., A new biodegradable sisal fiber–starch packing composite with nest structure, Carbohydr. Polym., 2018, 189, 56–64 CrossRef CAS.
- C. W. Zhang, et al., Novel treatments for compatibility of plant fiber and starch by forming new hydrogen bonds, J. Cleaner Prod., 2018, 185, 357–365 CrossRef CAS.
- C. W. Zhang, et al., A new biodegradable composite with open cell by combining modified starch and plant fibers, Mater. Des., 2017, 120, 222–229 CrossRef CAS.
- C. W. Zhang, F. Y. Li and J. F. Li, et al., Research on rheological behavior of biobased composite slurry somposed of sisal fiber and thermoplastic oxidized starch, J. Biobased Mater. Bioenergy, 2017 Search PubMed.
- L. Fangyi, G. Kaikai and L. Peng, et al., Ingredient of biomass packaging material and compare study on cushion properties, Int. J. Polym. Sci., 2014, 2014, 1–7 Search PubMed.
- P. Liu, F. Li and J. Li, et al., Effect of starch plasticizing/fiber processing on the mechanical properties of biomass cushion packaging composites, J. Biobased Mater. Bioenergy, 2014, 8, 214–220 CrossRef CAS.
- H. E. Naguib, C. B. Park, U. Panzer and N. Reichelt, Strategies for achieving ultra low-density polypropylene foams, Polym. Eng. Sci., 2002, 42(7), 1481–1492 CrossRef CAS.
- M. F. Ashby, Mechanical Properties of Cellular Solids, Metall. Trans. A, 1983, 14(9), 1755–1769 CrossRef.
- N. M. Barkoula, B. Alcock, N. O. Cabrera and T. Peijs, Flame-Retardancy Properties of Intumescent Ammonium Poly(Phosphate) and Mineral Filler Magnesium Hydroxide in Combination with Graphene, Polym. Polym. Compos., 2008, 16(2), 101–113 CAS.
- D. F. Loghin, C. A. Ghiorghita, O. M. M. Blegescu and M. Mihai, Composite materials based on chitosan/amidoximated starch beads and CaCO3, J. Cryst. Growth, 2020, 529, 125274 CrossRef CAS.
- C. w. Zhang, S. S. Nair, H. Chen, N. Yan, R. Farnood and F. y. Li, Thermally stable, enhanced water barrier, high strength starch bio-composite reinforced with lignin containing cellulose nanofibrils, Carbohydr. Polym., 2020, 230, 115626 CrossRef CAS.
- R. Lin, Y. Zhu and L. L. Tavlarides, Mechanism and kinetics of thermal decomposition of biodiesel fuel, Fuel, 2013, 106, 593–604 CrossRef CAS.
- K. Wilpiszewska, A. K. Antosik and M. Zdanowicz, The Effect of Citric Acid on Physicochemical Properties of Hydrophilic Carboxymethyl Starch-Based Films, J. Polym. Environ., 2019, 27(6), 1379–1387 CrossRef CAS.
- S. Ni, H. Zhang, P. M. Godwin, H. Dai and H. Xiao, ZnO nanoparticles enhanced hydrophobicity for starch film and paper, Mater. Lett., 2018, 230, 207–210 CrossRef CAS.
- Z. Guohua, L. Ya, F. Cuilan, Z. Min, Z. Caiqiong and C. Zongdao, Water resistance, mechanical properties and biodegradability of methylated-cornstarch/poly(vinyl alcohol) blend film, Polym. Degrad. Stab., 2006, 91(4), 703–711 CrossRef.
- X. Wang, L. Huang and C Zhang, et al., Research advances in chemical modifications of starch for hydrophobicity and its applications: a review, Carbohydr. Polym., 2020, 240, 116292 CrossRef CAS.
- G. McHale, N. J. Shirtcliffe and M. I. Newton, Contact-angle hysteresis on super-hydrophobic surfaces, Langmuir, 2004, 20(23), 10146–10149 CrossRef CAS.
- P. T. Sudheesh Kumar, et al., Flexible and microporous chitosan hydrogel/nano ZnO composite bandages for wound dressing: in vitro and in vivo evaluation, ACS Appl. Mater. Interfaces, 2012, 4(5), 2618–2629 CrossRef CAS.
- Z. W. Wang and X. F. Li, Effect of strain rate on cushioning properties of molded pulp products, Mater. Des., 2014, 57, 598–607 CrossRef.
- A. Ghanbari, T. Tabarsa, A. Ashori, A. Shakeri and M. Mashkour, Thermoplastic starch foamed composites reinforced with cellulose nanofibers: thermal and mechanical properties, Carbohydr. Polym., 2018, 197, 305–311 CrossRef CAS.
- M. N. Prabhakar, A. ur Rehman Shah and J. Il Song, Improved flame-retardant and tensile properties of thermoplastic starch/flax fabric green composites, Carbohydr. Polym., 2017, 168, 201–211 CrossRef CAS.
- Z. Yang, H. Peng, W. Wang and T. Liu, Crystallization behavior of poly(ε-caprolactone)/layered double hydroxide nanocomposites, J. Appl. Polym. Sci., 2010, 116(5), 2658–2667 CAS.
- X. F. Ma, J. G. Yu and J. J. Wan, Urea and ethanolamine as a mixed plasticizer for thermoplastic starch, Carbohydr. Polym., 2006, 64(2), 267–273 CrossRef CAS.
- Y. Guan, X. Liu, Y. Zhang and K. Yao, Study of phase behavior on chitosan/viscose rayon blend film, J. Appl. Polym. Sci., 1998, 67(12), 1965–1972 CrossRef CAS.
- S. W. Kuo, C. F. Huang and F. C. Chang, Study of hydrogen-bonding strength in poly(ε-caprolactone) blends by DSC and FTIR, J. Polym. Sci., Part B: Polym. Phys., 2001, 39(12), 1348–1359 CrossRef CAS.
| This journal is © The Royal Society of Chemistry 2021 |

