 Open Access Article
Combined mechanistic and genetic programming approach to modeling pilot NBR production: influence of feed compositions on rubber Mooney viscosity†
Ge He ab,
Tao Luo*a,
Yagu Danga,
Li Zhoua,
Yiyang Daia and
Xu Ji*a
aSchool of Chemical Engineering, Sichuan Univisity, Chengdu 610065, China. E-mail: jxhhpb@163.com; tao.luo@scu.edu.cn; Fax: +86-028-85405220; Tel: +86-028-85405220
bLanzhou Petrochemical of PetroChina Company Limited, Lanzhou 730060, China
First published on 4th January 2021
Abstract
Mooney viscosity is an essential parameter in quality control during the production of nitrile-butadiene rubber (NBR) by emulsion polymerization. A process model that could help understand the influence of feed compositions on the Mooney viscosity of NBR products is of vital importance for its intelligent manufacture. In this work, a process model comprised of a mechanistic model based on emulsion polymerization kinetics and a data-driven model derived from genetic programming (GP) for Mooney viscosity is developed to correlate the feed compositions (including impurities) and process conditions to Mooney viscosity of NBR products. The feed compositions are inputs of the mechanistic model to generate the number-, weight-averaged molecular weights (Mn, Mw) and branching degree (BRD) of NBR polymers. With these generated data, the GP model is used to output the optimal correlation for the Mooney viscosity of NBR. In a pilot NBR production, Mooney viscosity data of NBR predicted by the process model agree quite well with experimental values. Furthermore, the process model enables the analyses of the univariate and multivariate influence of feed compositions on NBR Mooney viscosity, and the variables include the contents of vinyl acetylene and dimer in 1,3-butadiene, as well as the mass flow rate of the chain transfer agent (CTA) in the process. Based on the results, it is recommended to control the content of vinyl acetylene in the 1,3-butadiene feed below 14 ppm and the content of dimer below 1100 ppm. This developed process model would help stabilize NBR viscosity for a better control of the product quality.
1. Introduction
Nitrile butadiene rubber (NBR) is an important raw material for the production of oil-resistant rubbery articles indispensible for the automobile, aeronautics and petroleum industries, due to its excellent oil- and air-proof, heat-resistant physicochemical properties. In industry, NBR is produced generally by a continuous cold emulsion polymerization process with two types of monomers: 1,3-butadiene (Bd) and acrylonitrile (ACN). The product NBR as a polymer has certain averaged molecular weights and its distribution, and also certain branching degrees (BRD) of polymer chains. Mooney viscosity (MV) is a standard parameter for characterizing the elastic properties of rubbery materials, and can be regarded as a measure of rubber molecular weight. It is not only widely used in the quality control of non-vulcanized rubbers,1 but also is a vital indicator meaningful for the industrial mixing or molding process of these materials. Therefore, real-time and precise detection of the product Mooney viscosity in the continuous industrial production of NBR is paramount for the quality control of product and its processability thereafter.2 However, in practice the online detection of Mooney viscosity is nowadays not possible, while standard characterization procedures with the Mooney machine in laboratory is labor-intensive and also takes time,3 a time lag exists. On the other hand, a reasonable alternative would be prediction of NBR Mooney viscosity via a reliable process model, for which direct correlation with good accuracy between the feed compositions including impurities or process conditions and the Mooney viscosity of final NBR products is therefore of both scientific and practice importance. Compared to group contribution, quantitative structure–property relationship (QSPR) models etc., the hybrid model proposed in this study is more suitable for industrial application, and is of reference value for the academic research due to the accuracy and effectiveness of the hybrid model. The developed process model is expected to facilitate the intelligent manufacture of NBR, and rubbery materials alike.There have been continuous efforts from the industry and academia devoted to modeling the emulsion polymerization process of NBR, though comprehensive and coherent understanding of this complicated process has not yet been reached. Vega et al.,4,5 Minari et al.6,7 and Penlidis et al.8–13 have reported mechanistic models for the NBR production, based on emulsion polymerization kinetics. These mechanistic models could output NBR properties like number-averaged (Mn) and weight-averaged molecular weight (Mw), however excluding Mooney viscosity. Conventional empirical correlations could relate Mn and Mw of a polymer to its (Mooney) viscosity. Such an approach that combines a mechanistic model based on polymerization kinetics and the empirical correlation for Mooney viscosity has been applied by Zubov et al. in the dynamic modeling of styrene-butadienen rubber production, to directly correlate the feed compositions and process parameters to Mooney viscosity of rubber products.14 This approach has not yet been employed in modeling the NBR production. Moreover, it is proved that the accuracy of conventional Mooney viscosity correlation is not satisfactory for industrially produced polymers, which is mostly due to ignorance of chain branching degree of polymers in the correlation.14,15 For directly investigating the influence of feed compositions and process parameters on Mooney viscosity of NBR, Scott et al.16 performed principal component analysis (PCA) for the process. Only a few data are necessary for PCA, and this method is effective in identifying determing parameters for Mooney viscosity from a large number of parameters. They found that in stationary industrial production of NBR the determing parameters of Mooney viscosity include the compositions of feed and assistant agents, especially the contents of vinyl acetylene and dimer in the monomer 1,3-butadiene.16 Though the PCA method is simple and convenient, it is not able to reflect the inherent characteristics of the emulsion polymerization process, and no process model that predicts NBR Mooney viscosity has been proposed in the report.16 Meanwhile, machine learning methods (data models) in the field of data science, including extreme learning machine,3,17 Generalized Regression Neural Networks (GRNN),18 Discounted-measurement Recursive Partial Least Squares-Gaussian Process (DRPLS-GP),19 Ensemble Deep Correntropy Kernel Regression (EDCKR)20, Gaussian Process Regression (GPR)21–23 can also be employed to build the model that correlates feed composition, process conditions and product properties, for fast and accurate prediction of Mooney viscosity. The advantages of this type of method include easy access to input data, less training time, high accuracy of model predictions and convenience to be applied. These advantages make such methods the general option for online prediction of Mooney viscosity (soft measurements) and for the control and optimization of industrial processes. Notably, the variables and process conditions in the industrial rubber production are non-linear, distributed, and fluctuating over time, and are with time-lags, these make the process very complex and intertwined. Data models are strongly dependent on the data set used for the model construction. For example, the data set might only represent some stationary conditions, in which some important variables were stable during the data collection while these variables actually shifted over even a longer period. However, incorporating more and more variables and considering even longer time period are further complicating the model. Therefore, combing machine learning methods to construct semi-mechanism models, namely hybrid models, can offer accurate predictions for diversified feed composition and process conditions. The model prediction is robust and the results are interpretable.24–26 We think, for accurately predicting Mooney viscosity of NBR produced in an industrial process, one has to combine a mechanistic model and a data-driven model for Mooney viscosity correlation. The mechanistic model is based on emulsion polymerization kinetics for simulating the number-averaged and weight-averaged molecular weight (Mn, Mw), as well as branching degree (BRD) of polymers since for the correlation of Mooney viscosity BRD shall also be integrated.
The combination of mechanistic and data-driven models is well suited for the descriptive however strongly-intertwined problems in the chemical industry. As reported in open literature,8–12 mechanistic models based on emulsion polymerization kinetics have been shown predictive for the NBR production process. Compared to mechanistic models, data-driven models can be built easier without knowing the detailed mechanisms of the process.27,28 So, the branching degree of polymers can be easily integrated into the correlation between Mooney viscosity and Mn, Mw of polymers, with a data-driven model. Genetic Programming (GP) is able to generate non-linear mapping between inputs and outputs,17,29,30 consequently it is a powerful tool to deal with the Mooney viscosity correlation of non-linear characteristics. GP has been applied successfully in the field of chemical engineering and materials science,31 like building stationary32,33 and dynamic34,35 process models, optimization of distillation sequences,36 predicting properties of inorganic materials,37–42 and building vapor–liquid equilibrium models.43 GP could search for the optimal formula and parameters simultaneously, resulting in compact and explainable representations,44 which are in turn ideal for the integration with mechanistic models.43 For the direct prediction of NBR Mooney viscosity based on feed compositions and process parameters, we propose the approach to combing sequentially a mechanistic model and a data-driven model derived from GP. First, the mechanistic model is used for describing the emulsion polymerization process of NBR, and then the data-driven model is to quantify the influence of Mn, Mw and BRD of NBR polymers on Mooney viscosity.15 Finally, the two models are integrated for the direct prediction of viscosity.
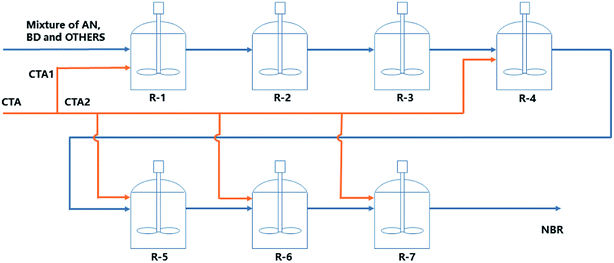
In this work, the continuous emulsion polymerization of NBR is simulated via a mechanistic model based on polymerization kinetics, with information of feed compositions, process parameters and experimental data of products from a pilot NBR production process. The mechanistic model is stationary and is used for analyzing the influence of variations in feed compositions and process parameters on the properties of final NBR products, including the molecular weight and its distribution, branching degree of polymers, and the contents of acrylonitrile in NBR polymers, as illustrated by step A1 in Fig. 1. Then, a Mooney viscosity correlation is generated via GP, and also validated with experimental data of Mn, Mw and BRD of NBR polymers, as shown by step A2 in Fig. 1. Finally, the mechanistic model for emulsion polymerization and the data-driven model for Mooney viscosity are combined to build the process model connecting feed compositions and process parameters to NBR Mooney viscosity (step A in Fig. 1). With the developed process model, univariate and multivariate analyses are possible for quantitatively studying the influence of variations in the feed compositions and process parameters on the Mooney viscosity of NBR products. The specific variables include vinyl acetylene and dimer contents in the monomer 1,3-butadiene, and the flow rate of chain transfer agent (CTA, functions as the molecular weight mediator) in the middle of the reactor train (Fig. 2). This work is expected to support the intelligent manufacture of NBR in industry.
2. Mechanistic NBR polymerization model
The mechanistic model is based on emulsion polymerization kinetics with data from the NBR production line with an annual capacity of 50 kt located at Lanzhou Petro of PetroChina Company. The relevant polymerization process is schematically shown in Fig. 2. Seven reactors in a train are used for the continuous cold emulsion polymerization of 1,3-butadiene (Bd) and acrylonitrile (ACN) at 5 °C, and the volume of each reactor is identically 40.88 m3. The pressure within the first five reactors (R-1 to R-5 in Fig. 2) is 0.33 MPa, and it is 0.32 MPa in the last two. The monomers, assistant agents (including the CTA, surfactants and dispersion agents) and water at ambient temperature and pressure are mixed in a premixer, and then introduced into the first reactor. Initiator and activator are introduced separately into the first reactor. The stationary rating data of feed compositions for NBR production as shown in Table 1. The CTA is introduced, besides into the first reactor, also into the 4th till the 7th ones respectively. The total amount of CTA introduced into the 4th till the 7th reactors is defined as the intermediate CTA amount. The final conversion of monomers (at the outlet of the 7th reactor) is controlled to be below 75%, for a better control of the latex product quality. Analysis data of key additives, including sodium dodecylbenzene sulfonate, β-naphthalenesulfonic acid-formaldehyde condensate, diisopropylbenzene hydroperoxide, tert-dodecyl mercaptan and formaldehyde condensates are shown in Part 1 of ESI.†| # | Feed | Value | Function |
|---|---|---|---|
| 1 | 1,3-Butadiene | 3244 | Monomer |
| 2 | Acrylonitrile | 1457 | |
| 3 | β-Naphthalenesulfonic acid–formaldehyde condensate | 93.95 | Liquid soap |
| 4 | Sodium dodecylbenzene sulfonate | 11.75 | |
| 5 | Diisopropylbenzene hydroperoxide | 0.64 | Activator |
| 6 | Sodium formaldehyde sulfoxylate | 1.27 | |
| 7 | EDTA–FeNa | 0.21 | |
| 8 | EDTA–tetrasodium salt | 1.33 | |
| 9 | Hydroxylamine sulphate | 2.35 | Terminator |
| 10 | Isopropylhydroxylamine oxalate | 4.70 | |
| 11 | Phosphite ester | 22.85 | Anti-aging agent |
| 12 | Phenol | 11.42 | |
| 13 | tert-Dodecyl mercaptan | 4.78 | Chain transfer agent and deoxidant |
| 14 | Sodium hyposulfate | 0.42 |
2.1. General assumptions and polymerization kinetics
In modeling the NBR emulsion polymerization process, general simplifying assumptions as reported in literature6,10,14 are also adopted. Since the final monomer conversion is controlled to be below 75%, only stages I and II of the Smith–Ewart theory for emulsion polymerization are considered. The polymerization reactions are confined in the polymer particles. The number of polymer particles per unit volume of water (Np) is modeled via correlation to the initiator concentration (for simplicity excluding the surfactant concentration), as suggested by the Smith–Ewart theory.45 The average number of radicals per polymer particle (![[n with combining macron]](https://www.rsc.org/images/entities/i_char_006e_0304.gif) ) is simulated via the mass balance by considering initiator decomposition, radical desorption and termination, similar to the procedure describe in literature.10 Each reactor in the train is treated as an isothermal well stirred tank reactor. Model equations, forming a system of differential-algebraic equations (DAEs), were solved simultaneously for all reactors of the cascade using Aspen Polymer Plus™.
) is simulated via the mass balance by considering initiator decomposition, radical desorption and termination, similar to the procedure describe in literature.10 Each reactor in the train is treated as an isothermal well stirred tank reactor. Model equations, forming a system of differential-algebraic equations (DAEs), were solved simultaneously for all reactors of the cascade using Aspen Polymer Plus™.
The mechanism of NBR emulsion polymerization is free radical polymerization, and important elementary reactions include the propagation reactions, radical transfer reactions, radical termination reactions. Those reactions considered in our modeling are sorted and listed in Appendix A (Table 5). It is necessary to note that the involvement of vinyl acetylene and Bd dimers are also considered in the elementary reactions. The experimentally measured contents of Bd dimers and vinyl acetylene in the feed are chosen as the input values of these two impurities during simulation. Therefore, the model is capable of capturing the influence of these two impurities in the feed. The reaction kinetics parameters, including reaction rate constants (ki) and activation energies (Ea), reflect the influence of stoichiometry, temperature and pressure on the reaction rates of elementary reactions and consequently on the average molecular weight of NBR products. Therefore, the accuracy and reliability of the predicted average NBR molecular weight via the mechanistic model relies on training these polymerization kinetics parameters. To this end, an array of 29 sets of data from the pilot NBR production process are used to progressively regress the kinetics parameters of each elementary reaction. The data include the feed compositions and process parameters (intermediate CTA amount), as well as experimental results of Mn, Mw, BRD and ACN contents in the NBR copolymers. The data base for the starting values of these kinetics parameters is as summarized in literature;10 for those missing, an arbitrary value of the same order of magnitude as similar elementary reactions is assumed. When the object function Z expressing the difference between the modeled and experimental values of Mn, Mw, BRD and ACN contents are at minimal, the regression is terminated. So, the objective function Z is defined as:
| Z = (Msimn − Mexpn)2 + (Msimw − Mexpw)2 + (BRDsim − BRDexp)2 + (xsimACN − xexpACN)2 | (1) |
The regressed values of the kinetics parameters are also listed in Appendix A (Table 5).
2.2. Molecular weight and branching degree of NBR polymers
The aim of the mechanistic model is to output Mn, Mw, BRD of NBR polymers. These parameters are simulated via Aspen Polymer Plus™ package, with important formula shown below.10 The tri- and tetra-functional branching frequencies of NBR polymers ( ) have to be computed prior to the calculation of the average branching degree BRD.
 | (2) |
 | (3) |
 | (4) |
 | (5) |
 | (6) |
 ,
,  are the zeroth moments of the tri- and tetra-functional branching distributions.10
3. The predictive model for Mooney viscosity
The data-driven model in this work is for correlating the Mn, Mw, BRD of NBR to its Mooney viscosity, with the experimental data of NBR products from the last reactor in the train (Fig. 2). Based on the fundamental work of Kramer and co-workers46 correlated log![[thin space (1/6-em)]](https://www.rsc.org/images/entities/char_2009.gif) Mn, log
Mn, log![[thin space (1/6-em)]](https://www.rsc.org/images/entities/char_2009.gif) Mw of styrene-butadiene rubber to its log
Mw of styrene-butadiene rubber to its log![[thin space (1/6-em)]](https://www.rsc.org/images/entities/char_2009.gif) MV by fitting the experimental data, which led to
MV by fitting the experimental data, which led to  . In this correlation, a and b are constants, and the coefficient of determination in the linear regression (R2) is 0.94.46 Later on, this correlation has been widely adopted in the study of NBR. Our analyses with the experimental data of NBR in this work, however, show that this correlation is rather poor and the R2 of the regression is only 0.763 (cf. Fig. S1 in ESI†). As a result, it is necessary to establish an optimal correlation with the experimental data.
For establishing an optimal correlation for NBR Mooney viscosity, we employ two empirical modeling techniques: GP and linear regression model, with the latter as a benchmark. A total of 58 groups of experimental data are randomly put into a training set and a test set, with a size ratio of 6![[thin space (1/6-em)]](https://www.rsc.org/images/entities/char_2009.gif) :
:![[thin space (1/6-em)]](https://www.rsc.org/images/entities/char_2009.gif) 4. This means that 34 groups of data are for training the model, while the rest 24 groups are used to assess the generalization of the model. The experimental data include Mn, Mw, BRD of NBR, as briefly shown in Table 2. Either with the training set or with the test set, the Mooney viscosity values predicted by the model are compared to corresponding experimental ones, and mean square errors (MSE), mean absolute errors (MAE) and coefficients of determination (R2) are calculated.
4. This means that 34 groups of data are for training the model, while the rest 24 groups are used to assess the generalization of the model. The experimental data include Mn, Mw, BRD of NBR, as briefly shown in Table 2. Either with the training set or with the test set, the Mooney viscosity values predicted by the model are compared to corresponding experimental ones, and mean square errors (MSE), mean absolute errors (MAE) and coefficients of determination (R2) are calculated.
| Input variables | Training set | Test set | ||
|---|---|---|---|---|
| min | max | min | max | |
| Mn (Da) | 59![[thin space (1/6-em)]](https://www.rsc.org/images/entities/char_2009.gif) 409 409 |
10 7500 | 69![[thin space (1/6-em)]](https://www.rsc.org/images/entities/char_2009.gif) 529 529 |
101![[thin space (1/6-em)]](https://www.rsc.org/images/entities/char_2009.gif) 773 773 |
| Mw (Da) | 178![[thin space (1/6-em)]](https://www.rsc.org/images/entities/char_2009.gif) 856 856 |
503![[thin space (1/6-em)]](https://www.rsc.org/images/entities/char_2009.gif) 023 023 |
18 8050 | 364![[thin space (1/6-em)]](https://www.rsc.org/images/entities/char_2009.gif) 558 558 |
| BRD (×106) | 0.518902 | 3.449261 | 1.622368 | 3.446222 |
3.1. The linear regression model
The linear regression model for Mooney viscosity is expressed as:
 | (7) |
![[thin space (1/6-em)]](https://www.rsc.org/images/entities/char_2009.gif) MV as the model output,
MV as the model output,  the logarithm of inputs. The model has 3 variables as inputs (N = 3), namely Mn, Mw, BRD of NBR. For simplicity, numerical values 106 times the original ones of BRD are used in the calculation. Table 3 lists the fitted parameters of the linear regression model for viscosity.
According to these fitted model parameters, the correlation for Mooney viscosity can be written as follows:
| MV = 2.279Mn−0.23055Mw0.472269BRD−0.096426 | (8) |
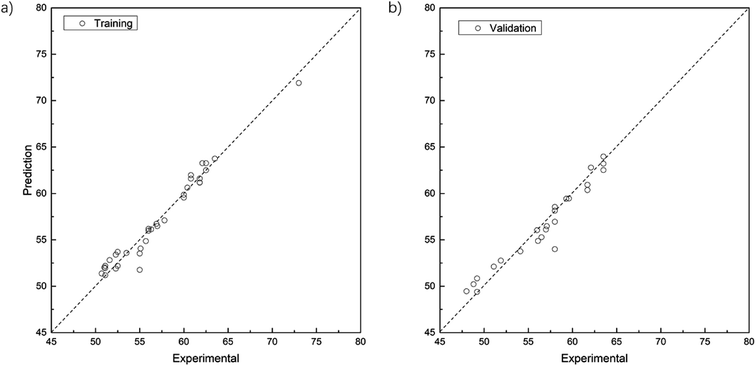
Fig. 3 shows the comparison between experimental and fitted values with data in the training and test sets. For the training set (Fig. 3a), MSE = 0.86, MAE = 0.70, R2 = 0.965; and for the test set (Fig. 3b), MSE = 1.44, MAE = 0.89, R2 = 0.937. It is therefore clear that the accuracy of the linear regression model for the Mooney viscosity prediction requires further improvement.
3.2. The genetic programming model
GP is a relatively new development in the field of evolutionary computation, it extends traditional genetic algorithms to symbolic regression.47 Symbolic regression is one type of machine learning techniques that aims at searching for the optimal mathematic formula describing a correlation. Fig. 4 shows the algorithm of GP, it starts by building a population of naive random formulas to represent a relationship between known independent variables and their dependent variable (targets) in order to predict new data. Each successive generation of programs is then evolved from the one that came before it by selecting the fittest individuals from the population to undergo genetic operations. Such a characteristic of GP makes it well suited for identifying the optimal mathematic formulas describing the relationship between Mn, Mw, BRD of NBR and its Mooney viscosity.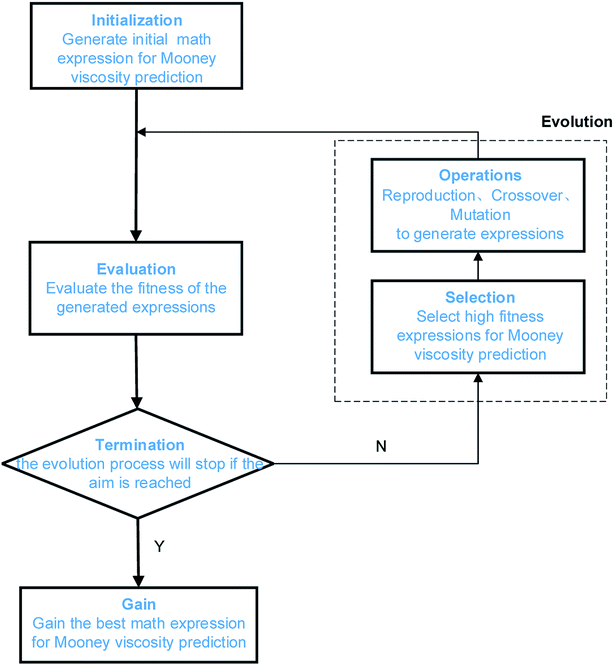 | ||
| Fig. 4 Illustration of the GP algorithm used for correlating NBR polymer characteristics to its Mooney viscosity. | ||
In this work, we use the toolkit gplearn in Python, this toolkit extends the machine learning library of scikit-learn and is able to excute GP via symbolic regression. The parameters for the GP algorithm are listed in Table 4. The data sets, function library and the fitness function are problem-specific. Here the data sets are the collection of experimental data characterizing each grade of the NBR products, including the Mn, Mw, BRD and corresponding Mooney viscosity values of NBR. The selection of mathematic operators in the function library should be as simple as possible, starting from basic operators (+, −, *, /) and progressively evolving with square root, exponential, logarithmic and power functions. The final set of math operators is fixed by evaluation of the accuracy of the model training results. The fitness function for GP is the mean absolute error of the fitting results for Mooney viscosity. The population size, maximum number of generations, probability of crossover and mutation, termination conditions shall also be defined for GP. The population size is the search domain, can be obtained after multiple runs of the program. The maximum number of generations is the iteration counts, which determines whether the population could evolve to the optimal state. The bigger the population size and the larger the maximum number of generations, the easier to acquire the optimal solution to the problem, however it takes longer for the program to run. The convergence rate of the calculation lies on the probability of mutation. In the GP model to be developed here, it is set at 0.7 to protect the optimal individuals, and such a mutation probability is expected to be efficient and also a balance between the mutation frequencies and the protection of optimal individuals.
| Parameters | Value |
|---|---|
| Dataset | Experimental data |
| Function library | +, −, *, /, ^, exp, log |
| Fitness evaluation function | Mean absolute error |
| Population size | 1000 |
| Tournament size | 20 |
| Maximum number of generations | 275 |
| Probability of crossover | 0.7 |
| Probability of performing subtree mutation | 0.01 |
| Probability of performing hoist mutation | 0.05 |
| Probability of performing point mutation | 0.01 |
| Parsimony coefficient | 0.001 |
According to the preferred criteria of accuracy, simplicity, transparence for a good model, our GP yields such an optimal correlation for NBR Mooney viscosity:
 | (9) |
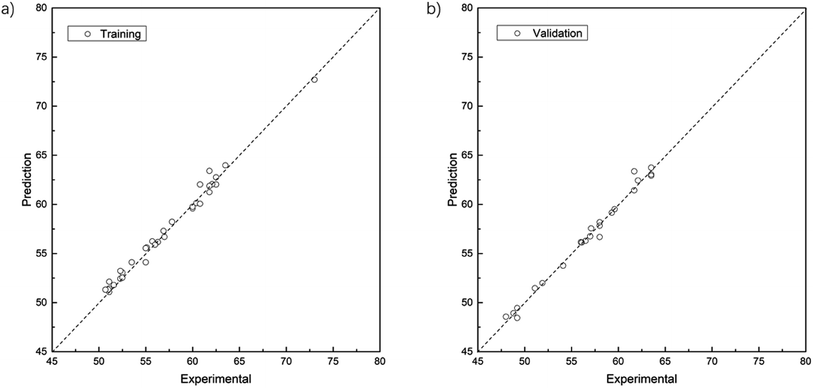
The parity plots showing the comparison between experimental and simulated values are shown in Fig. 5. For the results of the training data set (Fig. 5a), MSE = 0.33, MAE = 0.45, R2 = 0.986; while for test data set (Fig. 5b), MSE = 0.29, MAE = 0.38, R2 = 0.987.
4. Results and discussions
4.1. The accuracy of mechanistic model for NBR emulsion polymerization
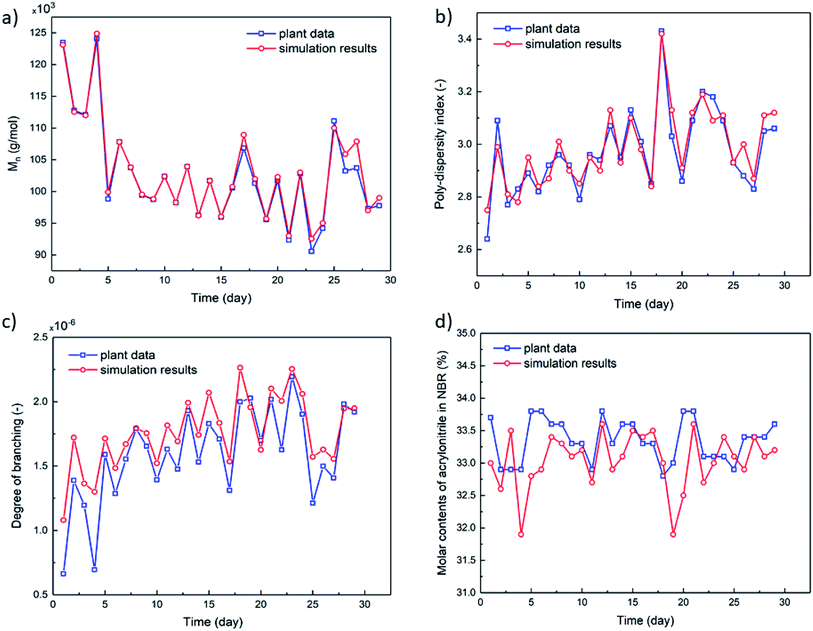
To build the mechanistic model based on emulsion polymerization kinetics, experimental data of the polymer characteristics and the monomer conversion rates are necessary to optimize the reaction rate constants (k0) and activation energies (Ea) of each elementary reactions as listed in Appendix A (Table 5). In a pilot NBR production line, the feed compositions, process parameters and characteristics of NBR polymers in some reactors (mostly the 7th reactor, as shown in Fig. 2) were monitored continuously for 29 days by periodic sampling and subsequent analyses. Experimental data thus collected are used for the model optimization. The experimentally analyzed characteristics of NBR polymers include Mn, polydispersity index (PDI, Mw/Mn), BRD and ACN contents in the copolymers. For the calculation of BRD, the Mark–Houwink correlation as reported in literature48 is used. The radii of gyration (Rg) for NBR polymers of different molecular weights, necessary for the calculation, are directly obtained by GPC-MALLS-Viscometer (gel permeation chromatography – multi angles laser light scattering - viscometer).The average branching degrees of NBR polymers, BRD, are calculated with experimental data as reported.49 The technical details of GPC-MALLS-Viscometer are shown in Part 4 of ESI.† Fig. 6 and 7 show the simulated and experimental values of final monomer conversion rate, Mn, PDI, BRD and ACN contents in NBR copolymers, and the MSEs of them are 1.66, 0.79 × 10⁴, 0.15, 0.33 × 10⁻⁶ and 0.41, respectively. The comparison demonstrates that the developed mechanistic model based on emulsion polymerization kinetics is accurate and reliable.4.2. The accuracy of the process model for predicting Mooney viscosity
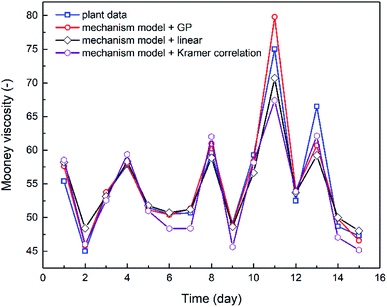
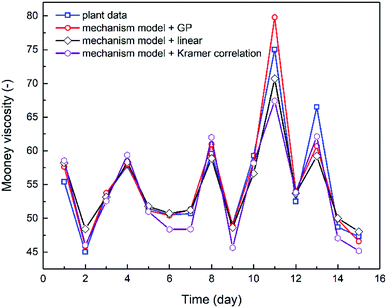
The combination of the mechanistic model based on NBR emulsion polymerization kinetics (Section 4.1) and the optimal viscosity correlations generated via either linear regression or GP (Section 3.2) has established the process model for predicting NBR Mooney viscosity. The process model is then used to predict NBR viscosity directly from a new set of feed compositions, and the comparison between predicted and experimentally measured viscosity values are shown in Fig. 8. The results validate the excellent predictive capability of the process model. The simulation results agree notably better with the experimental data when the GP-derived viscosity correlation (eqn (9)) is used, as compared to when the correlation derived from linear regression (eqn (8)) and Kramer correlation is used. The MSE values for the GP-derived, linear regression-derived models and Kramer correlation are 4.64, 6.85 and 8.63, respectively; and the MAE values are 1.40, 1.78 and 2.38, respectively. These results prove two things: (a) the parameter, average branching degree of NBR polymers (BRD), shall be incorporated into the viscosity correlation for better accuracy of the process model. (b) GP, compared to traditional linear regression method, is able to further improve the accuracy of the viscosity prediction via the process model.Minimization of the variation in the product Mooney viscosity during the production of NBR with a specific grade is a primary aim for the process control. As shown in Fig. 8, after 10 days the product viscosity has two undesirable large jumps, which is due to observed large fluctuations of the vinyl acetylene contents in the feed of monomer Bd. The developed process model is capable of capturing this important feature, which is key to understanding the process and to optimizing the operation scenarios for the stabilization of product viscosity. To sum up, the predictive process model for NBR Mooney viscosity is proved to be able to quantify directly the influence of feed compositions on the final product viscosity, and the prediction accuracy is excellent towards optimal control of the product quality.
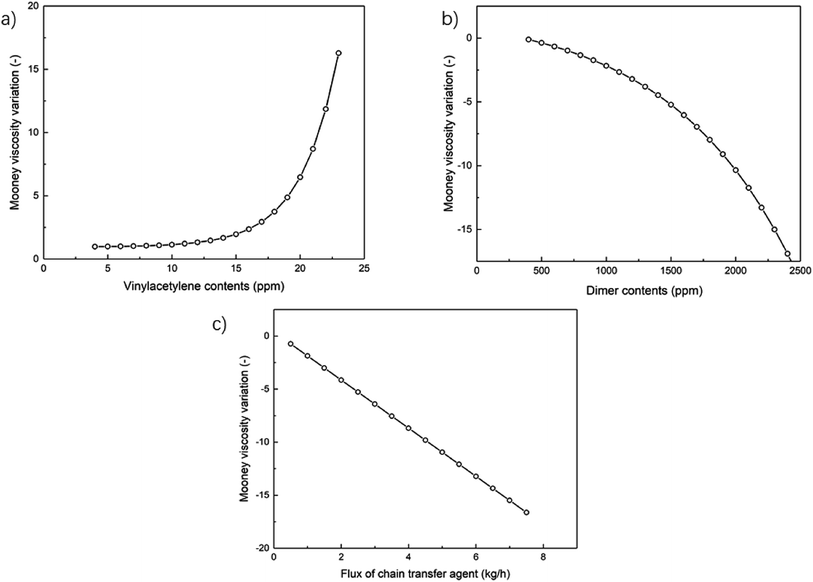
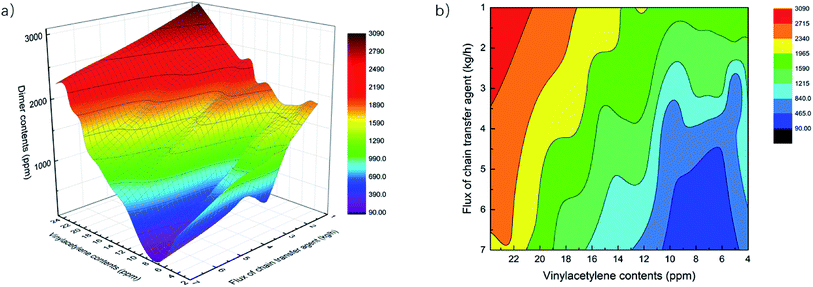
4.3. The influence of feed impurities on NBR Mooney viscosity
Two impurities, vinyl acetylene and Bd dimers, in the monomer feed Bd for the emulsion polymerization have influence on the characteristics of polymerized NBR polymers, consequently also on their Mooney viscosity. Vinyl acetylene would promote cross-linking reactions, this results in more branched polymers of larger molecular weight, and finally larger NBR Mooney viscosity. Bd dimers could retard the polymerization and consume many radicals from the initiator or bound to growing chains, which lowers the molecular weight and decreases the Mooney viscosity.16 In building the process model as described above, the integration of the mechanistic model based on emulsion polymerization kinetics makes it possible to include the effect of such two impurities on the polymerization process, and then to predict the Mooney viscosity of NBR products. Besides, the added amount (flow rate) of chain transfer agent, functioning as a molecular weight mediator, is the main means to artificial control the product viscosity. Thus, the developed process model is employed to analyze the univariate and multivariate influence of feed compositions on NBR Mooney viscosity, and the variables include the contents of vinyl acetylene and dimer in Bd, as well as the intermediate mass flow rate of CTA in the process (Fig. 2).Therefore, we suggest that the optimal methodology to build models for the prediction of NBR rubber Mooney viscosity is the combination of mechanism model for the emulsion polymerization process and the data model for the correlation of NBR rubber Mooney viscosity. This approach is not only able to realize the direct prediction of NBR rubber Mooney viscosity from the feed composition and process conditions, but is also able to reveal the polymerization mechanism for a better understanding of the emulsion polymerization process. This approach is suitable for the accurate prediction of product properties with diversified feeds and process conditions.
The mathematic model for the NBR production process established in this work is capable of directly relating the feed compositions and process parameters to the Mooney viscosity of final products. If the on-line detection of the vinyl acetylene content, the Bd dimer content in the feed and the CTA content via, e.g. infra-red spectrometry is available, the established model can be employed to realize on-line detection and simultaneous optimization, and advanced process control of the industrial emulsion polymerization process for NBR production, towards the realm of “intelligent manufacture”.
The hybrid model proposed in this work can be further improved on two aspects: firstly, more experimental Mooney viscosity data with wider range could be collected for the modeling with GP; secondly, the mechanism model about the emulsion polymerization process can be enriched with more details, and this is the focus of future research and how to integrate data science algorithms into the establishment of more detailed mechanism models is also an interesting direction.
5. Conclusions
A process model comprised of a mechanistic model and a data-driven model in sequence is built to predict the Mooney viscosity of nitrile-butadiene rubber (NBR) directly from the feed compositions and process parameters of the emulsion polymerization process. The mechanistic model is based on emulsion polymerization kinetics, and is well suited to describe the polymerization process. While the data-driven model for correlating the molecular weight and branching degree of polymers is derived from genetic programming (GP). The proposed process model in this work serves to help stabilize the viscosity of NBR products, and supports its “intelligent manufacture”.In building the data-driven model for the correlation between number-, weight-averaged molecular weight (Mn, Mw) of NBR polymers and their Mooney viscosity, GP is chosen to integrate the polymer branching degree into the model. Under such conditions, the predicted viscosity results provided by the data-driven model match better with experimental values, as compared to the situations when the polymer branching degree is not included in the model, or when only simple power functions are used to correlate the Mooney viscosity. With the developed process model, it is possible to analyze the influence of three dominant parameters on the Mn, Mw of NBR polymers, and consequently on the Mooney viscosity of NBR products. The three dominant parameters are the contents of vinyl acetylene and dimers in the monomer 1,3-butadiene, and the mass flow rate of chain transfer agent in the middle of the process. The simulated results show that NBR Mooney viscosity is positively and negatively proportional to the contents of vinyl acetylene and dimers, respectively, and the relationship deviates obviously from linearity when the content in both cases is above a threshold value. To stabilize the product Mooney viscosity and improve its quality, it is suggested to keep the contents of vinyl acetylene and dimer in the feed below 14 ppm and 1100 ppm, respectively.
The proposed mathematic model in this work correlates directly the feed compositions, process parameters to the Mooney viscosity of NBR products. If combined with on-line detection of the vinyl acetylene and dimer contents of the feed, it can be envisaged that optimization and advanced control of the process is readily achievable, which would finally lead to the realm of intelligent manufacture featuring efficient conversion of materials and energy.
Appendix A. Kinetics parameters of elementary reactions
| Code | Reactions | Mechanism | Pre-exp | Act-energy kJ mol−1 |
|---|---|---|---|---|
| 1 | Pn[An] + An → Pn+1[An] | Propagation | 6.9 × 10⁸ | 16.245 |
| 2 | Pn[An] + Bd → Pn+1[Bd] | 3.9 × 10⁹ | 16.162 | |
| 3 | Pn[An] + C4H4 → Pn+1[C4H4] | 6.87 × 10⁸ | 37.723 | |
| 4 | Pn[Bd] + An → Pn+1[An] | 1.31 × 10⁹ | 37.723 | |
| 5 | Pn[Bd] + Bd → Pn+1[Bd] | 6.87 × 10⁸ | 37.723 | |
| 6 | Pn[Bd] + C4H4 → Pn+1[C4H4] | 6.87 × 10⁸ | 37.723 | |
| 7 | Pn[C4H4] + An → Pn+1[An] | 6.87 × 10⁸ | 37.723 | |
| 8 | Pn[C4H4] + Bd → Pn+1[Bd] | 6.87 × 10⁸ | 37.723 | |
| 9 | Pn[C4H4] + C4H4 → Pn+1[C4H4] | 6.87 × 10⁸ | 37.723 | |
| 10 | Pn[An] + An → Dn + P1[An] | Transfer to monomer | 10![[thin space (1/6-em)]](https://www.rsc.org/images/entities/char_2009.gif) 800 800 |
28.799 |
| 11 | Pn [An]+Bd → Dn + P1[Bd] | 10![[thin space (1/6-em)]](https://www.rsc.org/images/entities/char_2009.gif) 800 800 |
28.799 | |
| 12 | Pn [An]+ C4H4 → Dn + P1[C4H4] | 15![[thin space (1/6-em)]](https://www.rsc.org/images/entities/char_2009.gif) 500 500 |
28.799 | |
| 13 | Pn [Bd]+An → Dn + P1[An] | 10![[thin space (1/6-em)]](https://www.rsc.org/images/entities/char_2009.gif) 800 800 |
28.799 | |
| 14 | Pn[Bd] + Bd → Dn + P1[Bd] | 10![[thin space (1/6-em)]](https://www.rsc.org/images/entities/char_2009.gif) 800 800 |
28.799 | |
| 15 | Pn[Bd] + C4H4 → Dn + P1[C4H4] | 15![[thin space (1/6-em)]](https://www.rsc.org/images/entities/char_2009.gif) 500 500 |
28.799 | |
| 16 | Pn[C4H4] + An → Dn + P1[An] | 16![[thin space (1/6-em)]](https://www.rsc.org/images/entities/char_2009.gif) 000 000 |
28.799 | |
| 17 | Pn[C4H4] + Bd → Dn + P1[Bd] | 15![[thin space (1/6-em)]](https://www.rsc.org/images/entities/char_2009.gif) 000 000 |
28.799 | |
| 18 | Pn[C4H4] + C4H4 → Dn + P1[C4H4] | 15![[thin space (1/6-em)]](https://www.rsc.org/images/entities/char_2009.gif) 000 000 |
28.799 | |
| 19 | Pn[An] + CH–B → Dn + R* | Transfer to CTA | 135![[thin space (1/6-em)]](https://www.rsc.org/images/entities/char_2009.gif) 000 000 |
16.744 |
| 20 | Pn[Bd] + CH–B → Dn + R* | 90![[thin space (1/6-em)]](https://www.rsc.org/images/entities/char_2009.gif) 000 000 |
16.744 | |
| 21 | Pn[C4H4] + CH–B → Dn + R* | 90![[thin space (1/6-em)]](https://www.rsc.org/images/entities/char_2009.gif) 000 000 |
16.744 | |
| 22 | Pn[An] + Pm[An] → Dn+m | Termination | 460![[thin space (1/6-em)]](https://www.rsc.org/images/entities/char_2009.gif) 000 000 |
10.465 |
| 23 | Pn[An] + Pm[Bd] → Dn+m | 460![[thin space (1/6-em)]](https://www.rsc.org/images/entities/char_2009.gif) 000 000 |
10.465 | |
| 24 | Pn[An] + Pm[C4H4] → Dn+m | 460![[thin space (1/6-em)]](https://www.rsc.org/images/entities/char_2009.gif) 000 000 |
10.465 | |
| 25 | Pn[Bd] + Pm[An] → Dn+m | 460![[thin space (1/6-em)]](https://www.rsc.org/images/entities/char_2009.gif) 000 000 |
10.465 | |
| 26 | Pn[Bd] + Pm[Bd] → Dn+m | 460![[thin space (1/6-em)]](https://www.rsc.org/images/entities/char_2009.gif) 000 000 |
10.465 | |
| 27 | Pn[Bd] + Pm[C4H4] → Dn+m | 460![[thin space (1/6-em)]](https://www.rsc.org/images/entities/char_2009.gif) 000 000 |
10.465 | |
| 28 | Pn[C4H4] + Pm[An] → Dn+m | 460![[thin space (1/6-em)]](https://www.rsc.org/images/entities/char_2009.gif) 000 000 |
10.465 | |
| 29 | Pn[C4H4] + Pm[Bd] → Dn+m | 460![[thin space (1/6-em)]](https://www.rsc.org/images/entities/char_2009.gif) 000 000 |
10.465 | |
| 30 | Pn[C4H4] + Pm[C4H4] → Dn+m | 460![[thin space (1/6-em)]](https://www.rsc.org/images/entities/char_2009.gif) 000 000 |
10.465 | |
| 31 | Ca–b + Ca–d[re.] → nR* + Ca–d[ox.] + [by-products] | Oxidation | 14 | 16.744 |
| 32 | Ca–c + Ca–d[ox.] → Ca–d(re.) + [by-products] | Reduction | 1000 | 0 |
| 33 | Pn[Bd] + Dm → Dn + Pm[An] | Transfer to polymer | 800![[thin space (1/6-em)]](https://www.rsc.org/images/entities/char_2009.gif) 000 000 |
37.757 |
| 34 | Pn[An] + Dm → Dn + Pm[Bd] | 800![[thin space (1/6-em)]](https://www.rsc.org/images/entities/char_2009.gif) 000 000 |
37.757 |
Nomenclature
Author contributions
Conceptualization, Tuo; methodology, He; software, He; validation, Dai; formal analysis, Tuo and Dang; investigation, Dang; resources, He; data curation, He; writing—original draft preparation, He; writing—review and editing, Tuo; visualization, Dai; supervision, Zhou; project administration, Ji; funding acquisition, Ji. All authors have read and agreed to the published version of the manuscript.Conflicts of interest
The authors declare no conflict of interest.Acknowledgements
The authors would like to thank National Natural Science Foundation of China (21776183, 21706220) for the financial support in this research.References
- E. Ehabe, F. Bonfils, C. Aymard, A. K. Akinlabi and J. Sainte Beuve, Polym. Test., 2005, 24, 620–627 CrossRef CAS.
- L. Hlalele, D. R. D’hooge, C. J. Dürr, A. Kaiser, S. Brandau and C. Barner-Kowollik, Macromolecules, 2014, 47, 2820–2829 CrossRef CAS.
- W. J. Zheng, X. J. Gao, Y. Liu, L. M. Wang, J. G. Yang and Z. L. Gao, Chemom. Intell. Lab. Syst., 2017, 171, 86–92 CrossRef CAS.
- J. R. Vega, L. M. Gugliotta, R. O. Bielsa, M. C. Brandolini and G. R. Meira, Ind. Eng. Chem. Res., 1997, 36, 1238–1246 CrossRef CAS.
- J. R. Vega, L. M. Gugliotta and G. R. Meira, Lat. Am. Appl. Res., 2003, 33, 115–122 CAS.
- R. J. Minari, L. M. Gugliotta, J. R. Vegat and G. R. Meira, Ind. Eng. Chem. Res., 2007, 46, 7677–7683 CrossRef CAS.
- R. J. Minari, L. M. Gugliotta, J. R. Vega and G. R. Meira, Comput. Chem. Eng., 2007, 31, 1073–1080 CrossRef CAS.
- M. A. Dube, A. Penlidis, R. K. Mutha and W. R. Cluett, Ind. Eng. Chem. Res., 1996, 35, 4434–4448 CrossRef CAS.
- M. A. Dube, J. B. P. Soares, A. Penlidis and A. E. Hamielec, Ind. Eng. Chem. Res., 1997, 36, 966–1015 CrossRef CAS.
- I. D. Washington, T. A. Duever and A. Penlidis, J. Macromol. Sci., Part A: Pure Appl.Chem., 2010, 47, 747–769 CrossRef CAS.
- C. M. R. Madhuranthakam and A. Penlidis, Polym. Eng. Sci., 2011, 51, 1909–1918 CrossRef CAS.
- C. M. R. Madhuranthakam and A. Penlidis, Polym. Eng. Sci., 2013, 53, 9–20 CrossRef CAS.
- A. J. Scott, A. Nabifar, C. M. R. Madhuranthakam and A. Penlidis, Macromol. Theory Simul., 2015, 24, 13–27 CrossRef CAS.
- A. Zubov, J. Pokorny and J. Kosek, Chem. Eng. J., 2012, 207, 414–420 CrossRef.
- T. Nobuo, Estimation of Mooney viscosity, Japan Pat., JP59048642, 1984 Search PubMed.
- A. J. Scott and A. Penlidis, J. Macromol. Sci., Part A: Pure Appl.Chem., 2013, 50, 803–811 CrossRef CAS.
- W. Zheng, Y. Liu, Z. Gao and J. Yang, Chemom. Intell. Lab. Syst., 2018, 180, 36–41 CrossRef CAS.
- G. Padmavathi, M. G. Mandan, S. P. Mitra and K. K. Chaudhuri, Comput. Chem. Eng., 2005, 29, 1677–1685 CrossRef CAS.
- Z. Zhang, K. Song, T.-P. Tong and F. Wu, Chemom. Intell. Lab. Syst., 2012, 112, 17–23 CrossRef CAS.
- S. Zheng, K. Liu, Y. Xu, H. Chen, X. Zhang and Y. Liu, Sensors, 2020, 20, 695 CrossRef CAS.
- K. Yang, H. Jin, X. Chen, J. Dai, L. Wang and D. Zhang, Chemom. Intell. Lab. Syst., 2016, 155, 170–182 CrossRef CAS.
- Y. Liu and Z. Gao, J. Appl. Polym. Sci., 2015, 132(6), 1–9 CrossRef.
- K. Song, F. Wu, T.-p. Tong and X.-j. Wang, J. Chemom., 2012, 26, 557–564 CrossRef CAS.
- M. Hinchliffe, G. Montague, M. Willis and A. Burke, AIChE J., 2003, 49, 3127–3137 CrossRef CAS.
- W. H. AlAlaween, M. Mahfouf and A. D. Salman, AIChE J., 2017, 63, 4761–4773 CrossRef CAS.
- H. J. L. Van Can, H. A. B. Te Braake, S. Dubbelman, C. Hellinga, K. C. A. M. Luyben and J. J. Heijnen, AIChE J., 1998, 44, 1071–1089 CrossRef CAS.
- Y. Liu, Q. Y. Wu and J. H. Chen, Ind. Eng. Chem. Res., 2017, 56, 4804–4817 CrossRef CAS.
- Y. W. Marien, P. H. M. Van Steenberge, D. R. D‘hooge and G. B. Marin, Macromolecules, 2019, 52, 1408–1423 CrossRef CAS.
- A. G. Marcos, A. V. P. Espinoza, F. A. Elias and A. G. Forcada, Int. J. Comput. Integr. Manuf., 2007, 20, 828–837 Search PubMed.
- G. Delfa, A. Olivieri and C. E. Boschetti, Comput. Chem. Eng., 2009, 33, 850–856 CrossRef.
- A. H. Gandomi, A. H. Alavi and C. Ryan, Handbook of Genetic Programming Applications, Springer International Publishing, 2015 Search PubMed.
- B. McKay, M. Willis and G. Barton, Comput. Chem. Eng., 1997, 21, 981–996 CrossRef CAS.
- B. Grosman and D. R. Lewin, Comput. Chem. Eng., 2004, 28, 2779–2790 CrossRef CAS.
- M. P. Hinchliffe and M. J. Willis, Comput. Chem. Eng., 2003, 27, 1841–1854 CrossRef CAS.
- J. Madar, J. Abonyi and F. Szeifert, Ind. Eng. Chem. Res., 2005, 44, 3178–3186 CrossRef CAS.
- X. H. Wang and Y. G. Li, Ind. Eng. Chem. Res., 2008, 47, 8815–8822 CrossRef CAS.
- K. Zhang, H. Zhou, D. Hu, Y. Zhao and X. Feng, Acta Mech. Solida Sin., 2009, 22, 251–260 CrossRef.
- S. M. Mirabdolazimi and G. Shafabakhsh, Constr. Build. Mater., 2017, 148, 666–674 CrossRef.
- L. Gusel and M. Brezocnik, Comput. Mater. Sci., 2006, 37, 476–482 CrossRef CAS.
- H.-M. Chen, W.-K. Kao and H.-C. Tsai, Eng. Appl. Artif. Intell., 2012, 25, 1103–1113 CrossRef.
- P. Kazemi, M. H. Khalid, J. Szlek, A. Mirtic, G. K. Reynolds, R. Jachowicz and A. Mendyk, Powder Technol., 2016, 301, 1252–1258 CrossRef CAS.
- N. Caglar, A. Demir, H. Ozturk and A. Akkaya, Eng. Appl. Artif. Intell., 2015, 38, 79–87 CrossRef.
- K. C. Seavey, A. T. Jones, A. K. Kordon and G. F. Smits, Ind. Eng. Chem. Res., 2010, 49, 2273–2285 CrossRef CAS.
- F. GuidoSmits, M. Kotanchek, in Genetic programming theory and practice, Springer, 2nd edn, 2005, pp. 283–299 Search PubMed.
- C. S. Chern, Prog. Polym. Sci., 2006, 31, 443–486 CrossRef CAS.
- O. Kramer and W. R. Good, J. Appl. Polym. Sci., 1972, 16, 2677–2684 CrossRef CAS.
- J. R. Koza, Genetic Programming: On the Programming of Computers by Means of Natural Selection, MIT Press, Cambridge, MA, 1992 Search PubMed.
- C. J. Duerr, L. Hlalele, M. Schneider-Baumann, A. Kaiser, S. Brandau and C. Barner-Kowollik, Polym. Chem., 2013, 4, 4755–4767 RSC.
- V. I. Rodriguez, D. A. Estenoz and L. M. Gugliotta, et al., Int. J. Polym. Mater., 2002, 51, 511–527 CrossRef CAS.
Footnote |
| † Electronic supplementary information (ESI) available. See DOI: 10.1039/d0ra07257e |
| This journal is © The Royal Society of Chemistry 2021 |


