 Open Access Article
Start-up stage with improved resolution for an electric field-assisted fused deposition
Xu Ruihan ab,
Bao Weijie
 ab,
Wang Zhihai*ab and
Wang Yaohongc
aFaculty of Information, Beijing University of Technology, Beijing 100124, China. E-mail: wangzhihai@bjut.edu.cn
bKey Laboratory of Optoelectronics Technology, Beijing University of Technology, Beijing 100124, China
cCenter for Applied Mathematics, Tianjin University, Tianjin 300072, China
First published on 12th February 2021
Abstract
Electric field-assisted fused deposition modeling (E-FDM) is a promising technique in the field of 3D printing. This paper studies the start-up stage of the printing, which is a process of liquid gradually deforming and making an initial contact with the substrate under the action of electric stress. Polycaprolactone, a popular material for biomedicine, is selected as the printing material. With a home-built E-FDM system, the nozzle-to-substrate distance and the nozzle and substrate temperatures are all held steady. With a photography system, the process of meniscus deformation is recorded. And by image processing methods, the meniscus length and the volume of liquid at the nozzle can be obtained. At a set of initial liquid volumes (Vi), nozzle voltage is ramped to a fixed value at a fixed rate. The effects of Vi on the meniscus deformation during the start-up stage of the printing are examined. For sufficiently small Vi, the meniscus deforms into a conical (Taylor cone) shape, and a fine jet with a diameter much smaller than the nozzle diameter appears. For sufficiently large Vi, the meniscus exhibits a spindle shape when it touches the substrate. At an intermediate Vi, a Taylor cone is formed, tending to eject a fine jet. After a short period of stagnation or even a slight retraction, no liquid is emitted. Through this study, it is suggested that for high-resolution printing, ramping the voltage at small Vi may be preferable. This proposition is preliminarily confirmed in a direct writing test.
1. Introduction
Fused deposition modeling (FDM) is a well-developed technique and may be one of the most commonly used additive manufacturing technologies.1 It involves melting a thermoplastic material in a melting chamber, extruding the molten material from a nozzle by means of air pressure or continuous feeding, and depositing the melt material layer by layer to form 3D articles. In addition to general rapid prototyping, FDM is also used in scientific research. For example, FDM is widely employed in bio-printing, with applications in the fields of tissue engineering2 and drug development.3 In addition, FDM has also been used in the fabrication of microscale structures, such as microfluidic chips.4 The advantages of the FDM method include low cost, relatively simple printing process, and compatibility with a variety of materials. However, its printing resolution is limited by the nozzle diameter. Improving printing resolution by reducing the nozzle diameter faces difficulties.5The electrohydrodynamic (EHD) method is popular in the field of micro-fabrication.6 With a high voltage applied between nozzle and substrate, a strong electric field is established at the nozzle, and the meniscus at the nozzle forms a conical shape (referred to as a Taylor cone) under the action of the electric stress.7 Electrospinning is an example of the use of the EHD method. A fine jet, typically much thinner than the nozzle diameter, can be ejected from the end tip of the Taylor cone, and can produce micrometer or even nanometer diameter thin wires.8 Electrospinning has been exploited in the field of bio-medicine to fabricate scaffolds for tissue engineering.9 However, for traditional electrospinning, the jet whips laterally as it is far away from the nozzle, and therefore high-precision printing is hard to achieve.10 To avoid this problem, a near-field EHD direct writing method is proposed, where the nozzle is put sufficiently close to the substrate so that the liquid jet reaches the substrate before the appearance of lateral instability. This method, referred to here as electric field-assisted FDM (E-FDM), or in some other literature as melt electrospinning writing, has become a promising technique for improving print resolution.6,11 This technology has been used in biomedicine, functional material preparation, and printed optoelectronics.12 Besides the application researches, how to better control the jet is an interesting topic.12 And so far, according to our literature survey, more attention has been paid to the width of scribed line, and its dependence on the main control parameters, such as voltage, plotting speed, flow rate, and nozzle-substrate distance.12–14
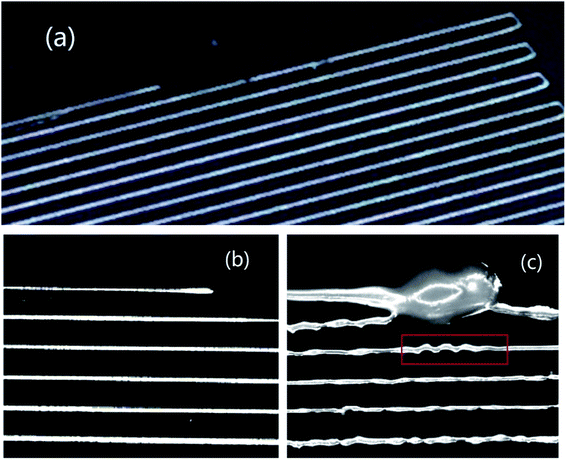
In this paper, however, we focus on the process in which the liquid at the nozzle gradually deforms to make the initial contact with the substrate, before the substrate starts to move. The authors believe this research topic has practical significance, as the resolution at the starting position of the printed pattern can be quite poor. A large drop of liquid at the starting position was observed in some previous publications.13,14 Especially for patterns of small line spacing, this drop of liquid could have negative impacts on subsequent printing. An example of such a case is shown in Fig. 8(c). For the purpose of high-resolution printing, we propose that the liquid should contact the substrate in the form of a fine jet with diameter much smaller than the nozzle diameter. Following such initial contact, high-resolution printing may be easier to achieve. The results of our study may be helpful for applications that need strict control of direct writing.15–17 An example of such applications is shown in Fig. 8(a) and (b).
With a home-built E-FDM system, the nozzle-to-substrate distance is fixed, and the nozzle and substrate temperatures are held steady. The flow of liquid is due to hydrostatic pressure, with more details provided in the next section. A typical start-up procedure for an E-FDM process is to start the liquid flow first. The meniscus at the nozzle is monitored by using photography and image processing. The voltage starts to ramp at time t*, with a fixed ramping rate, until a set voltage (fixed) is reached. At the moment t*, the volume of fluid at the nozzle is referred to as initial volume, denoted as Vi = V(t*). Note that t*or equivalently Vi is the only parameter changed in this study. By ramping the voltage at sufficiently small Vi (at sufficiently early time t*), the liquid meniscus eventually deforms into a Taylor cone, and a jet with diameter much smaller than the nozzle diameter emerges. By ramping the voltage at sufficiently large Vi, the liquid meniscus exhibits a spindle shape when it touches the substrate. The size of the spindle is comparable to the diameter of the nozzle. Through this study, it is suggested that for high-resolution printing, ramping the voltage at sufficiently small Vi is preferable.
Polycaprolactone (PCL), as a biodegradable material, is a commonly used material in biological printing. Cell culture scaffolds made from PCL have excellent mechanical strength and biological activity.18 PCL was used in the experiments described here. Although PCL can be electrospun in the forms of melt or solution, the experiments in this paper used PCL melt as printing material.19
2. Experimental
2.1 Experimental setup
The experimental setup is schematically shown in Fig. 1(a). The print head consists of a nozzle, a melting chamber, and a feeding module. The nozzle is a gauge 18 stainless steel needle, with outer diameter of 1.26 mm, inner diameter of 0.86 mm, and length of 6.3 mm. The nozzle is attached to the melting chamber. Typical feeding method for FDM is to squeeze a PCL wire into the melting chamber through a turning gear. With this method, the PCL flow is not uniform, possibly due to the stepping effect. With a slightly modified design, better flow rate control can be realized. As shown in Fig. 1(b), a rather large melting chamber is used to replace the very small one of the traditional FDM machine. The flow is well consistent with Poiseuille flow under hydrostatic pressure. By a turning gear, the PCL thin wire is fed into the melting chamber, to keep the melt level steady, either manually or automatically through machine vision monitoring. The print head is attached to a z-axis stage (model KSA150-11-z, from Zolix Instruments Co.). The substrate is made of 7075 aluminum alloy, which is mounted on a translation stage that moves in the XY directions (model KSA150-11-x, from Zolix Instruments Co.). The substrate is heated by a heating ceramics, and the temperature can be tuned up to 200 °C. The nozzle and the substrate are respectively connected to the output and the ground pole of a high-voltage power supply (model DW-P503-1ACDF, from Dongwen High-voltage Power Supply Co., Tianjin), with output voltage range 0–50 kV, and maximum output current up to 1 mA.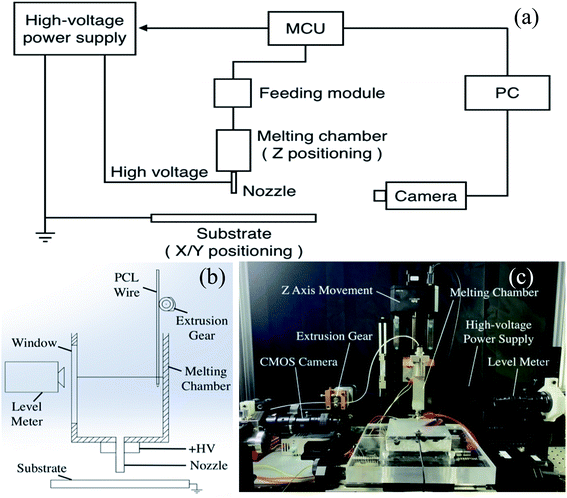 | ||
| Fig. 1 (a) Schematic diagram of electric field-assisted fused deposition modelling (E-FDM) system. (b) Schematic diagram of the print head and substrate. (c) Photo of the real experimental setup. | ||
The photography system is mainly composed of a high-brightness LED and a CMOS camera. The purpose of the system is to monitor the process of meniscus deformation. Photography is done by using a back-lighting configuration, with the nozzle staying between the LED and the camera. As shown in Fig. 1(a), the high-voltage power supply, the feeding module, the xyz positioning, and the CMOS camera are all controlled by a microcontroller (STM32) and a PC. A photo of the real instrument setup is shown in Fig. 1(c).
2.2 Experimental method
The morphological change of the liquid meniscus at the nozzle is obtained by photography with the CMOS camera. The frame rate is 1 frame every 5 seconds, and the exposure time is 5 ms. The original images are sequentially processed by an image processing software package (based on Python). First, the picture is converted to grayscale, and then the Canny edge detection algorithm used to extract the contour information in the picture. The Canny edge detection algorithm includes: using a Gaussian filter to smooth the input image, using the Sobel operator to calculate the gradient amplitude image and angle image, applying non-maximum suppression to the gradient amplitude image, and using double threshold processing and connection analysis to detect and connect edges. The information that is extracted by using the Canny algorithm contains all the contour information in the picture, so it is necessary to distinguish each closed contour and save its information in the form of an array. A typical meniscus is shown in Fig. 2(e), where ‘L’ represents the length of the liquid meniscus in the axial direction, as is marked in the figure. Meniscus length is an important measure of the meniscus deformation process, and will be discussed in the following section.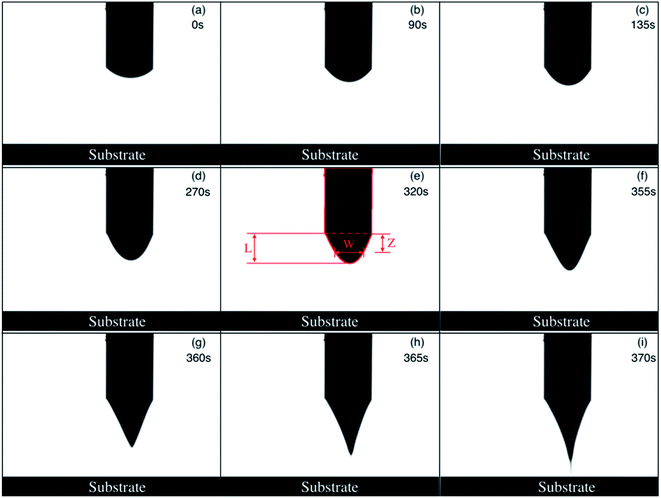 | ||
| Fig. 2 The process of meniscus deformation. A 2.7 kV high voltage is applied to the nozzle when the volume of PCL melt at the nozzle is 185 nL. | ||
The waist of the meniscus (w) is measured versus vertical distance from the nozzle edge (z), also shown in Fig. 2(e). Both w and z are measured in numbers of pixels. Therefore, the volume of the PCL melt at the nozzle is calculated via the equation
 | (1) |
The actual size (p1) corresponding to one pixel can be obtained based on that the outer diameter of the nozzle is 1.26 mm.
3. Results and discussion
3.1 Experimental conditions
As mentioned earlier, PCL is selected as the printing material. PCL has a melting point of 60 °C. Although it is difficult to measure the temperature of the nozzle tip, the temperature of the melting chamber is monitored and kept at Tm = 110 °C. The viscosity of PCL at this temperature is estimated as 500 Pa s.20 The temperature of the underlying metal substrate is 135 °C. As previously mentioned, the flow of PCL melt is mainly due to Poiseuille flow under hydrostatic pressure, without intentional feeding. The nozzle length is about 6.5 mm, the inner diameter is 0.86 mm, and the height of the PCL melt above the needle is about 25 mm. From this, it is estimated that the hydrostatic pressure is Δp = 270 Pa. From Poiseuille's law it can be estimated that the flow rate is 1.1 nL s−1. Although not shown here, the flow rate without applying electric voltage is measured to be 0.95 nL s−1, consistent with the above estimate. At the end of this article, it is also shown that the electric stress has negligible effect on the flow rate.
During this experiment, the nozzle-substrate distance is kept constant at 2 mm. When the PCL melt at the nozzle reaches a pre-set volume Vi, a high voltage of 2.7 kV is applied. The rate of voltage ramping is 180 V s−1. Electric discharge may occur in the process of forming the Taylor cone when a voltage higher than 2.7 kV is applied.
3.2 Effects of initial volume Vi on meniscus deformation
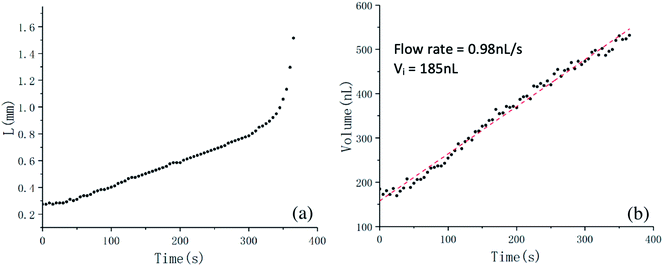
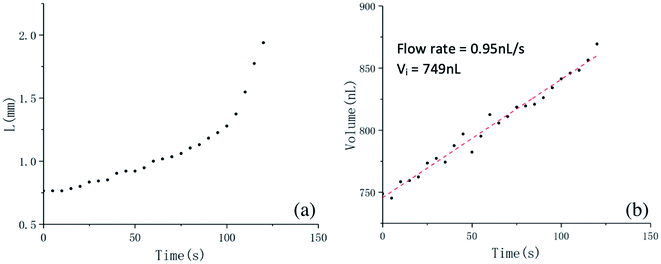
Meniscus deformation processes have been studied for more than 50 initial volumes, ranging from 60 nL to 800 nL. Setting a sufficiently small initial volume, Vi = 185 nL to be more specific, Fig. 2 shows the process of meniscus deformation until the melt touches the substrate. As shown in Fig. 3(a), before t = 280 s, the length of the meniscus increases linearly with time. At around t = 355 s, the meniscus deforms into a cone with a slightly rounded tip (the Taylor cone). At this time, the liquid volume at the nozzle is 530 nL. We will return to this point later in the discussion. At around t = 370 s, a fine jet emerges and finally reaches the substrate. The jet is much thinner than the diameter of the nozzle. The volume of fluid at the nozzle increases linearly over time, as shown in Fig. 3(b). The flow rate is estimated to be 0.98 nL s−1. In our experimental setup, for an initial volume less than about 270 nL, meniscus deformation similar to that shown in Fig. 2 and 3 would occur, and a fine jet is generated. This start-up state, referred to as state A, is clearly what we want. It may be beneficial for the writing process to maintain high resolution if we start moving the x–y stage as the jet touches the substrate.Fig. 4 shows the complete process of liquid deformation in a similar experiment, but with the voltage ramped up at a rather large initial volume Vi = 749 nL. The meniscus length L is shown in Fig. 5(a). Between 0 s and 60 s, L increases almost linearly versus time. Then L increases sharply, until around t = 115 s, at which the meniscus exhibits the sharpest end tip; see Fig. 4(h). After that, the tip of the meniscus becomes more rounded in shape. Meanwhile, the waist of the meniscus gets narrower. Finally, the liquid contacts the substrate, with a large lump of liquid deposited. As can be seen from Fig. 5(b), the liquid volume increases linearly throughout the process. The flow rate is consistent with what is expected from Poiseuille flow. By ramping the voltage at sufficiently large initial volume Vi (greater than approximately 500 nL in this experimental setup), a meniscus deformation process similar to that shown in Fig. 4 and 5 is prone to occur. Although not shown here, sometimes, the increase of the meniscus length slows down again, just before touching the substrate. This start-up state is referred to as state B. Instead of a fine jet, this start-up state will cause a large lump of liquid to be delivered at the beginning of the printing.
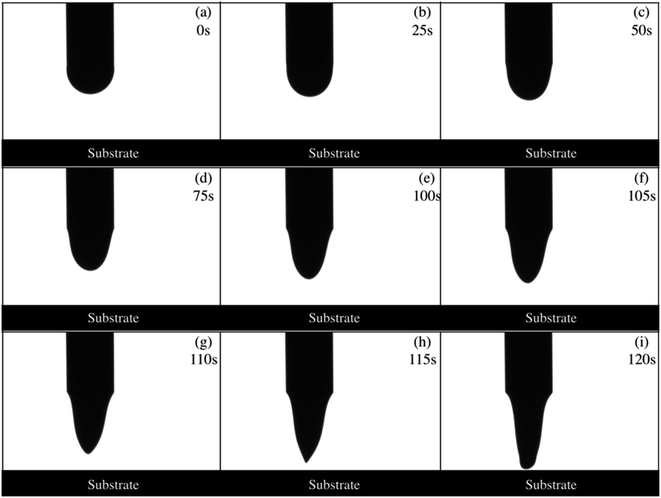 | ||
| Fig. 4 The process of meniscus deformation. A 2.7 kV high voltage is applied to the nozzle when the volume of PCL melt is 749 nL. | ||
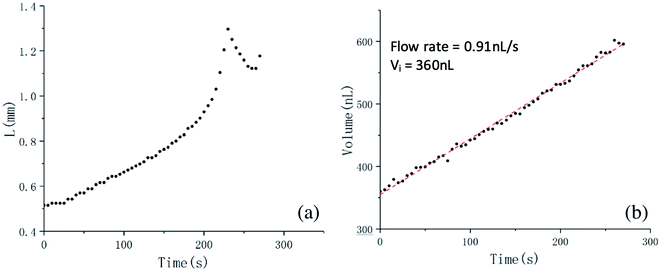
By ramping the voltage at an intermediate initial volume Vi (approximately 340–450 nL in this experiment setup), start-up state C may appear. Fig. 6 shows the deformation process of the meniscus for an initial volume Vi = 360 nL. And the meniscus length L versus time is plotted in Fig. 7(a). Before 160 s, L increases slowly and linearly. And then L increases sharply with time. These behaviors are similar to those shown in Fig. 4 and 6. As shown in Fig. 6(e), around t = 220 s, a Taylor cone similar to that in Fig. 2(f) is formed; the liquid volume is again 530 nL. At t = 230 s, L reaches a maximum. Then, L gradually decreases, as clearly suggested in Fig. 7(a). It is worth noting that although L is decreasing, the total fluid volume is still increasing linearly, as shown in Fig. 7(b). Although not shown here, it is confirmed that the electric stress can drastically change the meniscus shape; the change of volume at the nozzle is basically determined by Poiseuille's law and the hydrostatic pressure. Around t = 265 s, the meniscus length reaches a minimum. Later on, the meniscus continues to elongate and finally contacts the substrate, due to continuous feeding of liquid, and also to the electric stress. Two behaviors have been observed in the experiment: a fine jet may emerge, similar to that shown in Fig. 2; or a lump of liquid may finally contact the substrate, similar to that in Fig. 4. It is worth noting that the boundary between states A and C is not well defined. Specifically, for Vi in the range of 270–340 nL, both states have a certain probability of appearing.
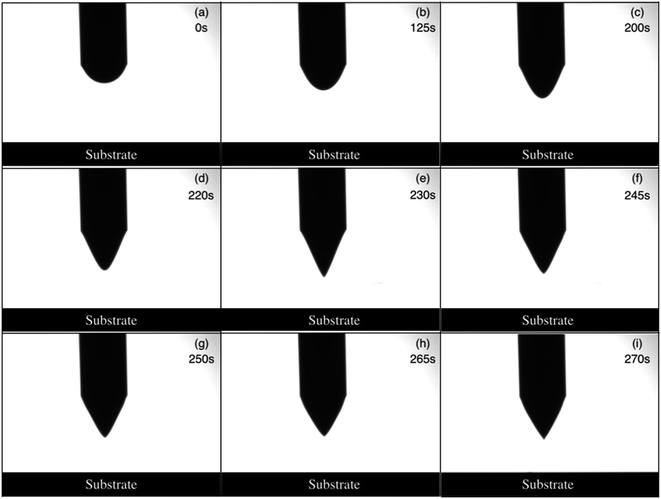 | ||
| Fig. 6 The process of meniscus deformation. A 2.7 kV high voltage is applied to the nozzle when the volume of PCL melt is 360 nL. | ||
As interpretations of the experimental results, we first explain why state B is more likely to occur with voltage applied at large initial volume Vi. According to Taylor's theory, the half angle of the Taylor cone is about 49°.7 Some studies have shown that this half angle may be as small as 33°.21 This is more consistent with the Taylor cone observed in our experiment. At this condition, the volume of the Taylor cone is about 530 nL (see Fig. 2(f) and Fig. 6(d)). If Vi is larger than this volume, the liquid cannot be deformed into the Taylor cone, and it is impossible to produce a fine jet. This is well consistent with the boundary between states B and C. For state C, the stagnation or even the slight retraction of meniscus may be understood as precursor of shaking of the meniscus. Meniscus shaking is observed for ordinary dripping from a nozzle.22 A lump of liquid, free-standing or attached to a nozzle, can also shake within a strong electric field, without any liquid emission.23,24 For low-viscosity fluids, the shaking amplitude is rather large.25 Due to the high viscosity of the PCL melt, the shaking cannot be observed as it damps out. That ramping voltage at sufficiently small liquid volume tends to give state A is not straightforward. Here, a plausible explanation is presented. In our experimental setup, the ambient temperature between the nozzle and substrate is about 50–60 °C, which is much lower than the nozzle temperature at 110 °C. The PCL melt cools down as it is extruded from the nozzle. Due to poor heat conduction of PCL, the time for the temperature to reach equilibrium is rather long. The time constant is estimated as  (ref. 26) where heat capacity is Cp = 2 × 10³ J kg−1 K−1,27 density is ρ = 1.2 × 10³ kg m−3, thermal conductivity is σ = 0.16 W m−1 K−1,28 and meniscus length is taken to be L = 1 mm. For smaller initial volume Vi, the whole process takes a longer time and the liquid tends to stabilize at lower temperature. This leads to larger viscosity for the liquid, and therefore a stronger suppression effect on the liquid shaking behavior.
Based on the results in this section, to obtain high printing resolution, the liquid meniscus should make its contact with the substrate in the form of a fine jet. For demonstration, a meander pattern is printed. The inter-line spacing is 0.3 mm. Therefore, the voltage should be applied when the volume at the nozzle is sufficiently small. Specifically, Vi = 182 nL. The Taylor cone is formed and a fine jet stream is generated. When the meniscus contacts the substrate, the platform begins to move at a speed (plotting speed) of 0.6 mm s−1, and with an acceleration of 3.75 mm s−2. A pattern with consistent line width is realized, as shown in Fig. 8(a). Fig. 8(b) shows the starting position in more detail. The start of the scribed line is very thin and this is exactly what we expect for higher resolution printing. As a control experiment, voltage is not applied until the liquid volume at the nozzle is large enough. Specifically, Vi = 514 nL. The meniscus contacts the substrate, with a large lump of liquid deposited, shown in Fig. 8(c). In some previous literature, there was reported a drop of liquid at the start position of the printing, likely of the same origin. This large liquid drop seriously interferes with subsequent printing. Specifically, the adjacent line moves towards and finally touches the large liquid drop at the start point. For the third line, a behaviour known as fibre pulsing29 is observed, marked by the red rectangle. Fibre pulsing is due to mismatch between the jetting speed and the plotting speed. However, we are not sure whether the fibre pulsing here is directly caused by the large liquid drop at the starting point.
4. Conclusions
Experiments are performed to improve the resolution at the start-up stage of direct writing, by using a home-built E-FDM system. Melted PCL is chosen as printing material. The nozzle is fixed 2 mm above the substrate. The temperatures of the nozzle and the substrate are held steady. At a set initial volume Vi, a 2.7 kV voltage is applied to the nozzle, at fixed ramping rate. It is found that three deformation processes can appear, leading to different contacting behaviors with the substrate. When Vi is sufficiently small (less than about 270 nL in this experiment), a fine jet with diameter much smaller than the nozzle diameter appears. When Vi is sufficiently large, the liquid makes contact with the substrate in a spindle shape, and with a large lump of liquid delivered. For Vi in the intermediate range, the deformation of the meniscus tends to produce a jet, but it fails. The length of the meniscus decreases slightly after reaching the maximum. Possible interpretations of the experimental results are given. Obviously in actual application, for better printing resolution at the start position, ramping voltage at sufficiently small liquid volume Vi is suggested.Conflicts of interest
There are no conflicts to declare.Notes and references
- K. S. Boparai, R. Singh and H. Singh, Rapid Prototyp. J., 2016, 22, 281–299 CrossRef.
- I. Matai, G. Kaur, A. Seyedsalehi, A. McClinton and C. T. Laurencin, Biomaterials, 2020, 226, 119536 CrossRef CAS.
- E. Mathew, G. Pitzanti, E. Larraneta and D. A. Lamprou, Pharmaceutics, 2020, 12 Search PubMed.
- G. Gaal, M. Mendes, T. P. de Almeida, M. H. O. Piazzetta, Â. L. Gobbi, A. Riul and V. Rodrigues, Sens. Actuators, B, 2017, 242, 35–40 CrossRef CAS.
- M. D. Monzón, I. Gibson, A. N. Benítez, L. Lorenzo, P. M. Hernández and M. D. Marrero, Int. J. Adv. Manuf. Technol., 2013, 67, 2717–2726 CrossRef.
- M. S. Onses, E. Sutanto, P. M. Ferreira, A. G. Alleyne and J. A. Rogers, Small, 2015, 11, 4237–4266 CrossRef CAS.
- G. Taylor, Proc. R. Soc. A, 1964, 280, 383–397 Search PubMed.
- D. Li and Y. Xia, Adv. Mater., 2004, 16, 1151–1170 CrossRef CAS.
- A. Haider, S. Haider and I.-K. Kang, Arabian J. Chem., 2018, 11, 1165–1188 CrossRef CAS.
- T. Kong, H. A. Stone, L. Wang and H. C. Shum, Proc. Natl. Acad. Sci. U. S. A., 2018, 115, 6159–6164 CrossRef CAS.
- T. D. Brown, P. D. Dalton and D. W. Hutmacher, Prog. Polym. Sci., 2016, 56, 116–166 CrossRef CAS.
- T. M. Robinson, D. W. Hutmacher and P. D. Dalton, Adv. Funct. Mater., 2019, 29, 1904664 CrossRef CAS.
- B. Zhang, B. Seong, V. Nguyen and D. Byun, J. Micromech. Microeng., 2016, 26, 025015 CrossRef.
- C. Wei and J. Dong, J. Manuf. Process., 2014, 16, 257–263 CrossRef.
- Q. Chen, X. Mei, Z. Shen, D. Wu, Y. Zhao, L. Wang, X. Chen, G. He, Z. Yu, K. Fang and D. Sun, Opt. Lett., 2017, 42, 5106–5109 CrossRef CAS.
- X. Yu, M. Feng, R. Zhang, Y. Feng, H. You, F. Guo, S. Chen and D. Zhang, Org. Electron., 2017, 51, 442–445 CrossRef CAS.
- S. Y. Min, T. S. Kim, B. J. Kim, H. Cho, Y. Y. Noh, H. Yang, J. H. Cho and T. W. Lee, Nat. Commun., 2013, 4, 1773 CrossRef.
- M. A. Woodruff and D. W. Hutmacher, Prog. Polym. Sci., 2010, 35, 1217–1256 CrossRef CAS.
- H. Lian and Z. Meng, Mater. Sci. Eng. C Mater. Biol. Appl., 2017, 74, 117–123 CrossRef CAS.
- V. Speranza, A. Sorrentino, F. De Santis and R. Pantani, Sci. World J., 2014, 2014, 720157 CAS.
- A. L. Yarin, S. Koombhongse and D. H. Reneker, J. Appl. Phys., 2001, 90, 4836–4846 CrossRef CAS.
- C. Clanet and J. C. Lasheras, J. Fluid Mech., 1999, 383, 307–326 CrossRef.
- H. Sato, N. Kaji, T. Mochizuki and Y. H. Mori, Phys. Fluids, 2006, 18, 127101 CrossRef.
- A. J. Hijano, I. G. Loscertales, S. E. Ibanez and F. J. Higuera, Phys. Rev. E: Stat., Nonlinear, Soft Matter Phys., 2015, 91, 013011 CrossRef CAS.
- H. Zhang, C. Wang, R. Jia, F. Wang, Y. Wang, Z. Wang, X. Chen, X. Wang and J. Gui, Biomed. Microdevices, 2019, 21, 64 CrossRef.
- R. Reif, Fundamentals of Statistical and Thermal Physics, 2009 Search PubMed.
- D. Liu and C. Zhong, Polym. J., 2002, 34, 954–961 CrossRef CAS.
- O. J. Botlhoko, J. Ramontja and S. S. Ray, RSC Adv., 2017, 7, 33751–33756 RSC.
- G. Hochleitner, A. Youssef, A. Hrynevich, J. N. Haigh, T. Jungst, J. Groll and P. D. Dalton, BioNanoMaterials, 2016, 17, 159–171 Search PubMed.
| This journal is © The Royal Society of Chemistry 2021 |

