 Open Access Article
Creative Commons Attribution 3.0 Unported Licence
In situ electrochemical activation as a generic strategy for promoting the electrocatalytic hydrogen evolution reaction and alcohol electro-oxidation in alkaline medium†
Alireza Kardana,
Narges Ashraf b,
Zeynab Dabirifara and
Sara Khadempir
 *a
*a
aDepartment of Chemical Engineering, Quchan University of Technology, Quchan, Iran. E-mail: s.khadempir@qiet.ac.ir
bDepartment of Chemistry, Faculty of Science, Ferdowsi University of Mashhad, Mashhad, Iran
First published on 12th March 2021
Abstract
In situ electrochemical activation as a new pre-treatment method is extremely effective for enhanced electrocatalytic performances for different applications. With the help of this method, in situ surface modification of electrocatalyst is achieved without using pre-made seeds or complex synthesis procedure. Herein, with the purpose of finding an in situ and simple electrochemical activation protocol, the green synthesis of Au/Pd nanoparticles (AuPd) by means of polyoxometalate (POM) is reported. Structural analysis of the AuPd nanohybrid unveil the Au-core/Pd-shell structure which surrounded by POM. We propose a novel cathodic electrochemical activation in phosphate buffer solution which can greatly boost the electrocatalytic activity of the as-prepared AuPd and Pd electrocatalyst not only for hydrogen evolution reaction (HER) as a model of electro-reduction, but also for methanol and ethanol electro-oxidation reaction (MOR & EOR). For the HER in 1 M NaOH solution, after the electrochemical activation, the needed potential to drive a geometrical current density of 10 mA cm−2 significantly decreases from – 400 mV vs. the reversible hydrogen electrode (RHE) to −290 mV vs. RHE. For the EOR and MOR, electrochemically activated AuPd realized 3.4- and 2.9- fold increase in mass current density (mA mgPd−1) with respect to the pristine AuPd electrocatalyst, respectively.
Introduction
The world energy consumption growth and global environmental crisis create serious demand for replacing fossil fuels – as the main non-renewable source of energy around the world – with renewable energy sources like solar and wind.However, the large scale construction of renewable energy systems is still challenging due to technical barriers.1–4 Challenges such as reliability, durability and energy storage have a significant effect on the development of renewable energy technologies. At present, the key obstacle is “energy storage”, and one way to address the solution is converting electrical energy into a stable chemical product:3,5,6 for example, electrochemical water-splitting systems produce hydrogen gas and breathable oxygen via (eqn (1)) with the aid of electricity that comes from renewable sources energy.
| 2H2O (l) → 2H2 (g) + O2 (g) | (1) |
H2 is an attractive clean fuel and energy carrier owing to its high mass energy density. In these systems, the electrocatalyst-coated electrodes are inserted into water and powered by electricity. The interaction of the electricity, the electrocatalyst and water generate H2 via hydrogen evolution reaction (HER), and O2 through oxygen evolution reaction (OER).7,8
Moreover, direct alcohol fuel cells (DAFCs) consider to be a relevant technology to generate electricity via the electro-oxidation of low molecular weight alcohols such as methanol and ethanol. Meanwhile, to enable alcohol based fuel cells, one of the main issues is the requirement of useful electrocatalysts.9–13
Over the past decades, particular attention has been paid to design and development of efficient and low-cost electrocatalysts that are used in water-splitting systems and DAFCs. Different approaches has been suggested to improve the performance of these electrocatalysts, which include the use of a conductive support, incorporation of a second element, or employment of pre-treating methods such as electrochemical activation.14–16
In situ electrochemical activation (EA) has remarkable potential to obtain much greater electrocatalytic performances. The promising EA techniques generally involve simple electrochemical methods such as cathodic reduction,17,18 anodic oxidation,19,20 electrochemical incorporation,21,22 and electro-dissolution.23,24 According to this concept, surface of the electrocatalyst is modified by generation of active species which can promote the electron transfer kinetics. Various research groups have explored diverse EA methods and their associated mechanisms to develop electrocatalytic activity.25,26 However, further insights are still required to provide more information about EA processes.
In this study, we introduce an innovative in situ cathodic EA approach to enhance the electrocatalytic activity of AuPd core–shell nanoparticles as a vastly used electrocatalyst for diverse important electrocatalytic reaction such as hydrogen evolution and oxidation reactions (HER/HOR), oxygen evolution and reduction reactions (OER/ORR), alcohol electro-oxidation reactions, and so on. Based on the green chemistry rules, introducing environmentally friendly multifunctional substrates is a promising aspect.27,28 AuPd were synthesized using an environmentally friendly one-pot approach with the help of polyoxometalate (POM) as dual cooperative reducing and stabilizing agent. The proposed in situ cathodic EA process is applied to improve the electrocatalytic activity of AuPd not only towards HER as an electro-reduction representative, but also towards ethanol and methanol electro-oxidation reactions (EOR & MOR). Through the detailed electrochemical analysis, we disclose that the EA process has a significantly boosted effect on HER, EOR and MOR via the surface modification of the as-prepared electrocatalysts and would render as a generic strategy for fabrication of the advanced electrocatalysts for future practical applications.
Experimental section
Chemicals
Tetrachloroauric(III) acid trihydrate (HAuCl4·3H2O), palladium(II) chloride (PdCl2), sodium hydroxide (NaOH), isopropyl alcohol (C2H6OH), ethanol (C2H5OH), methanol (CH3OH), sodium dihydrogen phosphate dihydrate (NaH2PO4·2H2O), sulphuric acid (H2SO4) were obtained from Merck (Darmstadt, Germany). Phosphomolybdic acid (H3PMo12O40 – denoted as PMo12) was supplied from Sigma-Aldrich. Phosphate buffer solution (PBS, 0.1 M) was prepared by dissolving the appropriate amount of NaH2PO4·2H2O in deionized (DI) water and adjusting the pH to 8.4 by 0.1 M NaOH aqueous solution.Synthesis of nanocomposites
For the synthesis of Au@Pd/PMo12 (denoted as AuPd), 0.67 mg PdCl2 and 27.4 mg PMo12 were put into 100 mL DI water, followed by addition of 1.6 mg HAuCl4·3H2O (atomic ratio of Au to Pd was adjusted to 1![[thin space (1/6-em)]](https://www.rsc.org/images/entities/char_2009.gif) :
:![[thin space (1/6-em)]](https://www.rsc.org/images/entities/char_2009.gif) 1). Then, 10 mL of the as-prepared solution was put into a spectrophotometer cell. Subsequently, 2 mL isopropyl alcohol was added and the reaction mixture was irradiated by a UV mercury-vapor lamp (125 W) and continuously reacting for 2 h. The AuPd material is separated from the solution by centrifuging and washing with DI water for several times to remove any possible remaining ions. The collected nanocomposite is then dried for different form of characterization and catalytic activity studies. The Pd/PMo12 (denoted as Pd) nanocomposite was produced with the same process without addition of Au salt solution and also Au/PMo12 (denoted as Au) was synthesized by the same process without addition of Pd salt solution.
1). Then, 10 mL of the as-prepared solution was put into a spectrophotometer cell. Subsequently, 2 mL isopropyl alcohol was added and the reaction mixture was irradiated by a UV mercury-vapor lamp (125 W) and continuously reacting for 2 h. The AuPd material is separated from the solution by centrifuging and washing with DI water for several times to remove any possible remaining ions. The collected nanocomposite is then dried for different form of characterization and catalytic activity studies. The Pd/PMo12 (denoted as Pd) nanocomposite was produced with the same process without addition of Au salt solution and also Au/PMo12 (denoted as Au) was synthesized by the same process without addition of Pd salt solution.
Characterization
Nanocomposites were characterized with the help of scanning electron microscopy (SEM), transmission electron microscopy (TEM), high-angle annular dark-field scanning TEM (HAADF-STEM) and X-ray diffraction (XRD). The composition of the nanocomposite was determined by inductively coupled plasma mass spectrometry (ICP-MS). The –OH increments of AuPd were checked by Fourier transform infrared spectrometry (FT-IR).Working electrode fabrication
The catalyst ink was made as under below: the suitable amount of the as-prepared catalyst powder was dispersed in DI water and treated with ultrasound for 20 minute to obtain the 1.0 mg mL−1 aqueous suspension. The working electrode would be fabricated by drop casting the 3 μL of catalyst ink onto previously polished glassy carbon electrode (GCE, 2 mm in diameter, Azar electrode Co.) with 0.05 μm alumina slurry. Then, the modified GCE was dried under IR lamp.Electrochemical measurements
A μ-Autolab type III Potentiostat was employed to conduct the electrochemical experiments. A three-compartment electrochemical cell was fabricated using Ag/AgCl as the reference electrode, platinum wire as the counter electrode and modified GCE as the working electrode. Three electrochemical techniques were applied to investigate the electrochemical behaviour of electrodes containing linear sweep voltammetry (LSV), cyclic voltammetry and chronoamperometry.LSV was performed to test the HER activity in alkaline medium (1 M NaOH aqueous solution) at a scan rate of 50 mV s−1.
EOR and MOR were conducted by cyclic voltammetry in alkaline medium from −0.8 V to 0.4 V (vs. Ag/AgCl) at 50 mV s−1.
The chronoamperometry test with a fixed potential of −1.3 V (vs. Ag/AgCl) and 300 second duration in PBS (0.1 M, pH 8.4) was used to in situ electrochemical activation of the as-prepared electrocatalyst. Then the electro activated catalyst (hereafter called EA-catalyst) was washed with water and will be ready for further electrochemical investigations.
All potentials in HER study were referenced to a reversible hydrogen electrode (RHE) by the following equation:29
| ERHE = EAg/AgCl + 0.059 × pH + E0Ag/AgCl |
Results and discussion
Characterization experiments
HAADF-STEM image of AuPd (Fig. 1a) shows a clear contrast between the brighter and darker layer that verifies the core@shell structure. Also, SEM (Fig. S1†) and TEM images (Fig. S2†) of AuPd represent nanoparticles with diameter of about 25 nm. Moreover, cross-sectional EDS line scan profiles (Fig. 1b) obtained from the HAADF-STEM image validate that Au core is surrounded by Pd shell. It is noted that this profile was tuned to determine Pd and Au elements. In addition, individual TEM image of AuPd (Fig. 1c) includes more information. Three separate regions is obviously seen in the image: a dense core at the centre as a dark area designated with Au, then an intermediate shell covering the core labelled Pd, and an outer layer marked PMo12 playing the efficient capping role for AuPd. These data are also supported by EDS spectra (Fig. S3†).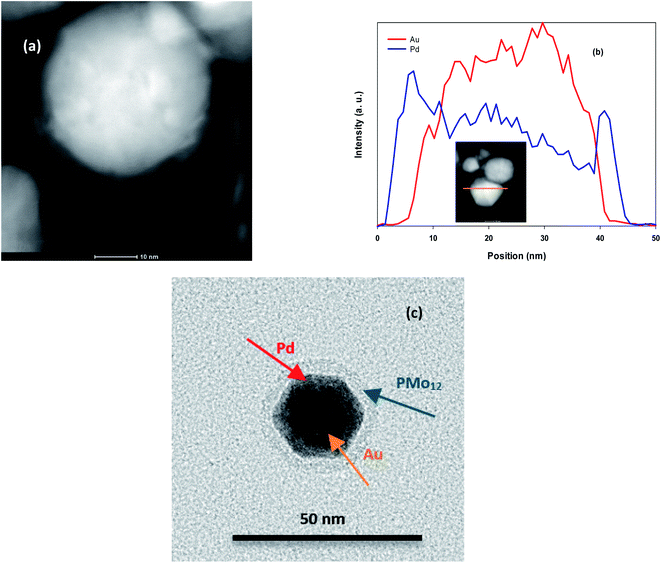 | ||
| Fig. 1 (a) HAADF-STEM image of AuPd, (b) EDS line scan profile. The inset in (b) corresponds to the HAADF-STEM image of AuPd, (c) TEM image of AuPd. | ||
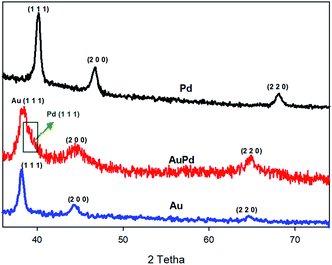
The crystalline structure of materials can be checked by XRD analysis. Fig. 2 provides the XRD patterns of the as-made AuPd, Au, and Pd. For both of the Au and Pd, three diffraction peaks correspond to the (1 1 1), (2 0 0), (2 2 0) planes are observed, which can be ascribed to the fcc structure of Au and Pd metals (JCPDS: 01-071-4073 for Au and 01-071-3757 for Pd).30,31 Also, the diffraction peaks for the AuPd are attributed to the fcc structure of the metals. When compared to the monometallic nanoparticles, the peak position of bimetallic AuPd are very close to those of the Au rather than the Pd, indicating that the Au core is not significantly strained. Nevertheless, there is an apparent shoulder (marked by green arrow in Fig. 2) that superimposed with the Au (1 1 1) peak, suggesting the very thin layer of the Pd shell. The position of this shoulder – Pd (1 1 1) peak – has been negatively shifted with respect to the XRD pattern of monometallic Pd, which could be related to a lattice expansion of about 2.2% to 2.5%, owing to the large strain induced by lattice mismatch between the Au core and the Pd shell.32,33
On the other hand, the characteristic peaks of the PMo12 are not detected in the XRD spectra of AuPd, inferring that the PMo12 clusters are in the dispersed amorphous state, till in the crystalline state.34
Surface properties of nanoparticles can be further characterized by the application of cyclic voltammetry (CV) technique. Fig. S4† depicts the multi-scan cyclic voltammogram of the AuPd modified GCE acquired in 0.5 M H2SO4 solution. In the cathodic scan of the first cycle, only the Pd oxide reduction peak is visible, i.e., the surface is exposed to Pd atoms. As the cycle number increases, the Au oxide reduction peak also appears and its intensity gradually increases; whilst the intensity of the Pd oxide reduction peak decreases, so the continuous changes in the surface property of the AuPd is happened due to electrochemical dissolution of Pd, which is well documented in acidic media.35,36 In other words, continual dissolution of Pd leads to the detection of Au, indicating a core@shell structure where a core of Au atoms is covered by a shell of Pd atoms.
In situ electrochemical activation procedure
To demonstrate the effect of electrochemical activation on the performance of the as-prepared electrocatalysts, HER was considered as a reductive electrochemical process, while MOR and EOR were studied as oxidative processes.HER study
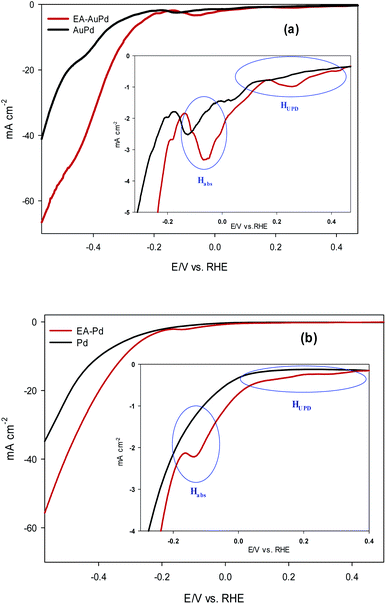
The HER electrocatalytic activity of AuPd and EA-AuPd electrocatalysts were investigated in 1 M NaOH solution using the LSV method and geometric polarization curves (I–V plot) has been shown in Fig. 3a. In order to evaluate the electrocatalytic performance of the electrocatalysts, the overpotential values corresponding to the current density of 10 mA cm−2 (η10) and 50 mA cm−2 (η50) are considered as important criteria.37 For AuPd, η10 and η50 are obtained to be −400 and −600 mV; while for EA-AuPd, η10 and η50 are −290 and −450 mV, respectively. The same trend was obtained for Pd and EA-Pd as shown in Fig. 3b and also for Pd/C and EA-Pd/C (Fig. S5†). These results verify that the activated electrocatalysts deliver higher cathodic currents compared to the non-activated electrodes at same potentials. Moreover, Tafel slope, another important measure for evaluating the performance of the electrocatalysts, was obtained for AuPd, EA-AuPd, Pd and EA-Pd (Table 1). From the results, it is realized that the Tafel slopes for the activated electrocatalysts are lower than those of the non-activated electrocatalysts, which means that the energy needed to raise the current is lower for activated electrocatalysts. All of the above evidences implies that the HER has boosted by applying the EA process.| Tafel slope | Pd | AuPd |
|---|---|---|
| Non activated (mV dec−1) | 280 | 250 |
| Electro-activated (mV dec−1) | 245 | 224 |
To investigate the mechanism of the EA process, we commence our discussion by analysing the results of chronoamperometry (CA) responses. Fig. 4a shows the chronoamperograms recorded during the EA stage of AuPd, Pd and Pd/C in PBS (pH 8.4), indicating an electrochemical reduction process is carried out at the electrode surfaces. Moreover, CV was employed to further realize what happens throughout the EA stage at the corresponding applied potential (−1.3 V). Fig. 4b represents the CVs of Pd and AuPd within the potential range of 0.6 to −1.5 V in PBS (pH 8.4). The acute increase of cathodic current behind the −1.1 V corresponds to the electrochemical HER in alkaline media, which is supposed to be as eqn (2).2,37
| 2H2O + 2e− → H2 + 2OH− | (2) |
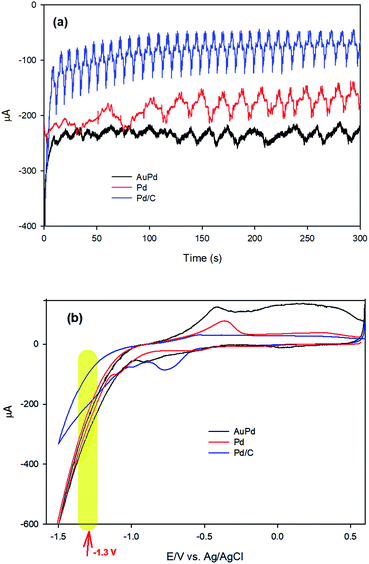 | ||
| Fig. 4 (a) Chronoamperograms of AuPd, Pd and Pd/C at −1.3 V in PBS (pH 8.4), (b) cyclic voltammograms (CV) of AuPd, Pd and Pd/C in PBS (pH 8.4), scan rate: 50 mV s−1. | ||
So, it can be concluded that HER occurs at the applied activation potential during the EA process. Therefore, it is valuable to describe what happens during HER in alkaline media.
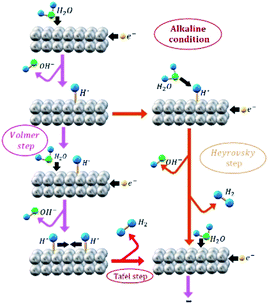
In order to distinguish between the HER that occur during EA process and the HER as an electro-reduction reaction model, from now on these processes will be identified by “EA-HER” and “HER”, respectively. It has been generally accepted that HER consists of three possible reactions. Scheme 1 illustrates the HER pathway under alkaline condition. In the first step, which is called Volmer (eqn (3)), electrochemical dissociation of water molecules – as a unique proton donor in neutral and alkaline media – to the adsorbed H* and OH− intermediates occurs:
| H2O + e− → H*+ OH− (Volmer) | (3) |
The second step is either Heyrovsky (eqn (4)) or Tafel (eqn (5)) step.
| H2O + H*+ e− → H2 + OH− (Heyrovsky step) | (4) |
| 2H* → H2 (Tafel recombination step) | (5) |
Based on the obtained Tafel slope values that are all more than 120 mV dec−1 (Table 1), it can be concluded that Volmer reaction is the rate determining step (r.d.s) in the HER mechanism, including the adsorption of water molecules and cleavage of H–OH bonds at the surface of the AuPd and Pd electrocatalysts in alkaline media, which requires high energy consumption.
Now, it is useful to consider the focused LSVs before and after the EA process (see inset of Fig. 3a and b). The LSVs consist of three distinct areas: (i) the adsorption of underpotentially deposited hydrogen (HUPD) which is the hydrogen atoms adsorbed at more positive potentials predicted by Nernst equation for the hydrogen reaction, (ii) the absorption of hydrogen atoms into the palladium lattice (Habs), and (iii) H2 evolution at last.39–43 The inset in Fig. 3a and b demonstrate that all of the above three processes are facilitated after EA step. The evidence for this can be sought in the fact that the features of the LSVs differ clearly before and after the EA process. A quick glance at the LSVs reveals that the signals corresponding to HUPD, Habs and H2 evolution have shifted towards more positive potentials and become sharper compared to the poorly defined signals before the EA process. It should be noted that the features of HUPD signal is under the influence of the Volmer reaction. The more Volmer reaction is facilitated, the more HUPD signals shifts towards positive potentials. Therefore, by comparing the signals attributing to HUPD before and after the EA process, it can be concluded that the kinetics of Volmer reaction has considerably improved after the EA process. The reason for this facilitation can be explained by considering that during EA-HER, OH− ions are generated and captured within the nanoscopic cavities of the electrocatalyst and entrapped such that they cannot be removed even by washing.44 These entrapped OH− ions (denoted as Pd/OH−ent) provide active sites for adsorption and cleavage of H–OH bonds by establishment of the Pd/OH−ent⋯OH2 activated complex. Indeed, hydrogen bonding between Pd/OH−ent and H2O promotes the surface hydrophilicity and lowers the energy barrier for water dissociation that results in higher electrocatalytic activity of EA-AuPd for the HER.38,45–47 To further evaluate this hypothesis, the HER electrocatalytic activities of the EA-AuPd and AuPd were also investigated in acidic media (Fig. 5). On the basis of experimental results, it is revealed that in acidic medium in which the proton donor is H3O+ instead of H2O, the electrocatalytic activity of EA-AuPd and AuPd do not differ substantially; since the formation of Pd/OH−ent⋯OH2 complex is irrelevant.38
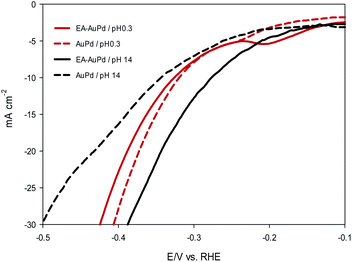 | ||
| Fig. 5 LSV polarization curves of AuPd and EA-AuPd electrocatalyst for the HER. Measurements were conducted in 0.5 M H2SO4 (pH 0.3) and in 1 M NaOH (pH 14) at a scan rate of 50 mV s−1. | ||
MOR and EOR study
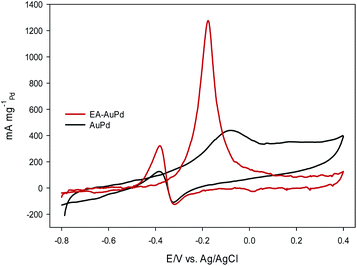
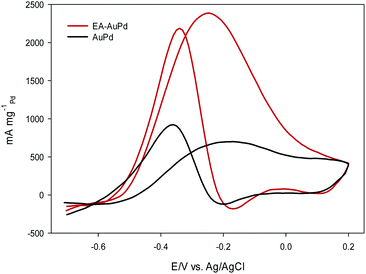
Fig. 6 and Fig. 7 show the CVs of EA-AuPd and AuPd in methanol and ethanol containing alkaline solutions, respectively. The features of CVs for the MOR and EOR under alkaline conditions are matched to the literature reports.48–51 The anodic current peak in the forward scan is assigned to the oxidation of freshly chemisorbed small alcohol (methanol or ethanol) molecule. There is an ambiguity about the origin of cathodic current peak, such that some authors attributed it to the oxidation of alcohol,52,53 while the others ascribed this to the removal of carbonaceous chemicals intermediates that are generated during the anodic scan.51,54 Therefore, we focus on the anodic peak as a basis for comparison of catalytic activity in the following sections.It was perceived that the anodic peak current densities in the forward sweep are 1270 mA mg−1Pd and 440 mA mg−1Pd for EA-AuPd for AuPd, respectively, showing that the catalytic activity of EA-AuPd is 2.9 times greater than that of AuPd for MOR. Also, the MOR anodic peak potential for EA-AuPd is about 100 mV lower than that for AuPd. Through the use of EA-process the same results were also obtained for EOR. Fig. 7 indicates that the electrocatalytic activity of EA-AuPd is 3.4 times greater than that of AuPd. The similar outcomes were acquired for Pd, and Pd/C (Fig. S6 and S7†).
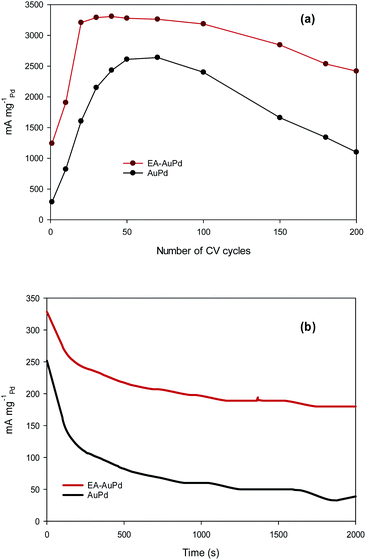
Besides the electrocatalytic activity, the durability (long-term stability) is still a crucial challenge in material development for long-term practical applications. To examine this purpose, accelerated durability test (ADT) and chronoamperometric measurement were conducted at the EA-AuPd and AuPd electrocatalysts.55 The ADT for the electrodes was performed by applying successive CV aging (200 cycles) from −0.8 V to 0.4 V (vs. Ag/AgCl) in the presence of methanol and NaOH solution (Fig. S8a and b†). For both EA-AuPd and AuPd, the initial increase in the anodic peak currents are observed which is assigned to the more accessible active sites. Also, Fig. 8a shows the dependence of the anodic peak current on the cycle number (obtained from Fig. S8a and b†). For EA-AuPd, the anodic peak current increases up to the 20th cycle; and then, it remains almost unchanged up to the 100th cycle. For AuPd, the anodic peak current increases up to 50th cycle and then it is stable only within 50th and 70th cycle; suggesting the durability of EA-AuPd is considerably higher than that of AuPd through the ADT.31,56–60
Chronoamperometric experiment was evaluated by setting the working electrodes at the selected potential in which the electro-oxidation of methanol is warranted. Fig. 8b represents the chronoamperograms of EA-AuPd and AuPd that were recorded in methanol and NaOH solution at the appropriate potential of −0.18 V (vs. Ag/AgCl). As expected, the initial decay in current densities is possibly attributed to the accumulation of reaction intermediates during the MOR. Afterwards, the currents gradually decrease and finally achieve to a pseudo steady state condition.31,59–63 However, it is noticeably that the EA-AuPd has more than 2.5-fold higher current density over AuPd during the entire period (2000 s) of the test. It is noted that the same issue is obtained from chronoamperometry experiment for AuPd and EA-AuPd in ethanol solution (Fig. S9†). This results demonstrate that at the investigated potential, the EA-AuPd has a better electrochemical stability. All of the above results confirm the electrocatalytic superiority of EA-catalysts towards MOR and EOR.
In order to investigate the effect of the EA process on MOR and EOR, following discussion is required. Fig. 9a, b and also Fig. S10† show the CVs for AuPd, Pd and Pd/C in 1 M NaOH solution within the potential window of −1 V to 0.4 V, before and after the EA process. Substantial changes occur in the voltammetric response of the electrocatalysts before and after the EA process. The following features must be pointed out: (i) after the EA process, the cathodic peaks in the hydrogen region (potentials below −0.6 V) are appeared in contrast to unclear peaks before the EA treatment, implying that the hydrogen absorption and desorption processes are more favoured at the surfaces of the EA electrocatalysts (ii) the potential in a region between ca. −0.6 V to −0.2 V that corresponds to the adsorbed hydroxyl species (OHads) at the surface of the electrocatalyst, show higher currents after the EA process. This could be attributed to the presence of Pd/OH−ent that are provided by the EA-process. By the bi-functional theory, the partial and total oxidation of primary alcohols to RCOO− and CO32− needs the adequate OHads species at the surface of the electrocatalyst in alkaline medium (Scheme 2).60,64,65 Based on the well accepted reaction mechanism (eqn (6), (7), (8) and (10)), the Pd-OHads group is a key reactant in the r.d.s of EOR and MOR (eq. (9)).48,66–69 In this regard, due to the presence of Pd/OH−ent (from the EA-process), the larger quantities of oxygenated groups are adsorbed at the surface of the electrode and provides more species in terms of Pd–OHads as evidenced by the improved current density as well as the negative shift of anodic peak potential.
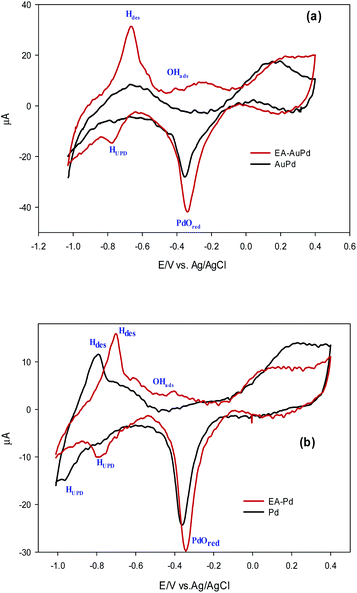 | ||
| Fig. 9 Comparison of CV curves in 1.0 M NaOH solution for the (a) AuPd and (b) Pd, before and after being subjected to EA process (scan rate 50 mV s−1). | ||
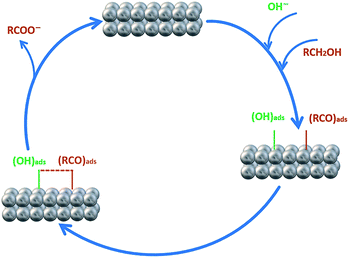 | ||
| Scheme 2 Schematic diagram of the electro-oxidation of primary alcohols (e.g., methanol and ethanol) at the Pd electrode in alkaline media. | ||
Moreover, in an effort to indicate the increasing of the Pd–OHads groups after the EA-HER, the FT-IR spectra of the AuPd and EA-AuPd were taken after cyclic voltammetry in 1 M NaOH solution (Fig. 10). The intensity of the band at 620 cm−1, which is attributed to the Pd–OHads, is higher for EA-AuPd, verifying the effective role of the EA process in the enhancement of the Pd–OHads at the surface of the electrocatalyst.58
| Pd + (RCH2OH)sol → Pd–(RCH2OH)ads | (6) |
| Pd–(RCH2OH)ads + 3OH− → Pd–(RCO)ads + 3H2O + 3e− | (7) |
| Pd + OH− → Pd–OHads + e− | (8) |
| Pd−(RCO)ads + Pd−OHads → Pd−(RCOOH) + Pd | (9) |
| RCOOH + OH− → RCOO− +H2O | (10) |
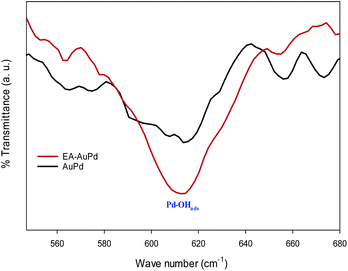 | ||
| Fig. 10 Comparison of FT-IR spectra of AuPd and EA-AuPd after being subjected to cyclic voltammetry in 1.0 M NaOH (potential range: −0.8 V to 0.4 V, scan rate 50 mV s−1). | ||
(iii) In the cathodic scan, the current density of PdO reduction peak increases due to the application of EA process with a subtle positive shift in the reduction potential. By calculating the reduction charge of PdO, it was revealed that the electrochemical active surface area50,70 (ECSA) has been increased about 20%.
Additionally, to verify the probable morphological surface alternations caused by the EA process, SEM technique was also used. It was found that the surface roughness of AuPd has increased compared to that before the EA process (Fig. S11†). Based on all of the above-mentioned results, it can be concluded that the EA process is in the favour of MOR and EOR.
Conclusions
In conclusion, an in situ cathodic electrochemical activation protocol is provided for the AuPd and Pd electrocatalysts to effectively expedite the HER, MOR and EOR activity in alkaline media. From the represented experimental evidences, we propose that the electrochemical active Pd/OH−ent species are generated on the surface of EA-AuPd and EA-Pd electrocatalyst. In the alkaline HER, tuning the surface hydrophilicity was achieved by forming the Pd/OH−ent⋯OH2 activated complex and therefore, promoting the electrocatalytic activity. On the other hand, in alkaline MOR and EOR, Pd/OH−ent species facilitate the adsorption of oxygenated groups, especially OH− ions in terms of Pd–OHads, which is a key reactant in MOR and EOR. We believe that this research offers a practical approach to expose the active species for enhanced electrocatalytic applications.Conflicts of interest
There are no conflicts to declare.Acknowledgements
The authors thank Dr Scott G. Mitchel at Instituto de Nanociencia y Materiales de Aragón (INMA), CSIC-Universidad de Zaragoza for helpful discussions and invaluable advices. All TEM, HAADF-STEM characterization was supported on the Advanced Microscopy Laboratory (University of Zaragoza).Notes and references
- L. Yang, H. Zhou, X. Qin, X. Guo, G. Cui, A. M. Asiri and X. Sun, Chem. Commun., 2018, 54, 2150–2153 RSC.
- X. Shang, B. Dong, Y.-M. Chai and C.-G. Liu, Sci. Bull., 2018, 63, 853–876 CrossRef CAS.
- K. Moorthy, N. Patwa and Y. Gupta, Heliyon, 2019, 5, e01166 CrossRef.
- T. Jiang, S.-a. Ansar, X. Yan, C. Chen, X. Fan, F. Razmjooei, R. Reisser, G. Montavon and H. Liao, ACS Appl. Energy Mater., 2019, 2, 8809–8817 CrossRef CAS.
- J. Azadmanjiri, V. K. Srivastava, P. Kumar, M. Nikzad, J. Wang and A. Yu, J. Mater. Chem. A, 2018, 6, 702–734 RSC.
- H. Wei, D. Cui, J. Ma, L. Chu, X. Zhao, H. Song, H. Liu, T. Liu, N. Wang and Z. Guo, J. Mater. Chem. A, 2017, 5, 1873–1894 RSC.
- T. J. Meyer, Nature, 2008, 451, 778–780 CrossRef CAS PubMed.
- J. Zheng, S. Zhou, S. Gu, B. Xu and Y. Yan, J. Electrochem. Soc., 2016, 163, F499–F506 CrossRef CAS.
- J. Qi, N. Benipal, C. Liang and W. Li, Appl. Catal., B, 2016, 199, 494–503 CrossRef CAS.
- C. Bianchini and P. K. Shen, Chem. Rev., 2009, 109, 4183–4206 CrossRef CAS PubMed.
- U. Shamraiz, Z. Ahmad, B. Raza, A. Badshah, S. Ullah and M. A. Nadeem, ACS Appl. Mater. Interfaces, 2020, 12(4), 4396–4404 CrossRef CAS PubMed.
- H. Zhang, J. He, C. Zhai and M. Zhu, Chin. Chem. Lett., 2019, 30, 2338–2342 CrossRef CAS.
- C. Zhai, M. Sun, L. Zeng, M. Xue, J. Pan, Y. Du and M. Zhu, Appl. Catal., B, 2019, 243, 283–293 CrossRef CAS.
- X. Li, X. Hao, A. Abudula and G. Guan, J. Mater. Chem. A, 2016, 4, 11973–12000 RSC.
- Z. F. Huang, J. Wang, Y. Peng, C. Y. Jung, A. Fisher and X. Wang, Adv. Energy Mater., 2017, 7, 1700544 CrossRef.
- Z. W. Seh, J. Kibsgaard, C. F. Dickens, I. Chorkendorff, J. K. Nørskov and T. F. Jaramillo, Science, 2017, 355, eaad4998 CrossRef PubMed.
- C. Hu, Q. Ma, S.-F. Hung, Z.-N. Chen, D. Ou, B. Ren, H. M. Chen, G. Fu and N. Zheng, Chem, 2017, 3, 122–133 CrossRef CAS PubMed.
- X. Chia, A. Ambrosi, Z. Sofer, J. Luxa and M. Pumera, ACS Nano, 2015, 9, 5164–5179 CrossRef CAS PubMed.
- W. Chen, H. Wang, Y. Li, Y. Liu, J. Sun, S. Lee, J.-S. Lee and Y. Cui, ACS Cent. Sci., 2015, 1, 244–251 CrossRef CAS PubMed.
- L. Xie, R. Zhang, L. Cui, D. Liu, S. Hao, Y. Ma, G. Du, A. M. Asiri and X. Sun, Angew. Chem., Int. Ed., 2017, 56, 1064–1068 CrossRef CAS PubMed.
- L. Cui, D. Liu, S. Hao, F. Qu, G. Du, J. Liu, A. M. Asiri and X. Sun, Nanoscale, 2017, 9, 3752–3756 RSC.
- R. Zhang, Z. Wang, S. Hao, R. Ge, X. Ren, F. Qu, G. Du, A. M. Asiri, B. Zheng and X. Sun, ACS Sustainable Chem. Eng., 2017, 5, 8518–8522 CrossRef CAS.
- S. Cherevko, A. R. Zeradjanin, G. P. Keeley and K. J. Mayrhofer, J. Electrochem. Soc., 2014, 161, H822–H830 CrossRef.
- L. Xing, M. A. Hossain, M. Tian, D. Beauchemin, K. T. Adjemian and G. Jerkiewicz, Electrocatalysis, 2014, 5, 96–112 CrossRef CAS.
- K. Xu, H. Cheng, L. Liu, H. Lv, X. Wu, C. Wu and Y. Xie, Nano Lett., 2017, 17, 578–583 CrossRef CAS PubMed.
- M. Tavakkoli, N. Holmberg, R. Kronberg, H. Jiang, J. Sainio, E. I. Kauppinen, T. Kallio and K. Laasonen, ACS Catal., 2017, 7, 3121–3130 CrossRef CAS.
- S. Iravani, Green Chem., 2011, 13, 2638–2650 RSC.
- H. Bar, D. K. Bhui, G. P. Sahoo, P. Sarkar, S. P. De and A. Misra, Colloids Surf., 2009, 339, 134–139 CrossRef CAS.
- S. Cobo, J. Heidkamp, P.-A. Jacques, J. Fize, V. Fourmond, L. Guetaz, B. Jousselme, V. Ivanova, H. Dau and S. Palacin, Nat. Mater., 2012, 11, 802–807 CrossRef CAS PubMed.
- J. Hu, X. Wu, Q. Zhang, M. Gao, H. Qiu, K. Huang, S. Feng, T. Wang, Y. Yang and Z. Liu, Langmuir, 2018, 34, 2685–2691 CrossRef CAS PubMed.
- J. Zhong, D. Bin, Y. Feng, K. Zhang, J. Wang, C. Wang, J. Guo, P. Yang and Y. Du, Catal. Sci. Technol., 2016, 6, 5397–5404 RSC.
- C. Hsu, M. Wei, Z. Wei and F. Liu, RSC Adv., 2016, 6, 24645–24650 RSC.
- C. H. Kuo, L. K. Lamontagne, C. N. Brodsky, L. Y. Chou, J. Zhuang, B. T. Sneed, M. K. Sheehan and C. K. Tsung, ChemSusChem, 2013, 6, 1993–2000 CrossRef CAS PubMed.
- M. H. Seo, S. M. Choi, H. J. Kim, J. H. Kim, B. K. Cho and W. B. Kim, J. Power Sources, 2008, 179, 81–86 CrossRef CAS.
- E. Pizzutilo, S. J. Freakley, S. Geiger, C. Baldizzone, A. Mingers, G. J. Hutchings, K. J. Mayrhofer and S. Cherevko, Catal. Sci. Technol., 2017, 7, 1848–1856 RSC.
- K. Deplanche, M. L. Merroun, M. Casadesus, D. T. Tran, I. P. Mikheenko, J. A. Bennett, J. Zhu, I. P. Jones, G. A. Attard and J. Wood, J. R. Soc., Interface, 2012, 9, 1705–1712 CrossRef CAS PubMed.
- J. Wang, F. Xu, H. Jin, Y. Chen and Y. Wang, Adv. Mater., 2017, 29, 1605838 CrossRef PubMed.
- P. F. B. D. Martins, P. P. Lopes, E. A. Ticianelli, V. R. Stamenkovic, N. M. Markovic and D. Strmcnik, Electrochem. Commun., 2019, 100, 30–33 CrossRef CAS.
- A. Zalineeva, S. Baranton, C. Coutanceau and G. Jerkiewicz, Langmuir, 2015, 31, 1605–1609 CrossRef CAS PubMed.
- T. Bhowmik, M. K. Kundu and S. Barman, ACS Catal., 2016, 6, 1929–1941 CrossRef CAS.
- C. G. Morales-Guio, L.-A. Stern and X. Hu, Chem. Soc. Rev., 2014, 43, 6555–6569 RSC.
- G. Denuault, C. Milhano and D. Pletcher, Phys. Chem. Chem. Phys., 2005, 7, 3545–3551 RSC.
- A. Zalineeva, S. Baranton, C. Coutanceau and G. Jerkiewicz, Sci. Adv., 2017, 3, e1600542 CrossRef PubMed.
- S. Khadempir, A. Ahmadpour, M. T. H. Mosavian, N. Ashraf, F. F. Bamoharram, R. Fernández-Pacheco, M. Jesús and S. G. Mitchell, RSC Adv., 2016, 6, 5359–5366 RSC.
- D. Strmcnik, P. P. Lopes, B. Genorio, V. R. Stamenkovic and N. M. Markovic, Nano Energy, 2016, 29, 29–36 CrossRef CAS.
- D. Strmcnik, M. Uchimura, C. Wang, R. Subbaraman, N. Danilovic, D. Van Der Vliet, A. P. Paulikas, V. R. Stamenkovic and N. M. Markovic, Nat. Chem., 2013, 5, 300 CrossRef CAS PubMed.
- R. Subbaraman, D. Tripkovic, K.-C. Chang, D. Strmcnik, A. P. Paulikas, P. Hirunsit, M. Chan, J. Greeley, V. Stamenkovic and N. M. Markovic, Nat. Mater., 2012, 11, 550–557 CrossRef CAS PubMed.
- J. Zhang, S. Lu, Y. Xiang, P. K. Shen, J. Liu and S. P. Jiang, ChemSusChem, 2015, 8, 2956–2966 CrossRef CAS PubMed.
- A. Ahmadpour, S. Khadempir, N. Ashraf, S. G. Mitchell and M. H. Ahangari, RSC Adv., 2019, 9, 37537–37545 RSC.
- S. Khadempir, A. Ahmadpour, M. T. H. Mosavian, N. Ashraf, F. F. Bamoharram, S. G. Mitchell and M. Jesús, RSC Adv., 2015, 5, 24319–24326 RSC.
- X. Wang, B. Tang, X. Huang, Y. Ma and Z. Zhang, J. Alloys Compd., 2013, 565, 120–126 CrossRef CAS.
- Y. Zhao, X. Li, J. M. Schechter and Y. Yang, RSC Adv., 2016, 6, 5384–5390 RSC.
- D. Y. Chung, K.-J. Lee and Y.-E. Sung, J. Phys. Chem. C, 2016, 120, 9028–9035 CrossRef CAS.
- P.-C. Su, H.-S. Chen, T.-Y. Chen, C.-W. Liu, C.-H. Lee, J.-F. Lee, T.-S. Chan and K.-W. Wang, Int. J. Hydrogen Energy, 2013, 38, 4474–4482 CrossRef CAS.
- R. Zerdoumi, L. Rößner and M. Armbrüster, J. Electrochem. Soc., 2019, 166, F1079 CrossRef CAS.
- Q. Tan, C. Du, G. Yin, P. Zuo, X. Cheng and M. Chen, J. Catal., 2012, 295, 217–222 CrossRef CAS.
- X. Cai, C. Liu, J. Liu, Y. Lu and Y. Zhong, Nano-Micro Lett., 2017, 9, 1–10 CrossRef PubMed.
- H. Sadhanala, R. Nandan and K. Nanda, Green Chem., 2016, 18, 2115–2121 RSC.
- S. Siwal, S. Matseke, S. Mpelane, N. Hooda, D. Nandi and K. Mallick, Int. J. Hydrogen Energy, 2017, 42, 23599–23605 CrossRef CAS.
- Q. Cui, S. Chao, Z. Bai, H. Yan, K. Wang and L. Yang, Electrochim. Acta, 2014, 132, 31–36 CrossRef CAS.
- Y.-T. Liu, Q.-B. Yuan, D.-H. Duan, Z.-L. Zhang, X.-G. Hao, G.-Q. Wei and S.-B. Liu, J. Power Sources, 2013, 243, 622–629 CrossRef CAS.
- J. Shi, X. Hu, J. Zhang, W. Tang, H. Li, X. Shen and N. Saito, Prog. Nat. Sci., 2014, 24, 593–598 CrossRef CAS.
- R. Rizo, A. Bergmann, J. Timoshenko, F. Scholten, C. Rettenmaier, H. S. Jeon, Y.-T. Chen, A. Yoon, A. Bagger and J. Rossmeisl, J. Catal., 2021, 393, 247–258 CrossRef CAS.
- T. Yajima, N. Wakabayashi, H. Uchida and M. Watanabe, Chem. Commun., 2003, 7, 828–829 RSC.
- E. Wang, J. Xu and T. Zhao, J. Phys. Chem. C, 2010, 114, 10489–10497 CrossRef CAS.
- K. I. Ozoemena, RSC Adv., 2016, 6, 89523–89550 RSC.
- M. Sawangphruk, A. Krittayavathananon, N. Chinwipas, P. Srimuk, T. Vatanatham, S. Limtrakul and J. Foord, Fuel Cells, 2013, 13, 881–888 CAS.
- J. Yin, S. Shan, M. S. Ng, L. Yang, D. Mott, W. Fang, N. Kang, J. Luo and C.-J. Zhong, Langmuir, 2013, 29, 9249–9258 CrossRef CAS PubMed.
- Z. Liang, T. Zhao, J. Xu and L. Zhu, Electrochim. Acta, 2009, 54, 2203–2208 CrossRef CAS.
- L. Gao, W. Yue, S. Tao and L. Fan, Langmuir, 2013, 29, 957–964 CrossRef CAS PubMed.
Footnote |
| † Electronic supplementary information (ESI) available. See DOI: 10.1039/d0ra07817d |
| This journal is © The Royal Society of Chemistry 2021 |

