 Open Access Article
Synthesis and properties of EPDM-based oil-absorptive gels with different types of EPDM and styrene derivatives
Minghua Zhangab,
Minmin Fan *c,
Shuhua Pengb,
Jianping Heb,
Mingyu Dengb,
Peixin Gongb,
Ke Wangc and
Xi Zhang
 *c
*c
aCollege of Polymer Science and Engineering, Sichuan University, Chengdu 610065, China
bJingkun Oilfield Chemistry Company, Kunshan 215300, China
cPolymer Research Institute, Sichuan University, Chengdu 610065, China. E-mail: fanminmin@scu.edu.cn; zhangxi@scu.edu.cn
First published on 5th January 2021
Abstract
A series of oil gels based on different types of ethylene–propylene–diene (EPDM) and styrene derivatives crosslinked with divinylbenzene (DVB) were synthesized by suspension polymerization. Effects of EPDM types and styrene derivatives on gel fraction, swelling ratio (q), solubility parameter (δ), average molecular weight between cross-links (Mc), and oil absorption and oil retention of EPDM-based oil-absorptive gels were studied. Characterization of EPDM-based oil-absorptive gels with different styrene derivatives was performed by Fourier transform infrared (FTIR) spectroscopy, scanning electron microscopy (SEM), and oil absorbency tests. The results showed that the double bond of the EPDM side chains was crosslinked with 4-tert-butyl styrene (t-BS), α-methyl styrene (α-MSt), styrene (St) or 4-methyl styrene (4-MSt) to form a three-dimensional network structure, respectively. Compared with the other three EPDM-based oil-absorptive gels, t-BS–EPDM–DVB (ESSB) has the best oil absorption and oil retention, which is mainly due to the fact that the substituent of t-BS is much larger than those of St, 4-MSt and α-MSt. The maximum oil absorption of the ESSB in chloroform was 23 g g−1. This investigation clearly distinguishes the influence of the synthetic raw materials of the EPDM-based oil-absorptive gels on their properties under study, which helps to optimize EPDM-based oil-absorptive materials according to actual applications.
1. Introduction
In recent years, leakage accidents have often occurred in the oil extraction and transportation of dangerous organic liquid cargoes. Once an accident occurs, the leakage must be controlled as soon as possible to minimize the harm to humans and the environment. In many oil spill treatment methods, oil-absorbing materials are widely used due to their high efficiency, economy and universal characteristics.1–3 Among them, the oil absorptive polymers with a three-dimensional hydrophobic network have been proven to be highly efficient and have attracted widespread attention due to their potential use in oil pollution treatment.4As known, ethylene–propylene–diene (EPDM) is an artificial rubber, which is macromolecular and oleophilic, and has a soft and long chain. Also, the double chemical bonds in EPDM are easily broken, generating monomer free radicals, and then causing cross-linking reactions under appropriate conditions to form a three-dimensional network structure that can swell but is insoluble in oil or oil-like solvent. Therefore, it is commonly used for the synthesize of oil absorptive gels due to its non-polar nature5 and excellent resistance to heat, light, oxygen, and ozone.6 Up to now, a series of EPDM-based oil absorptive polymers have been successfully synthesized, obtaining highly oil-absorptive gels that can be used for commercial purposes.7–11 And, the effects of EPDM, t-BS and DVB contents, initiator concentration, reaction temperature, and reaction time on the performance of oil gels were investigated. It is generally believed that the butyl group of 4-tert-butylstyrene may have a certain stereo effect to produce the cross-linked polymer with a large cavity in which oil can be filled. However, as far as we known, no one has conducted detailed investigation on the relationships between the oil absorption of oil gels and the type of EPDM, nor have we found any research focused on the effect of styrene derivatives on the performance of oil gels, which would provide very valuable information for the design of oil gels. Therefore, the influence of the synthetic raw materials of the EPDM-based oil absorptive gels on their oil absorptive properties needs to be understood deeply, which may be of great importance in their application.
Taking this into account, the aim of this work is to investigate the influence of EPDM types and styrene derivatives on the properties of EPDM-based oil absorptive polymers, which will provide guidance for the synthesis of oil gels with predetermined oil absorptive properties. In this study, a series of oil gels based on different types of ethylene–propylene–diene (EPDM) and styrene derivatives crosslinked with divinylbenzene (DVB) were synthesized by suspension polymerization. The structures of the synthesized polymers are identified by FT-IR spectra. Effects of EPDM types and styrene derivatives on gel fraction, swelling ratio (q), solubility parameter (δ), average molecular weight between cross-links (Mc), and oil absorption and oil retention of EPDM-based oil-absorptive gels were studied.
2. Experimental
2.1. Materials
Divinyl benzene (DVB; Fluka), styrene (St; Fluka), α-methylstyrene (α-MSt; Tokyo Chemical Industry Co., Ltd), 4-methylstyrene (4-MSt; Tokyo Chemical Industry Co., Ltd) and 4-t-butyl styrene (t-BS; Aldrich Chem, USA) were each purified by washing with 10% aqueous sodium hydroxide solution and water, dried over anhydrous sodium sulfate, and distilled under reduced pressure prior to use. Dibenzoyl peroxide (BPO; Kelong Chemical Reagent Factory, Chengdu, China) was dissolved in toluene (Kelong Chemical Reagent Factory, Chengdu, China) and precipitated by the addition of an equal volume of MeOH. Different grades of ethylene–propylene–diene monomer (EPDM) rubbers were supplied by DuPont Dow Elastomer (USA), and the composition details of each grade of EPDM rubber are shown in Table 1. The third monomer type in EPDM includes 2-ethylene-5-norbornene (ENB), dicyclopentadiene (DCPD), and 1,4-hexadiene (HD). All other chemicals and reagents were of analytical grade and were used without further purification.| Types of EPDM | Ethylene unit content (wt%) | Types of the third monomer | Third monomer content (wt%) |
|---|---|---|---|
| EPDM3090EM | 48 | ENB | 5.2 |
| EPDM4045 | 51 | ENB | 8 |
| EPDM4640 | 55 | ENB | 5 |
| EPDM3090 | 58 | ENB | 4.5 |
| EPDM2470 | 62 | ENB | 3.2 |
| EPDMJ3080 | 68 | ENB | 4 |
| EPDM3745 | 70 | ENB | 0.5 |
| EPDM7001 | 73 | ENB | 5 |
| EPDM301T | 67 | DCPD | 3.1 |
| EPDM1070 | Low | HD | Medium |
2.2. Synthesis of EPDM-based oil-absorptive gels with different types of EPDM and styrene derivatives
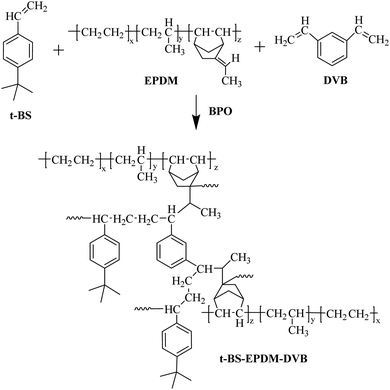
The EPDM-based oil-absorptive gel was prepared as following steps: first, 5 g of EPDM and different weights of St (4-MSt, t-BS or α-MSt) and DVB (0.03 g) were dissolved in 100 mL of toluene and 25 mL of cyclohexane, and charged into a round-bottom flask equipped with a thermometer, stirrer, constant pressure dropping funnel and reflux condenser. Then, 500 mL of gelatin (1 g) and calcium phosphate (0.5 g) aqueous solution was added to the flask, and 25 mL of BPO in toluene solution was added dropwise. The reaction was stirred in a constant temperature-controlled oil bath and maintained at 80 °C for 8 h, after which the reaction was heated to 90 °C and kept for 1 h. Finally, the EPDM-based oil-absorptive gel was collected by filtration, washed with dilute hydrochloric acid (0.1 M) and deionized water three times, and the resulting product (St–EPDM–DVB, α-MSt–EPDM–DVB, 4-MSt–EPDM–DVB or t-BS–EPDM–DVB) was dried in a vacuum oven at 60 °C for 24 h. For convenience, the St–EPDM–DVB, α-MSt–EPDM–DVB, 4-MSt–EPDM–DVB and t-BS–EPDM–DVB gels are abbreviated as ESSt, ESSM, ESSP and ESSB, respectively. Taking ESSB as an example, the chemical reaction route of EPDM-based oil-absorptive gel is shown in Fig. 1.2.3. Measurement of gel fraction
The obtained product was further extracted with tetrahydrofuran (THF) in a Soxhlet apparatus for 1 day, and finally the residual gel was dried in a vacuum oven at 60 °C for 24 h, and the weight loss was determined. According to the above procedures, the synthesized EPDM-based oil-absorptive gel was separated from the soluble mixtures of homopolymer, copolymer, and residual monomer. The gel fraction was estimated using the following formula (1):
 | (1) |
2.4. Fourier transforms infrared (FTIR) spectroscopy
Fourier transforms infrared (FTIR) spectra of styrene derivatives (St, 4-MSt, t-BS and α-MSt), EPDM and EPDM-based oil-absorptive gels (ESSt, ESSM, ESSP and ESSB) were recorded on a Nicolet 670 FTIR spectrometer (USA). The spectrum of each sample from 4000 to 400 cm−1 was collected with a resolution of 4 cm−1. The liquid styrene derivatives (St, 4-MSt, t-BS and α-MSt) were identified by the KBr disc method, and the solid EPDM-based oil-absorptive gels were analyzed by the film method.2.5. Thermogravimetric analysis (TGA)
The thermal stability of the synthesized EPDM-based oil-absorptive gels were examined by a TGA Q50 (TA Instruments, USA) analyzer. The test conditions are as follows: the mass of the sample is 2–3 mg, the flow rate of the nitrogen atmosphere is 50 mL min−1, the test temperature is 25–600 °C, and the heating rate is 10 °C min−1.2.6. Scanning electron microscopy (SEM)
The fractured sections of the EPDM-based oil-absorptive gels for SEM observations were obtained by liquid nitrogen quenching, coated with gold using an Emscope SM300 coater, and then observed on a Jeol JSM-5900LV electron microscope at an accelerating voltage of 20 kV.2.7. Swelling ratio (q) test and solubility parameter (δ) determination
The equilibrium swelling ratio of the extracted EPDM-based oil-absorptive gel in N-hexane, cyclohexane, toluene, chloroform, and acetonitrile was measured at room temperature. For each measurement, five samples of known mass were swollen in the target liquid for 48 h. The equilibrium swelling ratio (q) was calculated by the following eqn (2) for each sample and an average value was obtained:
 | (2) |
The solubility parameter (δ) is a basic property of all materials, and is often employed to describe the compatibility between polymers and liquids. The solubility parameter of a polymer can only be determined indirectly due to the high molecular weight of the polymer, making direct measurement of the enthalpy of evaporation impossible. The most convenient and direct method is the equilibrium swelling measurement method,12,13 which has been widely used to determine the solubility parameter of cross-linked polymers. The principle of this method is based on using a series of solvents with different and known solubility parameters to estimate the maximum swelling.14–16 Specifically, the cross-linked polymer should have different q values in solvents with different δ values (swelling ratio, see formula (2) for details). The closer the q value is to the δ value of the solvent, the larger the q value of the crosslinked polymer. Therefore, the δ value of the solvent corresponding to the maximum q value can be regarded as the δ value of the crosslinked polymer.17
2.8. Molecular weight between cross-linking points (Mc)
The average molecular weight (Mc) value between polymeric networking of ESSB gel was calculated by the Rehner theory, which indicates the cross-linking degree of the ESSB networks between two adjacent cross-linking points. According to this theory, the Mc value increases as the swelling ratio of ESSB gel increases. Specifically, the molecular weight between adjacent cross-linking points is calculated by the following eqn (3):
 | (3) |
Among them, the volume fraction of the polymer V2,s represents the ability of the ESSB gel to allow the solvent to diffuse into the network structure, which is obtained by the following eqn (4):
 | (4) |
 | (5) |
2.9. Oil-absorption and oil-retention test
The oil absorption of EPDM-based oil-absorptive gel was determined according to ASTM (F726-81). The sample with a thickness of 1 mm was placed in a closed glass container, and then immersed in different organic solvents (hexane, toluene, chloroform, diesel oil, and cyclohexane). The swollen sample was periodically taken out from the organic solvent, wiped with filter paper to remove the excess organic solvent on the surface, and then weighed on a balance and replaced into the same bath. This procedure of swelling and weighing was continued until the sample achieved a constant final weight. The equilibrium oil-absorbency of EPDM-based oil-absorptive gel Qeq was calculated by the following formula (6):
 | (6) |
The oil retention of EPDM-based oil-absorptive gel was determined by the following steps. Briefly, the sample that has reached the oil absorption equilibrium was centrifuged at a speed of 3000 rpm for 10 min, and then the mass of the sample before and after centrifugation was measured. At last, the oil retention of the sample was calculated according to the following formula (7):
 | (7) |
3. Results and discussion
3.1. Characterizations of the EPDM-based oil-absorptive gels with different styrene derivatives
The structure of the purified EPDM-based oil-absorptive gels (EPDM7001) with different styrene derivatives (St, 4-MSt, t-BS and α-MSt) were indicated by FTIR spectrometer. As shown in Fig. 2, the IR spectrum of EPDM exhibited characteristic absorption bands of EPDM at 723 cm−1 (rocking vibration of –(CH2)n–), 1378 cm−1 (symmetric C–H stretching vibration of –CH3), 1465 cm−1 (scissoring vibration of –CH2–), 1726 cm−1 (the double bond vibration), 2852 cm−1 (stretching vibration of the saturated hydrocarbon backbone of aliphatic symmetric C–H) and 2921 cm−1 (stretching vibration of the saturated hydrocarbon backbone of aliphatic alkyl asymmetric symmetric C–H). The spectrum of ESSt, ESSM, ESSP and ESSB after purification by extraction showed no absorption at 1726 cm−1 compared with the pure EPDM. This result proved that the double bonds of EPDM side chains were opened. Meanwhile, the peak assigned to C–H stretching vibration of –CH![[double bond, length as m-dash]](https://www.rsc.org/images/entities/char_e001.gif) CH2 in styrene derivatives (St, 4-MSt, t-BS and α-MSt) at 3030 cm−1, 3060 cm−1 and 3086 cm−1 disappeared, which proved that St, 4-MSt, t-BS and α-MSt have been successfully grafted onto the EPDM chains by polymerization, respectively. It is worth mentioning that the ESSt, ESSM, ESSP and ESSB used in the infrared test have been extracted to remove homopolymers and small molecules formed by styrene derivatives, indicating that styrene derivatives (St, 4-MSt, t-BS and α-MSt) successfully formed a cross-linked structure through suspension polymerization.
CH2 in styrene derivatives (St, 4-MSt, t-BS and α-MSt) at 3030 cm−1, 3060 cm−1 and 3086 cm−1 disappeared, which proved that St, 4-MSt, t-BS and α-MSt have been successfully grafted onto the EPDM chains by polymerization, respectively. It is worth mentioning that the ESSt, ESSM, ESSP and ESSB used in the infrared test have been extracted to remove homopolymers and small molecules formed by styrene derivatives, indicating that styrene derivatives (St, 4-MSt, t-BS and α-MSt) successfully formed a cross-linked structure through suspension polymerization.
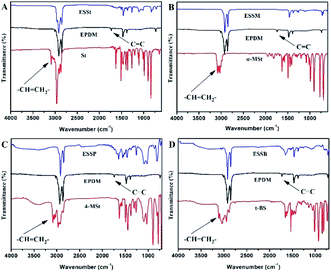 | ||
| Fig. 2 FTIR spectra of EPDM, styrene derivatives (St, 4-MSt, t-BS and α-MSt), (A) ESSt, (B) ESSM, (C) ESSP and (D) ESSB. | ||
3.2. Effect of styrene derivatives on EPDM-based oil-absorptive gels
The influence of styrene derivatives on the gel fraction of EPDM-based oil-absorptive gels (EPDM7001) was investigated. As shown in Fig. 3A, the gel fraction of EPDM-based oil-absorptive gels is in descending order as follows: ESSB > ESSP > ESSt > ESSM. This may be explained by the fact that the steric hindrance of the tert-butyl group in t-BS is much larger than that of the substituents in the other three styrene derivatives. The large steric hindrance of the tert-butyl group in t-BS may prevent the self-homopolymerization and make more possibility to form intermolecular crosslinks with EPDM, leading to a relatively complete crosslinking network under the same polymerization conditions. Because the cross-linked network has fewer defects, ESSB shows the largest gel fraction compared with the other three types of EPDM-based oil-absorptive gels.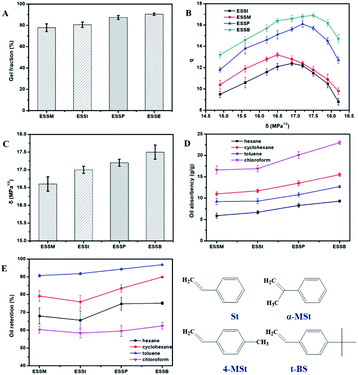 | ||
| Fig. 3 Effect of styrene derivatives on the (A) gel fraction, (B) swelling ratio (q), (C) solubility parameter (δ), (D) oil-absorption, and (E) oil-retention of EPDM-based oil-absorptive gels. | ||
The effects of styrene derivatives on the swelling ratio (q) and solubility parameter (δ) of EPDM-based oil-absorptive gels were also studied. The solubility parameter of EPDM-based oil-absorptive gels can be determined from swelling data obtained from a series of solvents with known solubility parameters. It can only be determined indirectly, and may be affected by changes in the chemical structure of the EPDM-based oil-absorptive gels: the number of crosslinks per unit volume, the distribution of substituents along the EPDM main chain, and the ethylene/propylene ratio and the amount and type of third monomer. Herein, the basic properties of the solvent used in the experiment are shown in Table 2, where ρs is the density of the solvent and Vm is the molar volume of the solvent. According to the literature, the δ value of EPDM is 16.0–16.5 MPa1/2, and the δ value of polystyrene is 19.0–22.5 MPa1/2. Therefore, the δ value range of the selected solvent is between 14.0–25.0 MPa1/2, ensuring that the δ value variation range of all EPDM-based oil-absorptive gels can be well satisfied. According to formula (2), the q values of EPDM-based oil-absorptive gels with different styrene derivatives in different solvents can be obtained. As shown in Fig. 3B, as the δ value of solvent increases, the q value of EPDM-based oil-absorptive gels all show a trend of first rising and then falling, and the δ values corresponding to the maximum value of q are all between 16.5–17.5 MPa1/2. In addition, the solubility parameters (δ) of EPDM-based oil-absorptive gels with different styrene derivatives are also different, which are in the following order: ESSB > ESSP > ESSt > ESSM (Fig. 3C).
| Solvent | ρs (g cm−3) | Vm (mL mol−1) | δ (MPa1/2) | Boiling point (°C) | Vapor pressure (kPa) |
|---|---|---|---|---|---|
| N-Hexane | 0.66 | 131.4 | 14.90 | 68 | 20.2 |
| Cyclohexane | 0.81 | 108.9 | 16.80 | 81 | 13.0 |
| Toluene | 0.89 | 106.6 | 18.16 | 110 | 3.8 |
| Chloroform | 1.48 | 80.5 | 20.69 | 61 | 26.2 |
The effect of styrene derivatives on the oil absorption and oil retention of EPDM-based oil-absorptive gels was studied. As shown in Fig. 3D and E, compared with the other three EPDM-based oil-absorptive gels, ESSB has the best oil absorption and oil retention, which is mainly due to the fact that the substituent of t-BS is much larger than those of St, 4-MSt and α-MSt. Obviously, the steric effect of the butyl group of t-BS may provide the ESSB with a large cavity that can be filled with oil, which will benefit the oil absorption and oil retention of ESSB. In addition, the order of EPDM-based oil-absorptive gels for oil retention of selected solvents is as follows: toluene > cyclohexane > chloroform > N-hexane. This is because the order of vapor pressure of the solvents at 25 °C and 101.3 kPa is as follows: toluene < cyclohexane < N-hexane < chloroform (Table 2). In general, the higher the vapor pressure, the lower the boiling point, the stronger the volatility, and the worse the oil retention of EPDM-based oil-absorptive gel. However, although the vapor pressure of chloroform is higher than that of N-hexane, its oil retention in the EPDM-based oil-absorptive gel is higher than that of N-hexane. This is mainly because chloroform is a more polar solvent than other solvents. In the process of forming the network structure of the oil-absorptive gel, the overall polarity is increased due to the destruction of the stereoregularity of the EPDM matrix, thereby increasing the affinity of the oil-absorptive gel and chloroform. In addition, the vapor pressure of chloroform is only slightly greater than that of N-hexane, so the influence of solvent polarity on the oil retention of the sample exceeds the vapor pressure.
The cross-sectional morphology of pure EPDM, ESSt, ESSM, ESSP and ESSB was characterized by scanning electron microscopy (SEM), in which the light regions correspond to hard phase (St, 4-MSt, α-MSt or t-BS) and the dark regions correspond to soft phase (EPDM). As shown in Fig. 4, the cross-section of pure EPDM is relatively smooth, indicating that the internal structure is uniform. In contrast, the cross-sections of ESSt, ESSM, ESSP and ESSB are relatively rough, and they all have microporous structures. Moreover, the porosity of ESSB is significantly higher than that of the other three EPDM-based oil-absorptive gels. The existence of microporous structure not only provides a channel for oil absorption, but also provides space for oil storage, which gives one of the reasonable explanations for the high oil absorption and high oil retention of ESSB. In view of the high oil absorption and high oil retention of ESSB compared with the other three EPDM-based oil-absorptive gels, ESSB will be used as an example to study the influence of the ethylene content, the third monomer type and its content, and the t-BS content on the properties of oil-absorptive gels in later experiments.
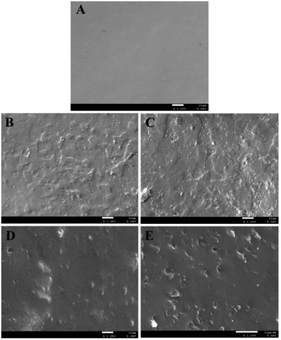 | ||
| Fig. 4 SEM images of the fracture surface morphology of (A) pure EPDM, (B) ESSt, (C) ESSM, (D) ESSP and (E) ESSB. | ||
3.3. Effect of ethylene content on ESSB
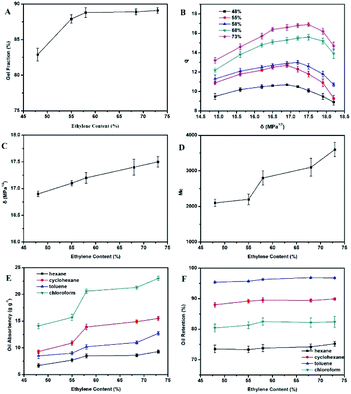
The influence of ethylene content on the gel fraction of ESSB was investigated. Under the same polymerization conditions, a series of ESSBs were prepared with EPDM containing different ethylene content. The selected EPDM types are EPDM3090EM, EPDM4640, EPDM3090, EPDMJ3080 and EPDM7001, with ethylene content ranging from 48% to 73% and similar ENB content ranging from 4.0% to 5.2%. As shown in Fig. 5A, as the ethylene content in EPDM increases, the gel fraction of ESSB first increases rapidly and then has a basically flat curve (generally between 85% and 90%). This may be explained by the fact that when the ENB content in EPDM is similar, the content of double bonds that can participate in the crosslinking reaction is basically unchanged. At this time, as the ethylene content in EPDM increases, the overall flexibility of EPDM increases, resulting in an increase in the probability of double bonds participating in the crosslinking reaction.The effects of ethylene content on the swelling ratio (q) and solubility parameter (δ) of ESSB are shown in Fig. 5B and C. As the δ value of solvent increases, the q value of ESSB increases first and then decreases. Especially, when binomial fitting is used to calculate the maximum value of the q-value curve, it is found that the δ value corresponding to the maximum value of the q-value curve has an obvious linear relationship with the ethylene content in EPDM. The specific relationship is as follows:
| δ = 0.0235x + 15.794 |
Obviously, the δ value gradually increases with the increase of the ethylene content in EPDM. Moreover, the δ value of ESSB with other ethylene content can be easily calculated, which is helpful for the molecular design in this type of synthesis experiment and effectively improves the efficiency of the experiment.
The average molecular weight (Mc) value between two adjacent cross-linking points of ESSB gel was calculated by the eqn (3). As shown in Fig. 5D, as the ethylene content increases, the Mc value between two adjacent cross-linking points of ESSB gradually increases. The main reason for this phenomenon is that as the ethylene content increases, the structural regularity of the EPDM segment increases, resulting in the formation of a relatively complete microphase structure of the ethylene unit. Affect by this, the collision probability of free radicals generated by t-BS and the third monomer ENB in EPDM decreases, and the probability of self-polymerization of t-BS increases, and the t-BS segment formed is relatively long.
The effect of ethylene content on the oil absorption and oil retention of ESSB was studied. As shown in Fig. 5E and F, the oil absorption and oil retention of ESSB to the same solvent gradually increase with the increase of the ethylene content in EPDM. For different solvents, the oil absorption order of ESSB is as follows: chloroform > cyclohexane > toluene > N-hexane, and the oil retention order of ESSB is as follows: toluene > cyclohexane > chloroform > N-hexane. As discussed earlier, as the ethylene content in EPDM increases, the Mc value between two adjacent cross-linking points of ESSB gradually increases and the crosslink density decreases. Therefore, in terms of oil absorption, the amount of oil that can be accommodated by the cross-linked network increases, resulting in an increase in the oil absorption of ESSB. Moreover, during the absorption process in chloroform, cyclohexane, toluene and N-hexane, organic solvent polarity plays a very important role. Generally, the polar solvent can be expected to easily dissolve the polar solute. Herein, the introduction of t-BS changes the polarity of the entire EPDM molecular chain, which increases the affinity of ESSB for polar solvents. Therefore, ESSB has a higher oil absorption for polar solvent chloroform than the other three solvents. In addition, another important reason for the maximum absorption of chloroform in ESSB is that the density of chloroform is higher than that of the other three solvents, so the absorbed mass is naturally the largest in the same three-dimensional network space. Meanwhile, the δ value of ESSB increases due to the introduction of t-BS and the formation of the cross-linked network structure, which is just between the δ values of cyclohexane and toluene. Therefore, compared with N-hexane, ESSB has higher oil absorption for cyclohexane and toluene. In terms of oil retention, the oil retention performance of ESSB is not only closely related to the vapor pressure of the solvent, but also related to the affinity of the solvent and the ESSB. Generally, due to the lower vapor pressures of toluene and cyclohexane, their oil retention in ESSB is higher than the other two solvents. However, as mentioned earlier, the stereoregularity of ESSB is destroyed due to the formation of the network structure, the overall polarity increases, and the affinity of ESSB to the polar solvent chloroform increases. Therefore, the influence of chloroform on the oil retention of ESSB exceeds that of its vapor pressure.
3.4. Effect of third monomer types on ESSB
As shown in Fig. 6A, the gel fractions of ESSBs containing different third monomer types are arranged in descending order as follows: ENB > DCPD > 1,4-HD (the selected EPDM types are EPDM2470, EPDM301T and EPDM1070). The main reason is that under the same polymerization conditions, compared with the other two third monomers, ENB has higher activity and therefore higher free radical formation efficiency, which is conductive to the formation of a more complete polymer network. The effects of third monomer types on the swelling ratio (q) and solubility parameter (δ) of ESSB are shown in Fig. 6B and C. As the δ value of solvent increases, the q value of ESSB first increases and then decreases, and the δ values corresponding to the maximum value of q are all between 17–17.5 MPa1/2. In addition, the solubility parameter (δ) of ESSB is related to the third monomer type in EPDM. When the third monomer in EPDM is ENB, the δ value of ESSB is the largest. The main reason may be that compared with the other two third monomers, the higher activity of ENB makes the cross-linked network less defective and the entire cross-linked system is more rigid.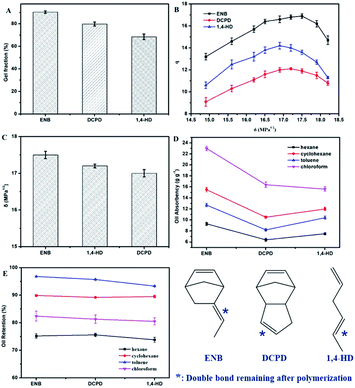 | ||
| Fig. 6 Effect of third monomer types on the (A) gel fraction, (B) swelling ratio (q), (C) solubility parameter (δ), (D) oil-absorption, and (E) oil-retention of ESSB. | ||
As shown in Fig. 6D and E, the oil absorption and oil retention of the ESSB with ENB as the third monomer is better than the ESSB prepared by EPDM containing the other two third monomers (DCPD and 1,4-HD). This phenomenon can be explained by the fact that ENB cause the formation of a more complete network of the copolymers and support more cavities in the network, which is corresponding to the fact shown in Fig. 6A. Moreover, the third monomer has basically no effect on the oil absorption and oil retention of ESSB in different solvents. For different solvents, the oil absorption order of ESSB containing different third monomer types is as follows: chloroform > cyclohexane > toluene > N-hexane, and the oil retention order of ESSB containing different third monomer types is as follows: toluene > cyclohexane > chloroform > N-hexane.
3.5. Effect of third monomer (ENB) content on ESSB
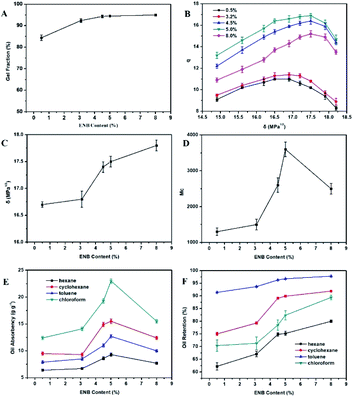
The influence of third monomer (ENB) content on the gel fraction of ESSB was investigated. The selected EPDM types are EPDM3745, EPDM2470, EPDM3090, EPDM4640 and EPDM4045, with ENB content ranging from 0.5% to 8.0%. As shown in Fig. 7A, with the increase of ENB content in EPDM, the gel fraction of ESSB first increases rapidly, then slowly increases, and finally tends to be flat. The main reason for this phenomenon is that as the ENB content increases, the reactive sites in the system increase, which makes it easier to quickly form a cross-linked structure. With the further increase of ENB content, the cross-linking structure in ESSB tends to be more perfect, the gel fraction of ESSB slowly increases and finally tends to be flat.The effects of ethylene content on the swelling ratio (q) and solubility parameter (δ) of ESSB are shown in Fig. 7B and C. Obviously, the δ value of ESSB gradually increases with the increase of ENB content in EPDM. As the δ value of solvent increases, the q value of ESSB all show a trend of first rising and then falling, and the δ values corresponding to the maximum value of q are all between 16.5–17.5 MPa1/2. Similarly, when binomial fitting is used to calculate the maximum value of the q-value curve, it is found that the δ value of ESSB corresponding to the maximum value of the q-value curve has an obvious linear relationship with the ENB content in EPDM. The specific relationship is as follows:
| δ = 0.161x + 16.55 |
Based on this formula, the δ value of ESSB with other ENB content can be easily calculated, which is helpful for the molecular design in this type of synthesis experiment.
The average molecular weight (Mc) value between two adjacent cross-linking points of ESSB gel was calculated by the eqn (3). As shown in Fig. 7D, as the ENB content in EPDM increases, the Mc value between two adjacent cross-linking points of ESSB increases first and then decreases. When the ENB content is 5%, the Mc value between two adjacent cross-linking points of ESSB is the largest. This is because as the ENB content increases, the number of active points in EPDM that can participate in the reaction increases, and the degree of disorder in the reaction increases, resulting in a decrease in cross-linking density and an increase in the Mc value between cross-linking points. However, when the ENB content continues to increase, the probability of free radical collisions between ENB and t-BS increases, and the cross-linking density increases, resulting in a decrease in the Mc value between cross-linking points.
As shown in Fig. 7E, as the ENB content in EPDM increases, the oil absorption of ESSB increases first and then decreases. Generally, the larger the volume of the oil that the ESSB can hold, the greater its oil absorption, which is proportional to the average molecular weight (Mc) of its crosslinking points. When the ENB content in EPDM is 5%, the oil absorption performance of ESSB is the best. Moreover, for the same solvent, the oil retention of ESSB increases with the increase of ENB content. For different solvents, the oil absorption order of ESSB with different ENB content is as follows: chloroform > cyclohexane > toluene > N-hexane, and the oil retention (Fig. 7F) order of ESSB with different ENB content is as follows: toluene > cyclohexane > chloroform > N-hexane.
3.6. Effect of t-BS content on ESSB
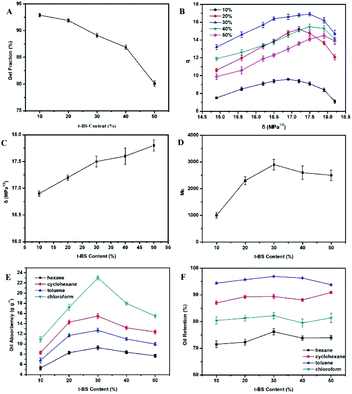
The influence of t-BS content on the gel fraction of ESSB was studied. As shown in Fig. 8A, as the t-BS content increases, the gel fraction of ESSB gradually decreases. The reason is that as the t-BS content increases, the relative reactive sites in EPDM decrease, and part of t-BS forms a homopolymer. The more the t-BS content, the higher the probability of homopolymer formation. When the t-BS content is too high, the product is almost poly(t-BS) and will be extracted by Soxhlet apparatus. Therefore, the gel fraction of ESSB reduces.The effects of t-BS content on the swelling ratio (q) and solubility parameter (δ) of ESSB are shown in Fig. 8B and C. As the δ value of solvent increases, the q value of ESSB all show a trend of first rising and then falling, and the δ values corresponding to the maximum value of q are all between 16.8–17.8 MPa1/2. Similarly, the δ value of ESSB gradually increases with the increase of t-BS content, and conforms to the following linear relationship.
| δ = 0.022x + 16.74 |
According to this formula, the δ value of ESSB with other t-BS content can be easily calculated, which facilitates the molecular design in subsequent such synthesis experiments.
As shown in Fig. 8D, the Mc value between two adjacent cross-linking points of ESSB increases first and then decreases with the t-BS content rising, and reaches the top value when the t-BS content is equal to 30%. Normally, as the content of t-BS increases, the probability of t-BS forming long chains increases, and the Mc value between crosslinking points of ESSB gradually increases. However, when the t-BS content is too high, the Mc value decreases, which attributes to two facts: on the one hand, when the t-BS content is too high, a large amount of t-BS radicals are generated in the initial reaction stage, which is unfavourable for the formation of long chains; on the other hand, when the t-BS content is too high, the relative reaction sites in EPDM are reduced, and the product is almost poly(t-BS), which will be extracted by the Soxhlet extractor.
As shown in Fig. 8E, as the t-BS content increases, the oil absorption of ESSB increases first and then decreases. When the t-BS content is low, the Mc value between cross-linking points increases with the increase of t-BS content, the cross-linking density of the network decreases, and the volume that can hold the oil increases. When the t-BS content is 30%, the oil-absorbing performance of ESSB is the best. However, as the t-BS content continues to increase, the cross-linking density of the network increases, and the volume of the cross-linked network that can hold the oil begins to decrease, so the oil absorption of ESSB decreases. Moreover, the t-BS content has basically no effect on the oil retention of ESSB (Fig. 8F). For different solvents, the oil retention order of ESSB with different t-BS content is as follows: toluene > cyclohexane > chloroform > N-hexane. The reason for this phenomenon is consistent with the previous discussion.
The influence of t-BS content on the thermal weight-loss behaviour of ESSB (EPDM7001) was studied by means of TGA and DTG, which provides helpful information regarding the thermal decomposition properties and phase structure of ESSB. As shown in Fig. 9, the initial degradation temperature of ESSB gradually decreases with the increase of t-BS content, which may be because the degradation of t-BS starts earlier than that of EPDM. It is worth mentioning that the initial decomposition temperature of ESSB decreases slightly with the introduction of t-BS, and the minimum initial decomposition temperature still reaches 398 °C, indicating that ESSB still maintains high thermal stability and is expected to be applied in high temperature environments. In addition, as the t-BS content increases, there is always only one maximum decomposition peak in the DTG curve of ESSB, and the maximum decomposition temperature of ESSB gradually decreases. This indicates that t-BS is indeed successfully grafted onto EPDM, and it is evenly distributed in the EPDM matrix without forming obvious self-aggregation regions.
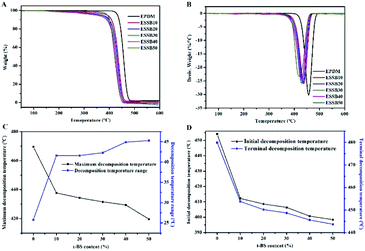 | ||
| Fig. 9 (A) TG and (B) DTG curves of ESSB with different t-BS content; The influence of t-BS content on the (C) maximum decomposition temperature and (D) initial decomposition temperature of ESSB. | ||
4. Conclusions
In conclusion, a series of oil gels based on different types of EPDM and styrene derivatives are successfully synthesized by suspension polymerization. It is found that the double bonds of the EPDM side chains are crosslinked with 4-tert-butyl styrene (t-BS), α-methyl styrene (α-MSt), styrene (St) or 4-methyl styrene (4-MSt) to form a three-dimensional network structure, and the porosity of ESSB is higher than that of ESSt, ESSM and ESSP. The larger the substituent of the styrene derivatives, the higher the oil absorption and the better the oil retention. For ESSB, the gel fraction of ESSB increases with the increase of ethylene content in EPDM, increases first and then became flat with the increase of ENB content in EPDM, and decreases with the increase of t-BS content. As the δ value of solvent increases, the q value of ESSB shows a trend of first rising and then falling. With the increase of ethylene content in EPDM, the Mc value between two adjacent cross-linking points of ESSB increases, so the oil absorption and oil retention of ESSB to the same solvent gradually increase. The oil absorption and oil retention of ESSB with ENB as the third monomer are better than those of the other two third monomers (DCPD and 1,4-HD), which is because ENB leads to the formation of a more complete network of the copolymers and supports more cavities in the network. With the increase of ENB content in EPDM, the oil absorption of ESSB increases first and then decreases, which is proportional to the average molecular weight (Mc) of its crosslinking points. When the ENB content in EPDM is 5%, the oil absorption performance of ESSB is the best. With the increase of t-BS content, the oil absorption and oil retention of ESSB increase first and then decrease, which is consistent with the Mc change trend. When the t-BS content is 30%, the Mc of ESSB appears maximum value, and the optimal oil absorption of ESSB is 23 g g−1 in chloroform. This study may be of use for determining the appropriate types of polymerization raw materials to obtain EPDM-based gels with predetermined oil absorptive properties, thereby facilitating the selection of the most appropriate oil absorbent for a specific absorption process.Author contributions
Minghua Zhang: data curation; methodology; writing – original draft. Minmin Fan: conceptualization; investigation; writing – review & editing. Shuhua Peng: supervision; formal analysis. Jianping He: supervision; validation. Mingyu Deng: supervision. Peixin Gong: formal analysis. Ke Wang: project administration. Xi Zhang: conceptualization; writing – review & editing.Conflicts of interest
There are no conflicts to declare.Acknowledgements
This work was funded by China Postdoctoral Science Foundation (grant no. 2017M623030).References
- M. O. Adebajo, R. L. Frost, J. T. Kloprogge, O. Carmody and S. Kokot, J. Porous Mater., 2003, 10, 159–170 CrossRef CAS.
- A. Bayat, S. F. Aghamiri, A. Moheb and G. R. Vakili-Nezhaad, Chem. Eng. Technol., 2005, 28, 1525–1528 CrossRef CAS.
- H.-M. Choi and R. M. Cloud, Environ. Sci. Technol., 1992, 26, 772–776 CrossRef CAS.
- H. X. Jin, B. Dong, B. Wu and M. H. Zhou, Polym.-Plast. Technol. Eng., 2012, 51, 154–159 CrossRef CAS.
- S. Davis, W. Hellens and H. Zahalka, in Polymeric Materials Encyclopedia, CRC Press, New York, 1996 Search PubMed.
- K.-G. Park, J.-G. Park, C.-S. Ha and W.-J. Cho, J. Appl. Polym. Sci., 1999, 74, 3259–3267 CrossRef CAS.
- M. H. Zhou and W. J. Cho, Polym. Int., 2001, 50, 1193–1200 CrossRef CAS.
- M. H. Zhou and W. J. Cho, J. Appl. Polym. Sci., 2002, 85, 2119–2129 CrossRef CAS.
- B. Wu and M. H. Zhou, Polym.-Plast. Technol. Eng., 2008, 47, 483–489 CrossRef CAS.
- B. Wu and M. H. Zhou, J. Appl. Polym. Sci., 2009, 112, 2213–2220 CrossRef CAS.
- B. Wu, M. Zhou and D. Lu, Iran. Polym. J., 2006, 15, 989 CAS.
- P. J. Flory and J. Flory, J. Chem. Phys., 1943, 11, 521–526 CrossRef CAS.
- E. E. Hamurcu and B. M. Baysal, Macromol. Chem. Phys., 1995, 196, 1261–1276 CrossRef CAS.
- T. B. Nielsen and C. M. Hansen, Polym. Test., 2005, 24, 1054–1061 CrossRef CAS.
- X. Su, B. Shi and L. Wang, J. Macromol. Sci., Part B: Phys., 2015, 54, 1248–1258 CrossRef CAS.
- Y. Z. Wang, L. Y. Bi, H. J. Zhang, X. T. Zhu, G. Y. Liu, G. X. Qiu and S. S. Liu, Polym. Test., 2019, 75, 380–386 CrossRef CAS.
- R.-G. Jin and Y.-Q. Hua, Polymer Physics, Chemical Industry Press, Beijing, 3rd edn, 2007 Search PubMed.
| This journal is © The Royal Society of Chemistry 2021 |

