 Open Access Article
Study of aerodynamic focusing lens stacks (ALS) for long focal length aerosol-assisted focused chemical vapor deposition (AAFCVD)
Han Lun Lu *a,
Lei Lib,
Xi Hui Liang
 a,
Jun Jun Wanga,
Ning Yang Liu*a and
Zhi Tao Chena
aInstitute of Semiconductors, Guangdong Academy of Sciences, Guangzhou 510650, PR China. E-mail: henserlu@sohu.com; iamlpo@126.com
bGuangdong Provincial Engineering Research Center for Online Source Apportionment System of Air Pollution, Institute of Mass Spectrometry and Atmospheric Environment, Jinan University, Guangzhou 510632, PR China
First published on 22nd January 2021
Abstract
Mask-free direct printing can alleviate the high cost and high consumption involved in photo-lithography for chip processing. Most of their technical routes are based on the traditional short focal length nozzles, which is suffered from higher probability of nozzle retardation or clogging as well as the higher mechanical burdens. While aerosol-assisted chemical vapor deposition (AACVD) has better deposition adaptability but usually lack of focused printing. In this study, a system that combines of long focal length ALS with AACVD, so called AAFCVD printing system has been developed. The single-point printing capability and aerosol precursor adaptability were verified, and the relationship between the single spot printing performance and the chemical reaction mechanisms were studied. Furthermore, a unique carbon injection effect brought by ALS was discovered. Finally, the linear graphics printing performances of the system were evaluated. This system is expected to become a new generation of high-performance mask-free printing system for chip manufacturing.
1. Introduction
The traditional semiconductor manufacturing processes rely on photo-lithography or electron beam lithography methods,1,2 resulting in high cost and high consumption of solvents. Mask-free micro-nano direct printing technology is expected to change this situation by minimizing cost and reducing waste.3,4 At present, the direct printing technology in micro-nano processing technology is mostly driven by fluid mechanics, including the use of single-stage nozzles,5–7 sheath air nozzles,8–10 ink-jet nozzles,11,12 etc. The first generation single-stage nozzle has a relatively simplified structure and the lowest cost. But the types of printing mediums are limited, and the focusing performance and versatility could not achieve the most ideal state. The second generation introduces the sheath airflow around nozzle brings stronger work stability, making it more controllable and flexible. Ink-jet printing nozzles are mainly operated for liquid working fluids. Through the integration and improvement of the above two generations of nozzles, with the pressure, thermo-methods and electrospray supplement, ink-jet printing achieved relatively stable and complex printing abilities. Based on the mature development of ink-jet printing technology, extraordinary progress has been made in the preparation of OLED panels.13–16 All of those nozzle technologies have been widely used in the mask-free direct printing. However, the traditional nozzle designs are inseparable from the short focal lengths for micrometers or millimeters,17–19 which may increase the chance of nozzle retardation or clogging. The focal efficiency will collapse when the distance from the substrate is extended to above 10 cm.20 Short focal distance reflects additional mechanical burdens for printing complex micro-nano structures such as deep layers and thick walls, thus limits the wider applications.Aerosol-assisted chemical vapor deposition (AACVD) has been widely used in the preparation of nanomaterials. Using the AACVD, Piccirillo et al.,21 fabricated hydroxyapatite-embedded TiO2 thin films and Taylor et al.22 synthesized nano-structured TiO2 coatings. AACVD exhibits good application value in the preparation of inorganic optoelectronic materials and has recently been extended to the deposition of organic perovskite quantum dots. Such as Basak et al.23 prepared CH3NH3PbI3 and Aamir et al.24 fabricated CsPbBr2I perovskite thin films, etc. AACVD inherits the characteristics of traditional CVD. On the other hand, the traditional CVD generally directly reacts and deposits in the reaction furnace chamber, while AACVD separates part of the chemical reaction from the furnace to the dedicated reaction chamber. The AACVD method introducing pre-reaction is adaptable for the precursors in the form of gases, solid particles or even liquid mist into active aerosols, supplemented by coating or nozzle spraying technologies to prepare better deposited film. These characteristics make it a wider range of precursor adaptability. Regrettably, most of the current AACVDs use masked coating or wide-area spraying for deposition operation. There are few attempts to apply it to 2D/3D direct focus printing of new semiconductor materials.
Robinson et al.25 first predicted that in the laminar and non-compressible air flow, small particles would aggregate after passing through the small holes, which directly led to the invention of the aerodynamic lens (ADL). With the design of single-stage aerodynamic focusing lens (SADL), an effective method for controlling the focusing and positioning of the particle beam by aerodynamic principles was obtained.26,27 Nevertheless, the SADL lacks adaptability and cannot effectively focus on particle beams with a wide range of particle size. To overcome these drawbacks, the aerodynamic lens stacks (ALS) has been gradually developed. The ALS connects multiple series of ADLs in a coaxial manner to further improve the performances not only obtaining wider particle size compatibility but also higher particle beam controllability.28–30 Although the ALS system has sporadic applications in other fields, it is still mainly designed and used as a sampler for aerosol mass spectrometers.31–33
In summary, short focal length restricts the traditional mask-free printing systems; while for AACVD, there is a lack of an effective focusing system to achieve printing deposition. In view of the compatibility of aerosol precursors naturally possessed by ALS and its long focal length, here we propose a system that combines ALS focusing with AACVD, so called AAFCVD printing system. In this study, the working device assemblies of the system were designed and optimized by the ANSYS Fluent™ software method. SEM and EDS were used to verify the single-point printing capability and aerosol precursor adaptability; the single particle analyse mass spectrometry (SPA-MS), the laser particle tracing and the ATR FTIR, were used to study the relationship between the single spot printing performance and the chemical reaction mechanism involving KH570 and KH560 aerosols; XPS depth profiling was used to study the interface contact in the printing process; finally, the linear graphics printing performances were evaluated. This system is expected to become a new generation of high-performance mask-free printing system.
2. Experimental
2.1 Materials
Polystyrene standards (sulfate latex beads in 8% w/v) were purchased from Thermo Fisher Co. LTD.; 3-glycidoxypropyltrimethoxysilane (KH560) and 3-methacryloxypropyltrimethoxysilane (KH570) were purchased from Nanjing Chengong Silicon Co. LTD.; absolute ethanol (CH3CH2OH 99.5%) was purchased from Energy Chemical Co. LTD.; soda glass (thickness 1.1 mm) was purchased from Guluoglass Co. LTD.; the ultra pure water was produced by Merck® Milli-Q™ Reference system. All materials were directly used as received.Targets of metals substrate: soda glass with 85 mm × 5 mm × 1.1 mm, deposited with 10 nm chromium and 120 nm gold by electron beam evaporation. Aerosol atomize: each 1.0 μL polystyrene sulfate latex with different size was dissolved in 50 mL pure water to obtain the standard PS latex precursor solutions. 15 μg of KH560 or KH570 were dissolved in 50 mL of 25%, 50% and 75% (v![[thin space (1/6-em)]](https://www.rsc.org/images/entities/char_2009.gif) :
:![[thin space (1/6-em)]](https://www.rsc.org/images/entities/char_2009.gif) v) ethanol water solutions to obtain 0.30 μg mL−1 precursor solutions. Solution was then put into aerosol atomizer (TSI Inc., Model 9302); an airflow at 1.0 mL min−1 was provided to the atomizer to generate aerosols.
v) ethanol water solutions to obtain 0.30 μg mL−1 precursor solutions. Solution was then put into aerosol atomizer (TSI Inc., Model 9302); an airflow at 1.0 mL min−1 was provided to the atomizer to generate aerosols.
2.2 Instruments designs
The ALS parameters as the aerosol mass spectrometer sampler were extensively investigated. In the classical ALS designs,27,34–36 the lens aperture sizes are between 0.52–8.00 mm, the focusable sizes are between 3–10![[thin space (1/6-em)]](https://www.rsc.org/images/entities/char_2009.gif) 000 nm, and the number of lens cascades are 3–7. But few of them have paid attention to the focal length. Based on the most defocus range of about 100 mm in the traditional printing nozzles and aerosol-assisted requirements as well as other experimental needs, the expected five ALS technical parameters were summarized in the following Table 1.
000 nm, and the number of lens cascades are 3–7. But few of them have paid attention to the focal length. Based on the most defocus range of about 100 mm in the traditional printing nozzles and aerosol-assisted requirements as well as other experimental needs, the expected five ALS technical parameters were summarized in the following Table 1.
| Lens cascades | Focusable size | Beam width | Focal length | Divergence angle |
|---|---|---|---|---|
| 5 | 200–3000 nm | 100–400 μm | ≥100 mm | ≤5 mrad |
The printing device was assembled as shown in Fig. 1A and B. The system is divided into three parts, including the aerosol generators, the aerodynamic focusing lens stacks (ALS) and the vacuum support components. The aerosol generator is a commercial aerosol atomizer (TSI Inc., Model 9302). The long focal length optimized ALS and nozzle system was designed by the expected technical parameters in Table 1. The ALS system was optimized by the use of ANSYS Fluent™ Aerodynamics and Particle Trace Software simulations (the result shown in Fig. 1D). The manufactured ALS design is shown in Fig. 1C. The software predicted that this ALS system could arrive the statement within beam width lower than 350 μm and divergence angle lower than 1.625 mrad.
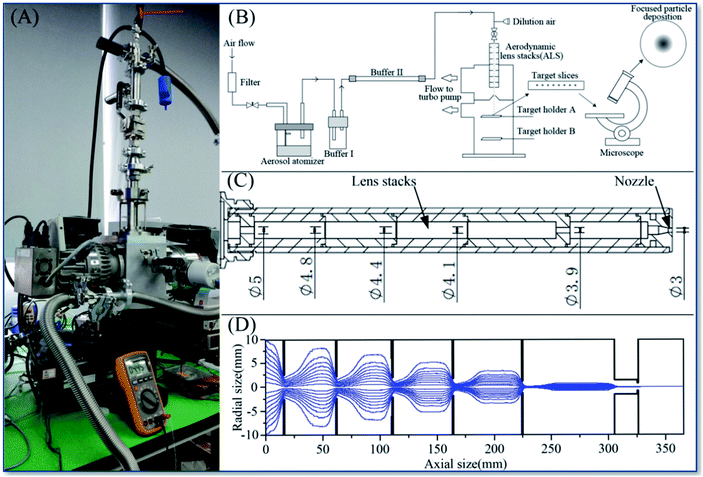 | ||
| Fig. 1 The scheme of ALS printing assembly (A), the experimental equipment (B), the design of long focal length ALS (C) and simulations of ALS particle beam (D). | ||
It was initially determined that the longest focal length should be greater than 200 mm, actually set it at 215 mm. Then the vacuum chamber with the sample holder structure was designed and manufactured. Fig. 2A shows a set of sample holders (A and B) set at the higher and lower positions respectively in the vacuum chamber of the equipment, and the distances of holder (A and B) from the ALS nozzle were 135 mm and 215 mm.
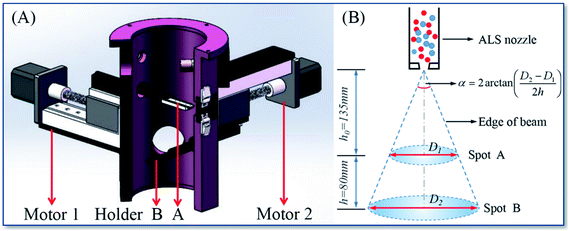 | ||
| Fig. 2 The design for target holders and vacuum chamber (A) and the calculation method of beam size and divergence angle (B). | ||
The principle of calculating the beam divergence angle is shown in Fig. 2B. Spot (A and B) were deposited on holder (A and B) respectively, and the diameters of spot (A and B) were measured by optical imaging, and the divergence angle α was calculated by the formula in the Fig. 2B.
2.3 Characterization methods
SEM images were taken by Phenom XL™ (Thermo Scientific, Inc.), using SE or BSE modes at 10 kV accelerating voltage. Before testing, about 3 nm thickness of platinum was sputtered on the targets by ion sputter (Quorum Q150V ES Plus). The EDS observations were held by EDAX® (AMETEK Inc.) module embedded in SEM. The SPA-MS were taken by SPAMS-0525™ (Guangzhou Hexin Instrument Co., Ltd.). Using 532 nm laser for online particle size survey, and 266 nm laser at 1.5 mJ for particle ionization. ATR FTIR spectrum were taken by Nicolet™ iS50 FTIR spectrometer (Thermo Scientific, Inc.). The XPS detection was taken by Nexsa™ System (Thermo Scientific Inc.), with CAE 150 eV pass energy for grand scanning and 50 eV for precision scanning, 0.1 eV resolution, depth profiling using a 4000 eV single beam Ar+ at 30° angle in 20 seconds etching procedure for each layer. Optical observation was held by CX31 (Olympus Corp. LTD.) and DM4000B (Leica Microsystems, Inc.) optical microscopes.3. Results and discussion
3.1 Performance of the long focal length ALS focusing deposition system
The polystyrene aerosol deposition experiment was used to calculate the focused beam width and divergence angle of this system.As shown in Fig. 3A, the spot (A and B) series are the deposition patterns of PS latex micro-spheres with different particle sizes on the sample holder (A and B), respectively. And the distances between holder (A and B) from the ALS nozzle were 135 mm and 215 mm, respectively. Within 15 minutes of a flow rate of 1.0 mL min−1, 230 nm to 3100 nm PS aerosols were deposited on the two holders (A and B). The edge diameters of each deposition pattern, and performs statistics and calculations according to the principle mentioned above are shown in Fig. 3B.
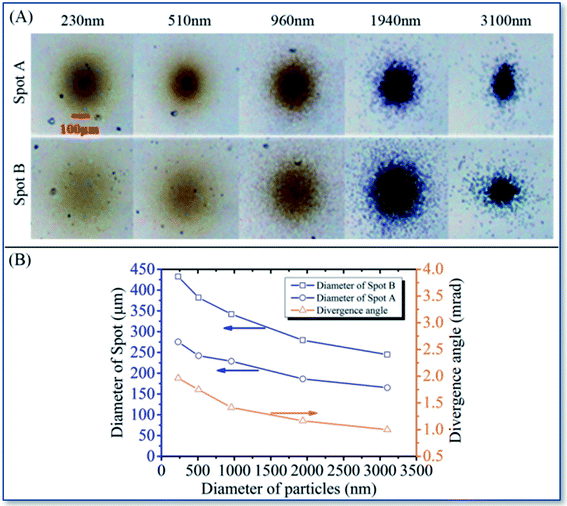 | ||
| Fig. 3 The optical images of the PS nanospheres deposition spots (A) and the calculated diameter as well as divergence angle data (B) in the ALS deposition system. | ||
Fig. 3B show that the focal beam width of the deposition gradually decreases with the particle size increment. The focal beam width at point A is lower than 300 μm and point B is smaller than 450 μm, indicating that the ultra-long focal length focused deposition system was successfully manufactured. Furthermore, all focal divergence angles are narrower than 1.75 mrad, informing that the focused beam shows good collimation within 200 mm. It can be considered that the focal length of this ALS focused deposition system is close to infinity and is far longer than the existing micro-nano processing direct printing technology. It is proved that an ultra-long focal distance depositing system was successfully fabricated.
3.2 The investigation on ALS deposition system applied to the AAFCVD
Typically, 25%, 50% and 75% ethanol aqueous solution was used as solvent to generate the aerosol. By observing the macroscopic state of the deposition point, it can be seen the liquid KH570 or KH560 can be converted into the solid state deposition point. However, no peeling or dissolution was observed in the deposition point under ultrasonic treatment in absolute ethanol environment for 30 minutes. This result indicated that the deposition sites have undergone chemical reaction of KH570 or KH560.
As the SEM images shown in Fig. 4A–C, the KH570 deposition points showed the trend from dispersion to aggregation with the increment of ethanol concentration. And the size of deposition points increases form the about 5 × 6 μm dispersed appearance to about 100 × 160 μm single concentrated spot. On the contrary, it can be observed from SEM images shown in Fig. 5A–C that the KH560 deposition points showed the trend from being aggregation to dispersion and the declining size of deposition points with the increment of ethanol concentration. The size of spray points decreases from 40 × 80 μm to only with several hundred nanometers series of scattered small spots. Moreover, the edge topography of KH570 deposition tends to be stacked and polygonal while KH560 to be single layered and spherical.
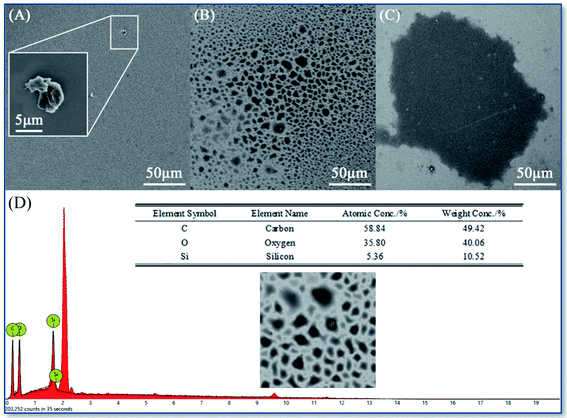 | ||
| Fig. 4 SEM images of the KH570 focused deposition spots with ethanol concentration (v/v): 25% (A), 50% (B) and 75% (C); and the EDS results (D). | ||
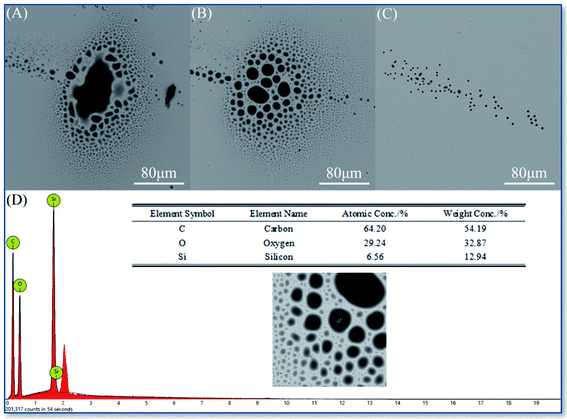 | ||
| Fig. 5 SEM images of the KH560 focused deposition spots with ethanol concentration (v/v): 25% (A), 50% (B) and 75% (C); and the EDS results (D). | ||
The EDS surveys in Fig. 4D and 5D showed that the characteristic peaks of carbon, oxygen and silicon, and the element proportion is close to those of KH570 and KH560. It is confirmed that the deposition points were from the original precursors.
By adjusting the concentration of ethanol, we can easily obtain the deposition point with a size of about 240 μm for KH570 or about 80 μm for KH560 within 135 mm distance after nozzle. It is proved that ALS can indeed be conveniently used for long-distance focused chemical reaction vapor deposition.
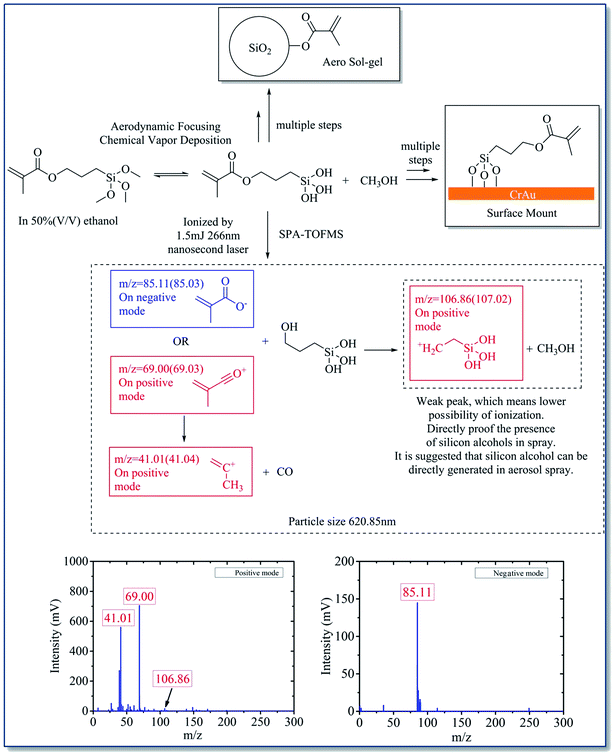
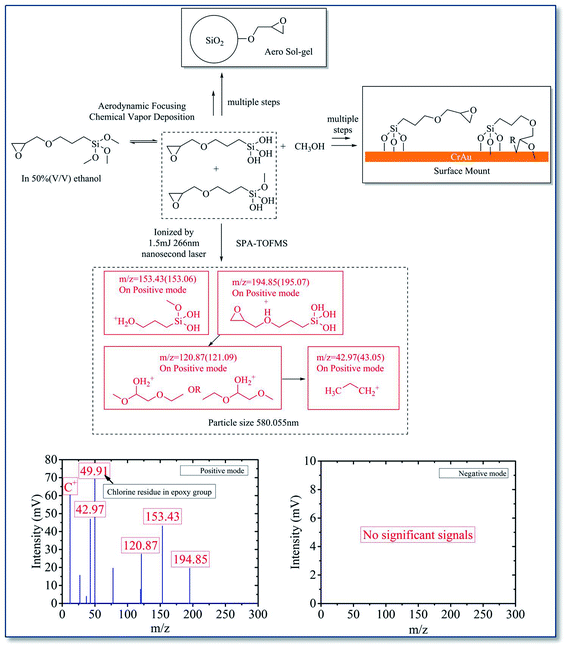
The mass spectrum data proved that both KH570 and KH560 have undergone chemical reaction inside the ALS. It can be seen that both KH570 and KH560 have the hydrolysis reaction of methyl siloxane to produce silanol. This implied that the silane hydrolysis and siloxane polymerization reaction have been occurred. And the ring-opening polymerization of epoxy group was found from KH560.
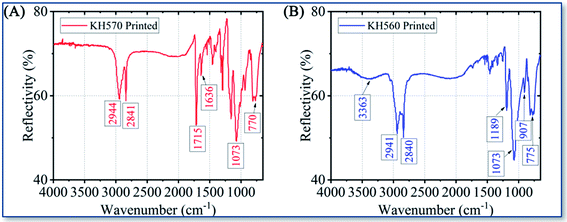
ATR FTIR was used to further study the functional groups of the deposition sites. The ATR IR spectrum on printed KH570 is shown in Fig. 8A. The peaks at 2944 cm−1 and 2841 cm−1 are due to the telescopic vibration –CH3 and –CH2–. The peaks at 1715 cm−1 and 1636 cm−1 are attribute to the C![[double bond, length as m-dash]](https://www.rsc.org/images/entities/char_e001.gif) O and C
O and C![[double bond, length as m-dash]](https://www.rsc.org/images/entities/char_e001.gif) C stretching vibration of the α,β-unsaturated ester from the acryloyl group in KH570; the peak at 1073 cm−1 is due to the vibration of Si–O–Si, indicating the formation of polymerized siloxane in KH570. The peak at around 770 cm−1 is attributed to the vibration of Si–O–Au, indicating the chemical reaction take place between KH570 and Au surface. The ATR IR spectrum on printed KH560 is shown in Fig. 8B. The peak at around 3363 cm−1 was attributed to telescopic vibration of –OH in hydrogen bond association. The peaks at 2941 cm−1 and 2840 cm−1 are due to the telescopic vibration –CH– and –CH2–. The peak at 1189 cm−1 is due to the telescopic vibration of C–O in the secondary hydroxyl R2–CH–OH, which means the ring-open polymerization of epoxy group in KH560 have been accomplished. The appearance of 1073 cm−1 and 775 cm−1 peak also indicated that the formation of Si–O–Si polymer by chemical reaction of KH560 and the chemical reaction take place between KH560 and Au surface. And the appearance of the peak 907 cm−1 is due to the C–O–C vibration from the remaining epoxy group in KH560.37,38
C stretching vibration of the α,β-unsaturated ester from the acryloyl group in KH570; the peak at 1073 cm−1 is due to the vibration of Si–O–Si, indicating the formation of polymerized siloxane in KH570. The peak at around 770 cm−1 is attributed to the vibration of Si–O–Au, indicating the chemical reaction take place between KH570 and Au surface. The ATR IR spectrum on printed KH560 is shown in Fig. 8B. The peak at around 3363 cm−1 was attributed to telescopic vibration of –OH in hydrogen bond association. The peaks at 2941 cm−1 and 2840 cm−1 are due to the telescopic vibration –CH– and –CH2–. The peak at 1189 cm−1 is due to the telescopic vibration of C–O in the secondary hydroxyl R2–CH–OH, which means the ring-open polymerization of epoxy group in KH560 have been accomplished. The appearance of 1073 cm−1 and 775 cm−1 peak also indicated that the formation of Si–O–Si polymer by chemical reaction of KH560 and the chemical reaction take place between KH560 and Au surface. And the appearance of the peak 907 cm−1 is due to the C–O–C vibration from the remaining epoxy group in KH560.37,38
Although both KH570 and KH560 have undergone hydrolysis and polymerization of silane, the difference between them is that the ring-opening polymerization of epoxy group took place in KH560 and the acryloyl group of KH570 did not participate the reactions.
These two precursors have different reaction pathway differs sol–gel polymerization reactions in ALS, resulting in the size-change of the particles produced through the lens and the difference between the focused depositions. To verify the above results, the particle size and distribution were measured at the same aerosol flow rate of 1.0 mL min−1 and 50% ethanol concentration.
The principle of particle size analysis method is that two 532 nm continuous laser and the corresponding PMTs are set at the vacuum chamber, near and far form the aerodynamic focusing lens accelerating nozzle respectively as laser scattering signal collection system. By measuring the time of flight when laser scattering signals generated by aerosol particles flying through the lens, compared to the standard curve calibrated by polystyrene aerosol particles, the corresponding particle size distribution can be obtained.
It can be seen from Fig. 9A that the FWHM are 247.4 for KH570 and 274.6 for KH560, which means KH570 reflects a more compact distribution curve than KH560 from 200 to 1000 nm. On the other hand, Fig. 9B shows the KH560 contains relatively smaller particles below the size of 200 nm (the sum of the number is 310 for KH570 and 11![[thin space (1/6-em)]](https://www.rsc.org/images/entities/char_2009.gif) 802 for KH560). It can be seen that KH560 has a smaller average particle size, a wider particle size distribution with two peaks at around 350 nm and below 200 nm, and a higher summery of particle number of 20
802 for KH560). It can be seen that KH560 has a smaller average particle size, a wider particle size distribution with two peaks at around 350 nm and below 200 nm, and a higher summery of particle number of 20![[thin space (1/6-em)]](https://www.rsc.org/images/entities/char_2009.gif) 844. In contrast, KH570 has a larger average particle size, a narrower particle size distribution with only one peak at around 400 nm and a lower summary of particle number of 5718.
844. In contrast, KH570 has a larger average particle size, a narrower particle size distribution with only one peak at around 400 nm and a lower summary of particle number of 5718.
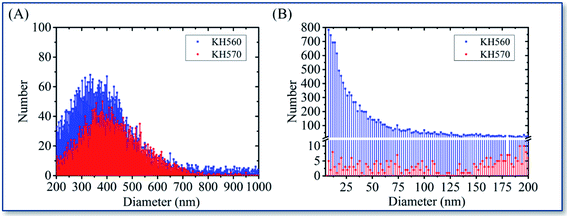 | ||
| Fig. 9 The jet particles number-size distribution of KH570 and KH560: from 200 to 1000 nm (A), and below 200 nm (B). | ||
Comparing with the SEM images of the deposition points shown in Fig. 4B and 5B, it can be found that the KH570 deposition points have smaller internal dispersion points but larger focused beam widths, while the KH560 deposition points have more coarse internal dispersion but smaller focused ones. The KH560 contains more small particles of sol–gel than KH570, and it has stronger chemical reactivity, resulting in a higher degree of aggregated deposition. The different chemical reactions affect the aggregation effects of sol–gel generation to change the morphology of the deposition point. Stronger reacting activity will help the better depositions.
Fig. 10A and B shows the pressure and velocity distributions of the airflow entering the one-stage aerodynamic lens from left to right. It can be seen that the airflow pressure gradually decreases from left to right along the axial direction. At the same time, near the back of the lens, due to the boundary effect, the pressure gradually decreases with increase of radial position.
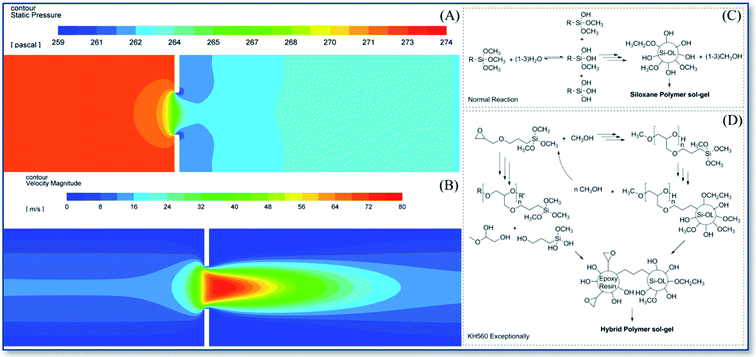 | ||
| Fig. 10 The simulation on pressure (A) and velocity (B) in an ADL, and the polymerization mechanisms of KH570 (C) and KH560 (D) aerosol–gel. | ||
Combining with the reaction rules of silane coupling agent described in Fig. 10C and D, it is believed that the axial pressure difference between the front and back of the lens triggers the small molecule removal condensation reaction, that means a strong demethanol hydrolysis reaction of siloxane both in KH570 and KH560 would be triggered. The difference of radial pressure causes the removed small molecules separation from the resulting sol–gel as soon as possible, accelerating the silanol polymerization reaction. Greater pressure and velocity on the central axis back of lens (Fig. 10B) may form a reaction process that triggers the aerosol of silane coupling agent polymerized into air sol–gel particles, resulting the focusing particle beam. In addition, the central higher pressure would trigger the epoxy ring-opening polymerization either, so the higher particle flow density (summery of particle number of 20![[thin space (1/6-em)]](https://www.rsc.org/images/entities/char_2009.gif) 844 in KH560 and 5718 in KH570) of KH560 was observed. KH570 is easier to focus on the deposition point at 75% high ethanol content. It should be attributed to the presence of more low-boiling point solvents in the lens to easier gelation. On the other hand, solvents with high water content are more suitable for the ring-opening polymerization of polar epoxy groups. For KH560, the dominant process epoxy polymerization that does not rely on the separation of low-boiling molecular to form a gel, which means 25% ethanol could obtain a better KH560 focused deposition.
844 in KH560 and 5718 in KH570) of KH560 was observed. KH570 is easier to focus on the deposition point at 75% high ethanol content. It should be attributed to the presence of more low-boiling point solvents in the lens to easier gelation. On the other hand, solvents with high water content are more suitable for the ring-opening polymerization of polar epoxy groups. For KH560, the dominant process epoxy polymerization that does not rely on the separation of low-boiling molecular to form a gel, which means 25% ethanol could obtain a better KH560 focused deposition.
The ethanol mediates the different reaction paths of the precursor in the special ALS vacuum environment, which also affects the final deposition effect. Low boiling point ethanol encourage the dehydration reactions which conducive to aerosol focusing reaction deposition based on dehydration reaction. Polar solvents are conducive to the focused deposition of epoxy precursors.
3.3 Exploration of injection effects
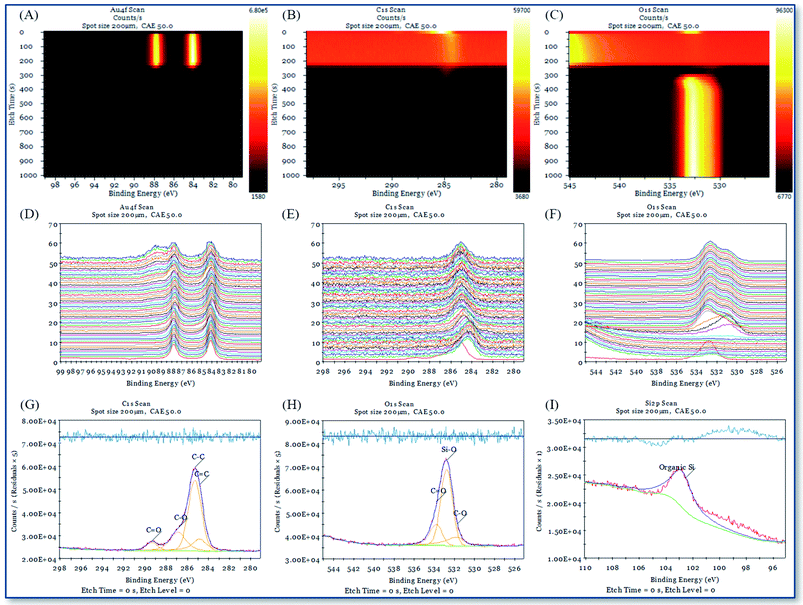
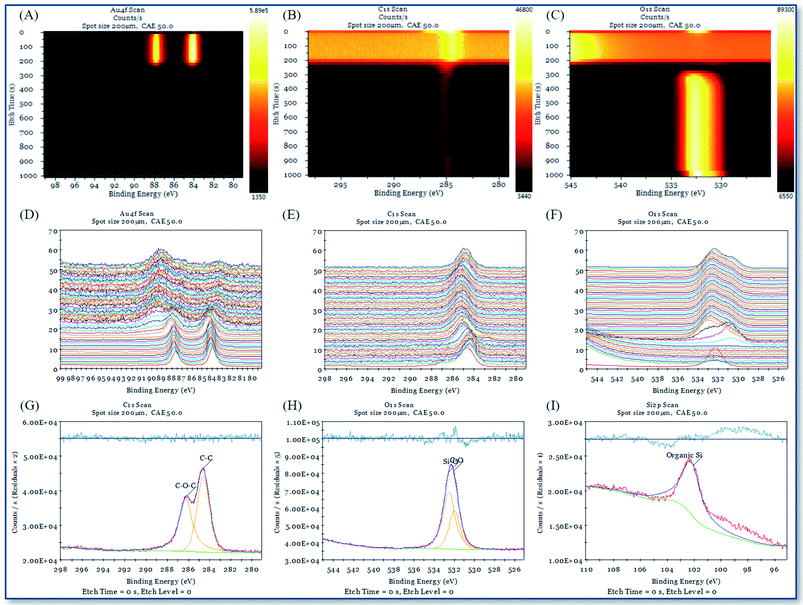
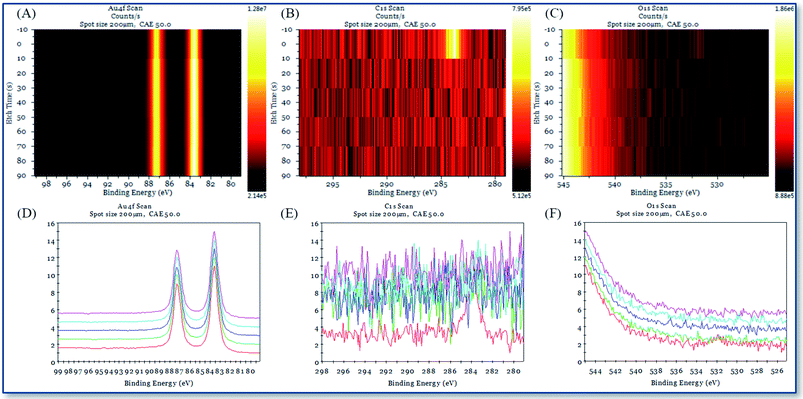
XPS and single-beam argon ion depth profiling methods are used to study the interface characteristics between the deposition point and the gold substrate interface with different chemical reagents in AAFCVD. Fig. 11 and 12 represent the XPS depth analysis data at the deposition points of KH570 and KH560 by the action of 50% ethanol solvent, respectively.Fig. 11A–C, 12A–C and 13A–C are the contour pseudo-color maps of Au 4f, C 1s and O 1s binding energy lines at different depths during XPS depth analysis. Fig. 11D–F, 12D–F and 13D–F are the relative intensity stacking diagrams of Au 4f, C 1s and O 1s binding energy lines at different depths during XPS depth analysis. Fig. 11G–I and 12G–I are the Au 4f, C 1s and O 1s energy spectral lines of the surface scan during XPS depth analysis, respectively.
Compared with the structure of the glass substrate in this work, referring to Fig. 11A and 12A, the Au 4f binding energy spectrum at 0–250 s represents the 120 nm of gold. While from Fig. 11C and 12C, characteristic peak of O 1s in silicon dioxide (glass) appears in the analysis time of 300–1000 s, where represent the 1.1 mm thick of soda glass.
Fig. 11G–I show that the C 1s fitting peak at 284.83 eV, 285.28 eV, 286.88 eV and 289.33 eV are the binding energy of the C![[double bond, length as m-dash]](https://www.rsc.org/images/entities/char_e001.gif) C, C–C, C–O and C
C, C–C, C–O and C![[double bond, length as m-dash]](https://www.rsc.org/images/entities/char_e001.gif) O bonds, respectively. The O 1s fitting peak at 531.69 eV, 532.76 eV and 533.74 eV are the binding energy of C–O, Si–O and C
O bonds, respectively. The O 1s fitting peak at 531.69 eV, 532.76 eV and 533.74 eV are the binding energy of C–O, Si–O and C![[double bond, length as m-dash]](https://www.rsc.org/images/entities/char_e001.gif) O bonds.39 And the Si 2p fitting peak at 102.56 eV is attributed to the organic Si element. Fig. 12G–I show that the C 1s fitting peak at 284.60 eV and 286.22 eV are the binding energy of the C–C and C–O–C bonds, respectively. The O 1s fitting peak at 532.04 eV and 532.58 eV are the binding energy of C–O and Si–O bonds, respectively. The Si 2p fitting peak at 102.06 eV is attributed to the organic Si element. The above results show that the chemical atomic composition of deposition point is very consistent with those of KH570 and KH560.
O bonds.39 And the Si 2p fitting peak at 102.56 eV is attributed to the organic Si element. Fig. 12G–I show that the C 1s fitting peak at 284.60 eV and 286.22 eV are the binding energy of the C–C and C–O–C bonds, respectively. The O 1s fitting peak at 532.04 eV and 532.58 eV are the binding energy of C–O and Si–O bonds, respectively. The Si 2p fitting peak at 102.06 eV is attributed to the organic Si element. The above results show that the chemical atomic composition of deposition point is very consistent with those of KH570 and KH560.
From the contour pseudo-color maps of Fig. 11A–C and 12A–C that in the profiling structure range (0–200 s) where the Au 4f characteristic peak appears, there are C 1s characteristic peaks group and runs through the entire structure of gold. While in the shallow gold structure of the blank sample (0–10 s), the characteristic peak of C 1s disappeared quickly (Fig. 13B). It is confirmed that the carbon source in the working sample was came from the depositions of polymerized KH570 or KH560, and a significant injection effect occurs through the entire 120 nm depth of the gold layer. The characteristic peaks of organic matter O 1s shown in Fig. 11C and 12C disappear from the polar surface until the appearance of the characteristic O 1s of the glass SiO2, indicating that further chemical reactions have occurred since the injection of KH570 and KH560 depositions. It should be due to the strong friction and shearing of the organic compound with the dense metal layer in the high-speed jet state, resulting in carbonization.
The intensity of C 1s in Fig. 11B and 12B have shown that the injection of KH570 is lower than that of KH560. KH570 tends to accumulate on the surface of gold, while KH560 tends to be injected. The surface layer C![[double bond, length as m-dash]](https://www.rsc.org/images/entities/char_e001.gif) C binding energy shift on the KH570 deposition point is very obvious. Compared with the standard, it has increased by about 0.8 eV (284.83 eV for testing data and 284.0 eV for standard), showing the relative chemical contact. Correspondingly, this phenomenon is not observed at the KH560 deposition point. Therefore, we speculated that the closer interaction between the KH570 unsaturated hydrocarbon and the gold surface causes the injection effect to be slowed down, while the KH560 does not, and thus a stronger injection is obtained.
C binding energy shift on the KH570 deposition point is very obvious. Compared with the standard, it has increased by about 0.8 eV (284.83 eV for testing data and 284.0 eV for standard), showing the relative chemical contact. Correspondingly, this phenomenon is not observed at the KH560 deposition point. Therefore, we speculated that the closer interaction between the KH570 unsaturated hydrocarbon and the gold surface causes the injection effect to be slowed down, while the KH560 does not, and thus a stronger injection is obtained.
In summary, a rear and unique injection characteristic compared to the traditional printing technologies by the introduction of ALS was discovered. It maybe due to the high speed particle beam (normally 15–80 m s−1) by the ALS nozzle acceleration. Under the system conditions of this work, the precursors that within closer contact (KH570) to the substrate surface are more likely to be enriched on the surface, on the contrary (KH560) they are more likely to be injected. This feature has not been fully reported in the previous articles, and it may construct a new type of single-step channel forming and doping process, which may become an important potential new method to realize complex devices.
3.4 Exploration of printing performance
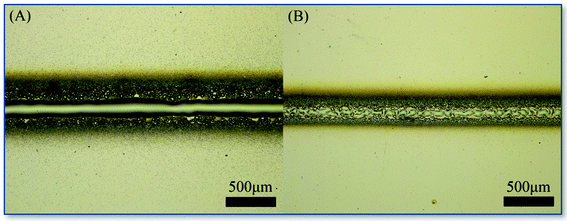
The single-line printing experiment was used to test the graphics printing performance of the system. In this part, we have adjusted the ALS system precisely, and still used the sample carrier with a distance as long as 135 mm from the nozzle.The experiment used KH570 and KH560 with the concentration of 4.0 μg mL−1, a solvent of 50% (v![[thin space (1/6-em)]](https://www.rsc.org/images/entities/char_2009.gif) :
:![[thin space (1/6-em)]](https://www.rsc.org/images/entities/char_2009.gif) v) ethanol, an aerosol flow rate at 1.0 mL min−1 and the speed of 300.0 μm min−1 for printing. The total of 44 mm length were printed in this experiment, and it took about 146 minutes for each line. No nozzle clogging or other abnormalities occurred. Optical microscope was used to image the printed graphics. The results are shown in Fig. 14. It is believed that we have successfully carried out one-dimensional printing, showing the good application prospect of this printing method.
v) ethanol, an aerosol flow rate at 1.0 mL min−1 and the speed of 300.0 μm min−1 for printing. The total of 44 mm length were printed in this experiment, and it took about 146 minutes for each line. No nozzle clogging or other abnormalities occurred. Optical microscope was used to image the printed graphics. The results are shown in Fig. 14. It is believed that we have successfully carried out one-dimensional printing, showing the good application prospect of this printing method.
4. Conclusions
In this work, a focal length of up to 215 mm, with divergence angle of 1.75 mrad aerodynamic lens stacks (ALS) printing system has been designed and evaluated. This system has a wide aerosol particle adaptability from 200 nm to 1 μm scale.Aerosol-assisted focused chemical vapor deposition (AAFCVD) has been accomplished with this system. The SEM and EDS methods prove that the system can generate the optimal 80 μm deposition point at a distance of 135 mm from the nozzle. Through SPA-MS, laser particle tracking and ATR FTIR, the chemical reaction mechanism of precursors KH570 and KH560 in the system and the mediating role of solvent ethanol have been clarified: precursors with stronger sol–gel reactivity like hydrolysis or ring-opening polymerization will help the better depositions. Ethanol encourage the dehydration reactions which conducive to the process based on dehydration reaction. Polar solvents are conducive to the focused deposition of epoxy precursors.
XPS depth profiling has found an unique carbon injection effect at the printing points trough the entire 120 nm gold coating. It is believed due to the high speed particle beam (normally 15–80 m s−1) by the ALS nozzle acceleration.
Linear printing with the precursors of KH570 and KH560 have been demonstrated, no nozzle clogging or other failure was found during the operational period as long as 146 min for several times. The results show that we have successfully designed a stable and long focal length focusing printing system (AAFCVD system) using ALS technology, which combines focusing and AACVD compatibility and accessible graphics printing performance. This system is expected to become a new generation of high-performance mask-free printing system.
Conflicts of interest
There are no conflicts to declare.Acknowledgements
This work was supported by the GDAS Project of Science and Technology Development (Grant No. 2019GDASYL-0103073, 2019GDASYL-0103072 and 2018GDASCX-0112), and the National Natural Science Foundation of China (Grant No. 41905106).Notes and references
- K. Huang, J. Wu, Z. Chen, H. Xu, Z. Wu, K. Tao, T. Yang, Q. Wu, H. Zhou, B. Huang, H. Chen, J. Chen and C. Liu, ACS Nano, 2019, 13(6), 6618–6630 CrossRef CAS
.
- G. Wyatt-Moon, D. G. Georgiadou, S. James and T. D. Anthopoulos, ACS Appl. Mater. Interfaces, 2017, 9(48), 41965–41972 CrossRef CAS
.
- H. Kim, S. Lee, D. Han and S. Yoo, Sol. Energy Mater. Sol. Cells, 2014, 120(B), 561–565 CrossRef CAS
.
- A. Määttänena, U. Vanamo, P. Ihalainen, P. Pulkkinen, H. Tenhu, J. Bobacka and J. Peltonen, Sens. Actuators, B, 2013, 177, 153–162 CrossRef
.
- G.-Y. Lee, J.-I. Park, C.-S. Kim, H.-S. Yoon, J. Yang and S.-H. Ahn, ACS Appl. Mater. Interfaces, 2014, 6(19), 16466–16471 CrossRef CAS
.
- A. Bulusu, S. A. Paniagua, B. A. MacLeod, A. K. Sigdel, J. J. Berry, D. C. Olson, S. R. Marder and S. Graham, Langmuir, 2013, 29(12), 3935–3942 CrossRef CAS
.
- N. Ćatić, L. Wells, K. Al Nahas, M. Smith, Q. Jing, U. F. Keyser, J. Cama and S. Kar-Narayan, Appl. Mater., 2020, 19, 100618 Search PubMed
.
- B. A. Morgan, M. Manser, M. Jeyanathan, X. Zhou, E. D. Cranston and M. R. Thompson, ACS Biomater. Sci. Eng., 2020, 6(7), 4304–4313 CrossRef CAS
.
- C. Yang, E. Zhou, S. Miyanishi, K. Hashimoto and K. Tajima, ACS Appl. Mater. Interfaces, 2011, 3(10), 4053–4058 CrossRef CAS
.
- S. Lu, J. Zheng, J. A. Cardenas, N. X. Williams, Y.-C. Lin and A. D. Franklin, ACS Appl. Mater. Interfaces, 2020, 12(38), 43083–43089 CrossRef CAS
.
- F. Loffredo, A. De Girolamo Del Mauro, G. Burrasca, V. La Ferrara, L. Quercia, E. Massera, G. Di Francia and D. DellaSala, Sens. Actuators, B, 2009, 143(1), 421–429 CrossRef
.
- R. Deng, Y. Wang, L. Yang and C. D. Bain, ACS Appl. Mater. Interfaces, 2019, 11(43), 40652–40661 CrossRef CAS
.
- S. I. Ahn, W. K. Kim, Si H. Ryu, K. J. Kim, S. E. Lee, S.-H. Kim, J.-C. Park and K. C. Choi, Org. Electron., 2012, 13(6), 980–984 CrossRef CAS
.
- C.-T. Tsai, S. R. Gottam, P.-C. Kao, D.-C. Perng and S.-Y. Chu, Synth. Met., 2020, 269, 116537 CrossRef CAS
.
- C. Amruth, B. Luszczynska, M. Z. Szymanski, J. Ulanski, K. Albrecht and K. Yamamo, Org. Electron., 2019, 74, 218–227 CrossRef
.
- X. Zheng, Y. Liu, Y. Zhu, F. Ma, F. Chen, Y. Yu, H. Hu and F. Li, Opt. Mater., 2020, 101, 109755 CrossRef CAS
.
- M. Shtein, P. Peumans, J. B. Benziger and S. R. Forrest, Adv.
Mater., 2004, 16(18), 1615–1620 CrossRef CAS
.
- B. A. Williams, A. Mahajan, M. A. Smeaton, C. S. Holgate, E. S. Aydil and L. F. Francis, ACS Appl. Mater. Interfaces, 2015, 7(21), 11526–11535 CrossRef CAS
.
- K. S. Bhat, R. Ahmad, J.-Y. Yoo and Y.-B. Hahn, J. Colloid Interface Sci., 2018, 512(15), 480–488 CrossRef CAS
.
- A. Baldelli, J. Ou, W. Li and A. Amirfazli, Langmuir, 2020, 36, 11393–11410 CrossRef CAS
.
- C. Piccirillo, C. J. Denis, R. C. Pullar, R. Binions, I. P. Parkin, J. A. Darr and P. M. L. Castro, J. Photochem. Photobiol., A, 2017, 332(1), 45–53 CrossRef CAS
.
- M. Taylor, R. C. Pullar, I. P. Parkin and C. Piccirillo, J. Photochem. Photobiol., A, 2020, 400, 112727 CrossRef CAS
.
- S. Basak, M. Afzaal and H. M. Yates, Mater. Chem. Phys., 2019, 223(1), 157–163 CrossRef CAS
.
- M. Aamir, M. Sher, M. D. Khan, M. A. Malik, J. Akhtar and N. Revaprasadu, Mater. Lett., 2017, 190, 244–247 CrossRef CAS
.
- A. Robinson, Commun. Pure Appl. Math., 1956, 9(1), 69–84 CrossRef
.
- P. Liu, P. J. Ziemann, D. B. Kittelson and P. H. McMurry, Aerosol Sci. Technol., 1995, 22(3), 293–313 CrossRef CAS
.
- X. F. Zhang, K. A. Smith, D. R. Worsnop, J. Jimenez, J. T. Jayne and C. E. Kolb, Aerosol Sci. Technol., 2002, 36(5), 617–631 CrossRef CAS
.
- X. Wang and P. H. McMurry, Aerosol Sci. Technol., 2006, 40, 320–334 CrossRef CAS
.
- K.-S. Lee, S.-W. Cho and D. Lee, J. Aerosol Sci., 2008, 39(4), 287–304 CrossRef CAS
.
- J. Meinen, S. Khasminskaya, E. Rühl, W. Baumann and T. Leisner, Aerosol Sci. Technol., 2010, 44(4), 316–328 CrossRef CAS
.
- S. Zherebtsov, T. Fennel, J. Plenge, E. Antonsson, I. Znakovskaya, A. Wirth, O. Herrwerth, F. Süßmann, C. Peltz, I. Ahmad, S. A. Trushin, V. Pervak, S. Karsch, M. J. J. Vrakking, B. Langer, C. Graf, M. I. Stockman, F. Krausz, E. Rühl and M. F. Kling, Nat. Phys., 2011, 7(8), 656–662 Search PubMed
.
- M. R. Canagaratna, J. T. Jayne, J. L. Jimenez, J. D. Allan, M. R. Alfarra, Q. Zhang, T. B. Onasch, F. Drewnick, H. Coe, A. Middlebrook, A. Delia, L. R. Williams, A. M. Trimborn, M. J. Northway, P. F. DeCarlo, C. E. Kolb, P. Davidovits and D. R. Worsnop, Mass Spectrom. Rev., 2007, 26(2), 185–222 CrossRef CAS
.
- L. Li, Z. Huang, J. Dong, M. Li, W. Gao, H. Niand, F. Zhong, G. Zhang, X. Bi, P. Chenga and Z. Zhou, Int. J. Mass Spectrom., 2011, 303, 118–124 CrossRef CAS
.
- F. Drewnick, S. S. Hings, P. DeCarlo, J. T. Jayne, M. Gonin, K. Fuhrer, S. Weimer, J. L. Jimenez, K. L. Demerjian, S. Borrmann and D. R. Worsnop, Aerosol Sci. Technol., 2005, 39(7), 637–658 CrossRef CAS
.
- D. S. Thomson, M. E. Schein and D. M. Murphy, Aerosol Sci. Technol., 2010, 33(1–2), 153–169 Search PubMed
.
- R. Mahadevan, D. Lee, H. Sakurai and M. R. Zachariah, J. Phys. Chem. A, 2002, 106(46), 11083–11092 CrossRef CAS
.
- P. J. Launer, Am. Mineral., 1952, 37(9–10), 764–784 CAS
.
- C. J. Pouchert, The Aldrich library of infrared spectra, Aldrich Chemical Co., Inc., Milwaukee, 1971 Search PubMed
.
- A. Shchukarev and D. Korolkov, CEJC, 2004, 2(2), 347–362 CAS
.
| This journal is © The Royal Society of Chemistry 2021 |

