 Open Access Article
Creative Commons Attribution 3.0 Unported Licence
Removal of brilliant green dye from synthetic wastewater under batch mode using chemically activated date pit carbon
Ramadan Abd El-Ghany Mansour a,
Mohamed Gamal Simeda
 *b and
Ahmed Amin Zaatout
 c
c
aBasic Sciences and Engineering Department, Higher Institute of Engineering and Technology, New Damietta, Egypt. E-mail: drramadanelkatep@yahoo.com
bChemical Engineering Department, Higher Institute of Engineering and Technology, New Damietta, Egypt. E-mail: eng.modysmsm@gmail.com
cChemical Engineering Department, Faculty of Engineering, Alexandria University, Egypt. E-mail: draazaatout@yahoo.com
First published on 17th February 2021
Abstract
In this research, a single-stage batch adsorber was designed for removal of brilliant green dye (BG) from aqueous solutions using activated carbon derived from date pits (ADPC) based on the Freundlich isotherm which was the best-fitted isotherm model. Experimental work was carried out within the range of 10–50 ppm initial dye concentration to determine the optimum operating conditions which were 55 min contact time, 0.06 g adsorbent mass, 25 °C, and pH = 8. Process kinetics was best-fitted with the pseudo-second order model, which revealed that the intra-particle diffusion stage is the rate-controlling stage for the process. The process efficiency was assessed by infrared spectroscopy (FTIR), scanning microscopy (SEM), X-ray spectroscopy (EDXS), and Brunauer–Emmett–Teller (BET) where the latter showed that the specific surface area of the adsorbent is 311.38 m2 g−1, which gives a favorable maximum monolayer adsorption capacity (77.8 mg g−1). The thermodynamic study proved that BG adsorption on ADPC was physiosorptive (ΔG = −5.86 kJ mol−1) and spontaneous at low temperature (ΔH = −17.7 kJ mol−1, ΔS = −0.04 kJ mol−1 K−1).
Introduction
Coloring agents and dyestuffs have become the main feedstock for the production of domestic goods, colorful fabrics, paints, printing inks, and so on.1,2 For instance, the total textile dye consumption is greater than 107 kg per year worldwide with roughly 106 kg per year of dyes discharged into water streams killing more than three million people, mainly infants, who get water for drinking and irrigation.3,4 Several kinds of industrial dyestuffs can be found in wastewater and it is classifiable into three major groups: anionic (direct, acid, and reactive dyes), cationic (basic dyes) and non-ionic (disperse and vat dyes)5 while in general, cationic dyes have the most harmful and toxic effects on the ecosystem of receiving water and the whole environment.6 Releasing such toxic dyes into the environment has become a worldwide concern because of their chemical stability,7 and cancer-causing and mutagenic impacts that influence oceanic biota by preventing light from penetrating through water, which slows down photosynthetic activity and also tends to toxify fish and other organisms due to chelating metal ions. Oxidation and reduction of these dyes in water can also produce hazardous substances that raise the necessity of getting rid of them from wastewater.8,9 They also cause hyperactivity, low frustration tolerance, impulsivity, and lack of attention when they are used as food additives.10 For that reason, numerous methods such as chemical oxidation, electrolysis, coagulation, ozonation, reverse osmosis, ultra-chemical filtration, ion exchange, precipitation, flocculation, biological methods, and many others have been used to eliminate organic pollutants.11,12 However, their use on a large-scale is restricted due to their long operational time, high production cost, and toxic side products.13,14 Adsorption has been observed to be better than multiple techniques for treating wastewater contaminated with dissolved substances and drugs15,16 because it is inexpensive, very flexible, modest in design, easy to operate, and capable of handling relatively high flow rates of water without production of residual sludge or pollutants.17,18 Moreover, successful water pollutant adsorption provides their recovery, which is especially required for water nutrients.19 Adsorption techniques can be classified into batch which is a simple technique that offers a convenient way to better explain the parameters that control the adsorption mechanism or continuous technique which is useful in evaluating the amount of adsorbent required to extract the wastewater contaminants.20 Commercial activated carbon is a commonly utilized adsorbent in waste-water treatment processes as it consists of a micro-porous homogenous structure that gives large surface area, high adsorption capacity, and high porosity21 but its wide utilization was restricted because it is costly and its uptake capacity and yield after regeneration decreased by 10–15%.22 Hence, scientific researchers have focused their attention on producing activated carbon from renewable domestic agricultural waste because of its low preparation costs.23,24 “Table 1” shows the advantages and disadvantages of previously reported biomass utilized in wastewater treatment compared with date pits. Physical and chemical activation are the basic processes for producing activated carbon. The first technique is composed of raw material carbonization and gasification by steam or carbon dioxide of the resulting char. The second technique consists of impregnation of the precursor material with chemical reagent (KOH, ZnCl2, H2SO4, H3PO4, HNO3, and CO2) then carbonization of the impregnated product.32 ZnCl2 and H3PO4 appear to be the most used reagents for activated carbon preparation but H3PO4 is preferred because of its ease removing by washing with warm or cold water after carbon activation.33 Moreover, the iodine number of carbon prepared from H3PO4 is greater than the iodine number of carbon prepared from ZnCl2.34 The chemical activation process is superior to the physical activation process because of its high productivity and high surface area of the resulted carbon9 in addition to its low energy costs.35 BG is an odorless cationic dye in the form of golden-green crystals.4 It is known as Diamond green G, Solid green, Ethyl green, and Basic green 1. It can be used as a biological mark, dermatologic agent, antimicrobial treatment, and inhibition of mold propagation in poultry food.36 It is also widely utilized in the dyeing of textiles and manufacturing of inks for printing papers. Approximately 0.8–1.0 kg of BG is utilized per ton of produced paper sheet.37 For mankind, BG causes gastrointestinal tract discomfort which leads to nausea, vomiting, and diarrhea. It also induces cough and shortness of breath in the respiratory tract. Moreover, it can cause skin irritation with redness and ache in case of direct contact.38 Decomposition of BG may produce hazardous gases like CO, CO2, NO, NO2, and SO2.5 As a result, a lot of researchers studied the adsorption of BG from wastewater by carbonized and non-carbonized as given in “Table 2”. Date pits can be considered a waste product after processing of compressed dates (fresh date fruit has 10–15% seed from its weight).39 It was used as carbonized and non-carbonized compound for many adsorption kinds of research to remove industrial dyes such as Methylene Blue,40 Indigo Carmine,9 Methyl Orange,35 Disperse blue dye,41 Maxilon blue,23 and Congo red.42 The current survey was aimed to determine the optimum contact time, adsorbent mass, temperature, pH, and initial BG concentration. Some adsorption isotherm models were studied to know the maximum adsorption capacity for the activated date pits carbon and the best-fitted model for the process. The kinetic and thermodynamic studies were investigated to define the mechanism and the rate-controlling stage for the process. The experimental data was well fitted with Freundlich isotherm which was used in designing a batch adsorber with one stage.| Adsorbent | Advantages | Disadvantages |
|---|---|---|
| Wood25 | Produced activated carbon has a highly porous structure (SBET = 1884 m2 g−1) and useful functional groups | The yield of produced activated carbon is low |
| Produced activated carbon can make a rapid adsorption process with high adsorption capacity | Wood can be more useful in production of furniture | |
| Bagasse26 | Produced activated carbon is very efficient for the adsorption of gases due to its excellent stability and regenerability | Produced activated carbon can't be useful in dyes or heavy metals removal because of its non-sufficient functional groups |
| Produced activated carbon has a large specific surface area (SBET = 1113 m2 g−1) | Produced activated carbon has a small micro-pore diameter (less than 1 nm) | |
| Orange peel27 | Produced activated carbon gives high adsorption capacities. | The yield of produced activated carbon is low |
| Produced activated carbon has many useful functional groups | Produced activated carbon requires several treatment processes to control the ash content | |
| Biological sludge28 | Produced activated carbon has a large specific area and high micro-pore diameter | The yield of produced activated carbon is low due to high liquid content |
| Produced activated carbon gives high adsorption capacities | Produced activated carbon can't be useful in heavy metals removal because of its non-sufficient functional groups | |
| Rice husks29 | Pyrolyzed rice husk can be used to remove color and turbidity of wastewater | Produced activated carbon has a small specific surface area and small adsorption capacity |
| Raw rice husk has been reported to remove 98.24% of humic acid from aqueous solutions | Produced activated carbon requires several pre-treatment processes to control the ash content | |
| Waste palm shells30 | The yield of produced activated carbon is very high (97.8 wt%) and the activation time is very small (10 min) | Produced activated carbon has a small specific surface area and small adsorption capacity |
| Produced activated carbon doesn't need several treatment processes due to low ash content | Produced activated carbon has non-sufficient functional groups | |
| Coconut husk31 | Produced activated carbon has a large specific surface area (SBET = 1448 m2 g−1) | Raw coconut husk can be more useful when used as a fuel for household purposes |
| Produced activated carbon can be regenerated without any damage (desorption efficiency >95%) | Raw coconut husk needs several purification processes to eradicate dirt and other contaminants | |
| Date pits (present work) | Produced activated carbon has a convenient specific surface area and adsorption capacity | Grinding of raw date pits need a special mill for hard rocks |
| The yield of produced activated carbon is high (>70 wt%) | ||
| The purification processes of raw date pits are very simple. | ||
| Produced activated carbon can be useful in dyes or heavy metals removal due to its sufficient functional groups |
Materials and methods
Activated date pits carbon preparation
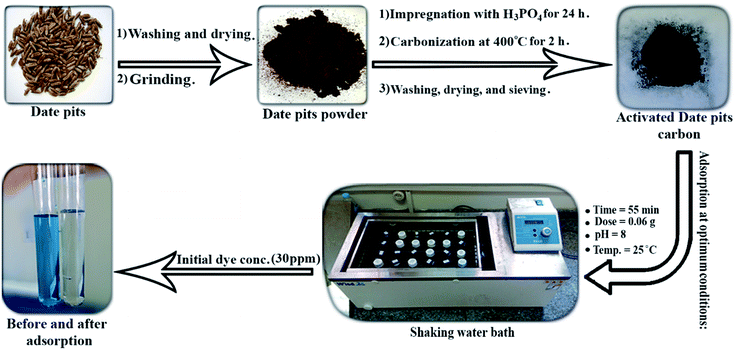
The raw date pits were collected from a factory that produces compressed dates (Agwa) in Damietta, Egypt. The boiled water was used in washing the pits to remove any date residue. The pits were dried at 110 °C in an electric oven to make them free from moisture then ground to a fine powder using (RETSCH lab mill). The raw date pits powder was placed in a glass container and a concentrated phosphoric acid (85%) was poured carefully into the container until 20 g of seeds will be impregnated in 40 mL of H3PO4 at 25 °C for 24 hours. At the end of the soaking time, the soaked seeds were dried at 110 °C for one hour. The seeds were placed on a ceramic cup and subjected to 400 °C for 2 hours in a muffle furnace (Hobersal JB-20). Then, neutralization of the seeds was carried out using hot distilled water and after that, the produced activated carbon was dried at 110 °C for 3 hours to remove any undesired moisture within the particles. Finally, the activated date pits carbon was sieved using (SAMA Sieve Shaker) to obtain an equal particle diameter which was (75 μm).Preparation of the adsorbate
BG (C27H34N2O4S) was bought with molecular weight 482.62 and was used by dissolving 1 g of BG powder, weighed by a four-digit analytical balance (KERN-ABS 220-4, UK), in 1 L of distilled water to prepare the stock solution (1000 ppm). Diluting the stock solution with distilled water was carried out to prepare the desired experimental concentrations. The wavelength was measured to be 625 nm and the final concentrations were measured using (PG instrument Ltd T80, UK) UV-Visible spectrophotometer.Experimental studies
The batch adsorption process was carried out to study the effect of the experimental parameters (contact time, adsorbent mass, temperature, pH, and initial BG concentration) on the adsorption of BG by activated date pits carbon (ADPC) and can be summarized in “Fig. 1”.Firstly, a 0.02 g of ADPC was contacted with 50 mL of a BG solution at different concentrations (10–50 ppm) at neutral pH in 125 mL glass bottles at a fixed temperature (25 ± 2 °C) and constant shaking speed (240 rpm) in a shaking water bath (Wisd laboratory instruments, DAHAN Scientific co., Ltd, 30, Korea) for different intervals of time until it reached the equilibrium at (55 min). Secondly, the solutions were centrifuged using (80-1 Electric Centrifuge) and the concentrations of the filtrated samples were determined by the spectrophotometer. The previous procedures were applied at (0.01–0.08 g) of ADPC and constant time (55 min) until the equilibrium was observed at (0.06 g) which is the optimum adsorbent mass. The temperature effect was studied by applying the above procedures at 55 min contact time, 0.06 g dose, neutral pH, and different temperatures (25–95 °C). The initial concentration effect was determined by preparing (10–100 ppm) from the stock of the dye solution and applying the repeated process at the optimized conditions of the previous parameters (55 min time, 0.06 g dose). The pH parameter was investigated by adjusting the pH of the dye solutions using a pH-meter (Hanna-Instruments 8519, pH 211, Canada), HCl, and NaOH and repeating the process as described above at equilibrium time and dose until it gives the highest removal percent which was at pH = 8. The process efficiency was determined using the following equations:
| (% R) = [1 − (Ce/Co)] × 100 | (1) |
| Qe = (Co − Ce)V/W | (2) |
Results and discussion
Characterization of activated date pits carbon
SEM analysis was used to obtain surface morphology of activated date pits carbon (ADPC) before and after adsorption of BG by (JEOL JSM 6510 lv, Japan). “Fig. 2a” displays a heterogeneous morphology of ADPC before adsorption of BG including many small pores that are distributed randomly on the surface. “Fig. 2b” clearly shows the aggregation of BG particles on the surface of ADPC which makes the pores mostly disappeared and this indicates that BG was successfully adsorbed on the surface of ADPC.47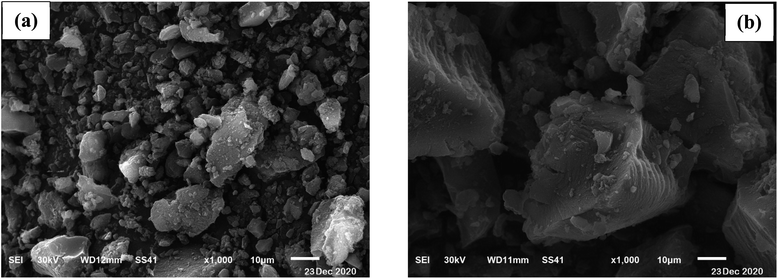 | ||
| Fig. 2 Scanning Electron Microscope of activated date pits carbon (ADPC) (a) before adsorption and (b) after adsorption of BG. | ||
EDXS analysis was used to clarify the qualitative elemental composition of activated date pits carbon (ADPC) before and after adsorption of BG by (JEOL JSM 6510 lv, Japan). According to the X-ray spectroscopy, the chemical composition (in wt%) of ADPC unloaded with BG was 76.73 for carbon, 21.92 for oxygen, 0.19 for sodium, 0.56 for phosphorus, 0.39 for copper, and 0.22 for zinc. Furthermore, the chemical composition (in wt%) of ADPC loaded with BG was 79.38 for carbon, 19.06 for oxygen, zero for sodium, 0.82 for phosphorus, 0.42 for copper, and 0.33 for zinc. Based on the noticeable differences in weight percents between ADPC loaded and unloaded with BG, it can be concluded that the chemical structure of ADPC was changed due to the effective adsorption of BG molecules on the pores of ADPC.47
FTIR analysis was used to see how far the molecular structure of activated date pits carbon (ADPC) has been changed after adsorption of BG by (ThermoFisher Nicolete IS10, USA). According to the IR spectrum of ADPC before adsorption of BG, there are some strong, moderately strong, and weak bands at 3407, 2920, 2851, 1602, 1435, 1376, 1230, 1077, 507, and 421 cm−1 assigned to O–H stretch, methylene C–H asymmetric stretch, methylene C–H symmetric stretch, primary amine N–H bend, methyl C–H asymmetric bend, methyl C–H symmetric bend, aromatic ethers aryl-O stretch, C–O–C cyclic ethers, aryl disulfides S–S stretch, and aryl disulfides S–S stretch. On the other hand, the IR spectrum of ADPC after adsorption of BG has strong, moderate, and weak bands at 3431, 2922, 2853, 1617, 1579, 1474, 1411, 1380, 1337, 1251, 1214, 1181, 1152, 1070, and 894 cm−1 assigned to O–H stretch, methylene C–H asymmetric stretch, methylene C–H symmetric stretch, primary amine N–H bend, C![[double bond, length as m-dash]](https://www.rsc.org/images/entities/char_e001.gif) C–C aromatic ring stretch, C
C–C aromatic ring stretch, C![[double bond, length as m-dash]](https://www.rsc.org/images/entities/char_e001.gif) C–C aromatic ring stretch, vinyl C–H in-plane bend, methyl C–H symmetric bend, methyne C–H bend, aromatic ethers aryl-O stretch, P–O–C aromatic phosphates stretch, R-O-SO3 organic sulfates, R-SO3 sulfonates, C–O–C cyclic ethers, C–H vinylidene out-of-plane bend.48–51 The observed shifts of the bands in the IR spectrum to higher and lower wavelength as well as the appearance of new bands at 1579, 1474, 1337, 1214, 1181, 1152, and 894 cm−1 and disappearance of some bands at 507, and 421 cm−1 can be considered strong evidence for adsorption of BG on the surface of ADPC.47
C–C aromatic ring stretch, vinyl C–H in-plane bend, methyl C–H symmetric bend, methyne C–H bend, aromatic ethers aryl-O stretch, P–O–C aromatic phosphates stretch, R-O-SO3 organic sulfates, R-SO3 sulfonates, C–O–C cyclic ethers, C–H vinylidene out-of-plane bend.48–51 The observed shifts of the bands in the IR spectrum to higher and lower wavelength as well as the appearance of new bands at 1579, 1474, 1337, 1214, 1181, 1152, and 894 cm−1 and disappearance of some bands at 507, and 421 cm−1 can be considered strong evidence for adsorption of BG on the surface of ADPC.47
Operating conditions effect
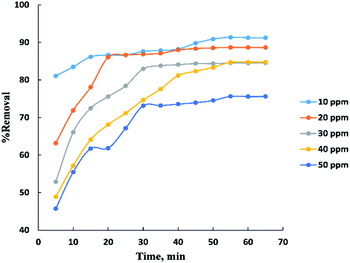
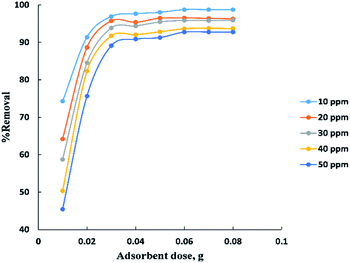
Process time can be represented by “Fig. 3” for adsorption of different concentrations (10–50 ppm) of BG onto a fixed weight (0.02 g) of activated date pits carbon (ADPC) in the range of (5–65 min). It can be observed that the low concentrations (10 and 20 ppm) reach the equilibrium very rapidly at the first twenty minutes while the high concentrations (30, 40, and 50 ppm) reach the equilibrium at (55 min) after a gradual increase in the removal percent during the time shown in the figure and this could be interpreted by the theory that in adsorption of dyes, firstly, the dye molecules have to compete against the effect of boundary layer interface. Secondly, the penetrating dye molecules move out from the boundary layer film to distribute onto the surface of the adsorbent. Finally, the remaining dye molecules diffuse into the porous structure of the adsorbent. Based on this theory we conclude that when the initial concentration of dye solutions increases, the number of dye molecules increases, so the process will take a relatively long contact time to reach the equilibrium state.6The adsorbent dose parameter was displayed in “Fig. 4”, the removal percent of (10–50 ppm) BG onto activated date pits carbon (ADPC) increases with the increase in adsorbent dose ranged from (0.01–0.06 g) due to the availability of more adsorbent active sites as well as greater availability of specific surface area of the adsorbent. After that, there are no significant changes in removal percent were observed due to aggregation of adsorption sites takes place which makes the total ADPC surface area decrease, leading to a slighter increase in BG removal.52 So, (0.06 g) can be considered the optimal dose for ADPC loading.
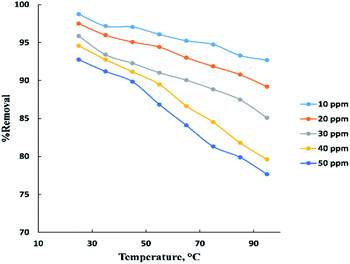
The temperature parameter is commonly used to indicate if the process is endothermic or exothermic. “Fig. 5” displays the temperature influence in neutral medium (pH = 6–7) for adsorption of BG at (10–50 ppm) on the surface of activated date pits carbon (ADPC) with constant weight (0.06 g). It is clearly shown that as temperature increased in the range (25–95 °C), the removal percent of BG decreased from 98% to 77%. This may be due to weakness of physical bonding between the dye molecules and the active sites of the adsorbent with increasing temperature. Also, as temperature increases, the solubility of dye increases, the interaction forces between the solute and the solvent become stronger than solute and adsorbent, so the solute is more difficult to adsorb. Therefore, it can be concluded that the process is exothermic.8,40
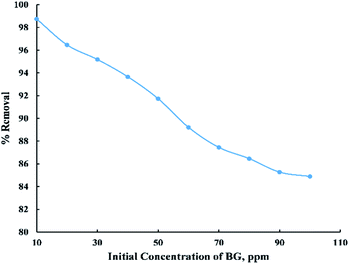
The initial BG concentration parameter was studied within the range (10–100 ppm) at 25 °C, 0.06 g adsorbent dose, and 55 min contact time. From “Fig. 6” it was observed that the removal percent decreased sharply with the increase in initial concentration up to 90 ppm then it noticed that there were no considerable changes in the removal percent and this can be explained by the fact that at low initial dye concentration the number of active sites on the adsorbent's surface is more available compared with high initial dye concentration. So, most of the dye molecules have been adsorbed on the surface of activated date pits carbon (ADPC) leading to higher percentage removal while at high initial BG concentration, molecules have low chances to be adsorbed due to the limited number of binding sites at the adsorbent's surface. Thus, some of the dye molecules remain in the solution and do not get adsorbed.6
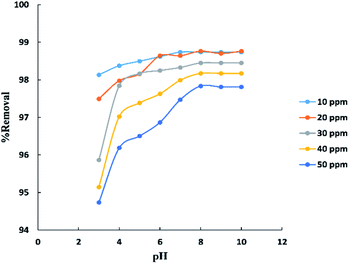
The pH parameter was investigated within the range (3–10) at (10–50 ppm) initial concentration of BG and room temperature (25–30 °C) as shown in “Fig. 7”. The results indicate that the removal percent of BG increases with the increase in pH up to pH 8 after which was observed no significant improvement in the process. This may be explained that at lower pH the surface charge of activated date pits carbon (ADPC) may get positively charged which make H+ ions compete effectively with dye cation leading to a decrease in the removal percent of dye adsorbed while at higher pH, the surface of ADPC may get negatively charged which enhances the electrostatic force of attraction between the positively charged dye cation and the adsorbent's surface.53 Also, at higher or lower pH, as the initial dye concentration increases, the competition between dye molecules to be adsorbed increases, so the removal percent decreases.40
Isotherm and equilibrium study
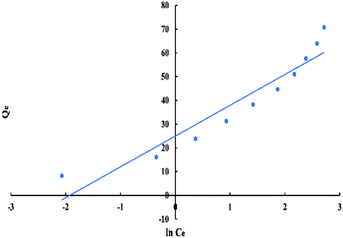
The isotherm study was carried out by fitting the experimental data to four isotherm models and find a convenient model that can be used for design purposes using the correlation coefficients, R2 values as shown in “Table 3”.| Isotherm models | Parameter value | Isotherm models | Parameter value |
|---|---|---|---|
| Langmuir model | Freundlich model | ||
| Qm (mg g−1) | 77.75539 | Kf (mg g−1) | 20.0302 |
| KL (L mg−1) | 0.306076 | n (g L−1) | 2.240371 |
| RL | 0.246259 | 1/n | 0.446355 |
| R2 | 0.9492 | R2 | 0.9973 |
| Temkin model | Dubinin–Radushkevich model | ||
| Kt (L mg−1) | 6.873598 | Kt (L mg−1) | 6.873598 |
| qm(J mol−1) | 12.95402 | qm (J mol−1) | 12.95402 |
| R2 | 0.9005 | R2 | 0.9005 |
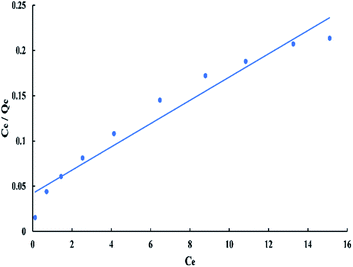
For Langmuir model, Ce/Qe versus Ce has a linear relationship as shown in “Fig. 8”, with a slope equal to 1/Qm and an intercept equal to 1/(QmKL). The linear Langmuir equation is given as:
| Ce/Qe = 1/(QmKL) + Ce/Qm | (3) |
| RL = 1/(1 + (KLCo)) | (4) |
The “RL” value lays between zero and one for favorable adsorption, whereas (RL > 1), (RL = 1), and (RL = zero) for unfavourable, linear, and irreversible adsorption respectively.40
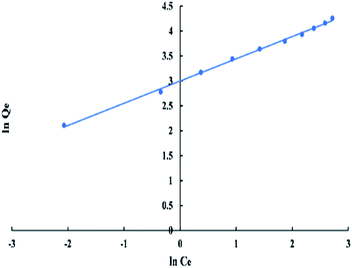
For Freundlich model, ln![[thin space (1/6-em)]](https://www.rsc.org/images/entities/char_2009.gif) Qe versus ln
Qe versus ln![[thin space (1/6-em)]](https://www.rsc.org/images/entities/char_2009.gif) Ce has a linear relationship as shown in “Fig. 9”, with an intercept equal to ln
Ce has a linear relationship as shown in “Fig. 9”, with an intercept equal to ln![[thin space (1/6-em)]](https://www.rsc.org/images/entities/char_2009.gif) Kf and a slope equal to 1/n. The logarithmic form of Freundlich is given by the following equation:
Kf and a slope equal to 1/n. The logarithmic form of Freundlich is given by the following equation:
ln![[thin space (1/6-em)]](https://www.rsc.org/images/entities/char_2009.gif) Qe = (1/n)ln Qe = (1/n)ln![[thin space (1/6-em)]](https://www.rsc.org/images/entities/char_2009.gif) Ce + ln Ce + ln![[thin space (1/6-em)]](https://www.rsc.org/images/entities/char_2009.gif) Kf Kf
| (5) |
Temkin model's equation can be expressed as:
Qe = qmln![[thin space (1/6-em)]](https://www.rsc.org/images/entities/char_2009.gif) Kt + qmln Kt + qmln![[thin space (1/6-em)]](https://www.rsc.org/images/entities/char_2009.gif) Ce Ce
| (6) |
![[thin space (1/6-em)]](https://www.rsc.org/images/entities/char_2009.gif) Ce as displayed in “Fig. 10”.
Ce as displayed in “Fig. 10”.
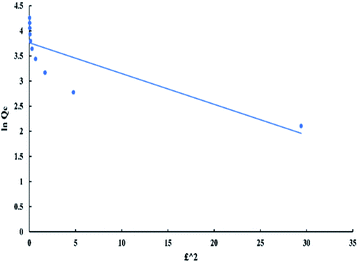
Dubinin–Radushkevich model can be represented by the following equations:
ln![[thin space (1/6-em)]](https://www.rsc.org/images/entities/char_2009.gif) Qe = ln Qe = ln![[thin space (1/6-em)]](https://www.rsc.org/images/entities/char_2009.gif) Qm − Dε2 Qm − Dε2
| (7) |
ε = RT![[thin space (1/6-em)]](https://www.rsc.org/images/entities/char_2009.gif) ln ln![[thin space (1/6-em)]](https://www.rsc.org/images/entities/char_2009.gif) ((Ce + 1)/Ce) ((Ce + 1)/Ce)
| (8) |
Kinetic study
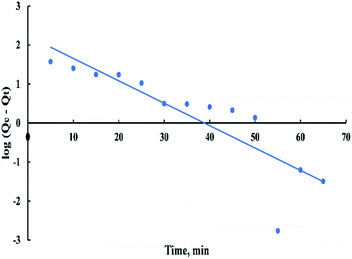
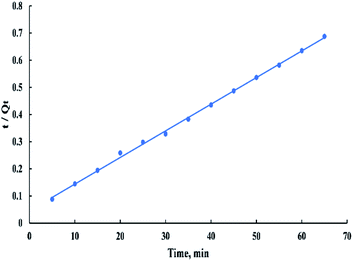
Four kinetic models were used to fit the experimental data at 50 ppm initial dye concentration using a linear regression analysis method. The parameters of these models are summarized in “Table 4”.| Kinetic models | Parameter value | Kinetic models | Parameter value |
|---|---|---|---|
| Pseudo-first-order model | Pseudo-second-order model | ||
| Qe “experimental” (mg g−1) | 94.52828 | Qe “experimental” (mg g−1) | 94.52828 |
| Qe “calculated” (mg g−1) | 169.7719 | Qe “calculated” (mg g−1) | 101.9671 |
| K1 (min−1) | 0.132227 | K2 (g mg−1 min−1) | 0.002101 |
| R2 | 0.7488 | R2 | 0.9986 |
| Elovich model | Intra-particle diffusion model | ||
| α (mg g−1 min−1) | 152.2538 | Kpi (mg g−1 min−0.5) | 6.080824 |
| β (g mg−1) | 0.066326 | C (mg g−1) | 50.92069 |
| R2 | 0.9583 | R2 | 0.8833 |
The pseudo-first-order rate expression is given as:
| log(Qe − Qt) = log(Qe) − ((K1t)/2.303) | (9) |
The linearized form of the pseudo-second-order model is given as:
| t/Qt = (1/(K2Qe2)) + t/Qe | (10) |
The Elovich model is generally expressed as:
Qt = (1/(β![[thin space (1/6-em)]](https://www.rsc.org/images/entities/char_2009.gif) ln[αβ])) + (1/(β ln[αβ])) + (1/(β![[thin space (1/6-em)]](https://www.rsc.org/images/entities/char_2009.gif) ln[t])) ln[t]))
| (11) |
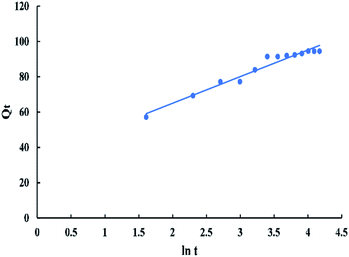
![[thin space (1/6-em)]](https://www.rsc.org/images/entities/char_2009.gif) t in “Fig. 14” gives a linear relationship with a slope of “1/β” and an intercept of 1/β
t in “Fig. 14” gives a linear relationship with a slope of “1/β” and an intercept of 1/β![[thin space (1/6-em)]](https://www.rsc.org/images/entities/char_2009.gif) ln(αβ).
ln(αβ).
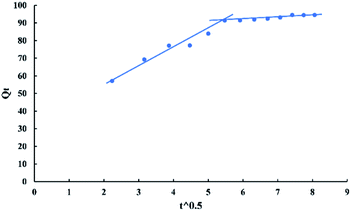
The intra-particle diffusion model used here refers to the theory proposed by Weber and Morris based on the following equation:
| Qt = Kpit0.5 + C | (12) |
Thermodynamic study
The thermodynamic parameters that used to describe the adsorption process are the change of Gibbs free energy (ΔG, kJ mol−1), enthalpy (ΔH, kJ mol−1), and entropy (ΔS, kJ mol−1 K−1). They are calculated depending on the equilibrium experimental data obtained at different temperatures from 298.15 to 368.15 K and 50 ppm initial dye concentration by using the Van't Hoff equations as follow:
ΔG = −RT![[thin space (1/6-em)]](https://www.rsc.org/images/entities/char_2009.gif) ln ln![[thin space (1/6-em)]](https://www.rsc.org/images/entities/char_2009.gif) K K
| (13) |
ln![[thin space (1/6-em)]](https://www.rsc.org/images/entities/char_2009.gif) K = ΔS/R − (ΔH/RT) K = ΔS/R − (ΔH/RT)
| (14) |
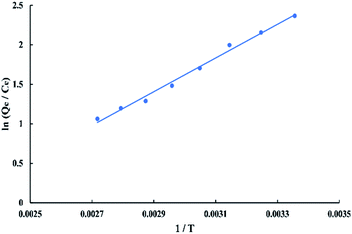
![[thin space (1/6-em)]](https://www.rsc.org/images/entities/char_2009.gif) K versus 1/T as shown in “Fig. 16” which gives −17.7324 kJ mol−1 enthalpy and −0.039729 kJ mol−1 K−1 entropy at 298 K. Gibbs free energy (ΔG) was calculated using “eqn (13)” which gives negative values at all temperatures so, the adsorption of BG onto activated date pits carbon (ADPC) is physiosorptive because the free energy values fall in the range of (−20 to 0 kJ mol−1).6 Hence, the links between dye molecules and the adsorbent surface can be due to van der Waals or electrostatic attraction forces. The negative values of ΔH and ΔS indicate that the adsorption of BG onto ADPC is exothermic and spontaneous at low temperature.40
K versus 1/T as shown in “Fig. 16” which gives −17.7324 kJ mol−1 enthalpy and −0.039729 kJ mol−1 K−1 entropy at 298 K. Gibbs free energy (ΔG) was calculated using “eqn (13)” which gives negative values at all temperatures so, the adsorption of BG onto activated date pits carbon (ADPC) is physiosorptive because the free energy values fall in the range of (−20 to 0 kJ mol−1).6 Hence, the links between dye molecules and the adsorbent surface can be due to van der Waals or electrostatic attraction forces. The negative values of ΔH and ΔS indicate that the adsorption of BG onto ADPC is exothermic and spontaneous at low temperature.40
Design of single-stage batch adsorber
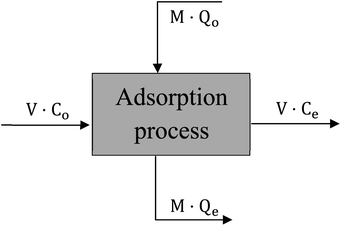
The design of batch adsorber is considered the practicable step for using the equilibrium data resulted from experimental work by calculating the required adsorber volume and the optimum adsorbent weight.40 “Fig. 17” displays a schematic diagram for the single-stage batch adsorber where the initial concentration of the dye changes from Co to Ce and the adsorption capacity of the adsorbent changes from Qo to Qe.The mass balance for the batch adsorber with a solution volume (V) and the amount of adsorbent (M) can be written as follow:
| MQo + VCo = MQe + VCe | (15) |
| V(Co − Ce) = M(Qe − Qo) | (16) |
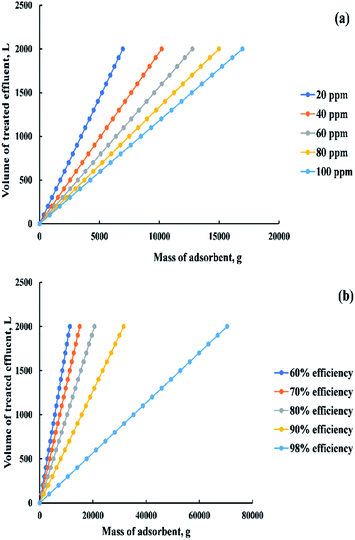
By using the Freundlich adsorption isotherm model as it is the best-fitted model and by assuming that activated date pits carbon (ADPC) is a fresh adsorbent (Qo = zero) so, “eqn (16)” can be rearranged as follow:
| M/V = (Co − Ce)/Qe = (Co − Ce)/[KfCe1/n] | (17) |
Based on the previous equation, a relationship was drawn in “Fig. 18a” between the mass of adsorbent and the volume of dye solution that needs to be treated (100![[thin space (1/6-em)]](https://www.rsc.org/images/entities/char_2009.gif) :
:![[thin space (1/6-em)]](https://www.rsc.org/images/entities/char_2009.gif) 2000 L) at a removal percent equal to 85% and a range of initial dye concentration from 20 to 100 ppm. Otherwise, a relationship was drawn in “Fig. 18b” between the previous variables but at different removal percent (60
2000 L) at a removal percent equal to 85% and a range of initial dye concentration from 20 to 100 ppm. Otherwise, a relationship was drawn in “Fig. 18b” between the previous variables but at different removal percent (60![[thin space (1/6-em)]](https://www.rsc.org/images/entities/char_2009.gif) :
:![[thin space (1/6-em)]](https://www.rsc.org/images/entities/char_2009.gif) 98%) and constant initial dye concentration (200 ppm).
98%) and constant initial dye concentration (200 ppm).
Proposed mechanism for the process
The general methodology for any adsorption process can be summarized in the following stages:(a) The dye molecules have to encounter the boundary layer effect for the adsorbent and diffuse from the boundary layer film onto the adsorbent surface.
(b) Diffusion of the dye molecules into the porous structure of the adsorbent where intra-particle diffusion of solute takes place in the adsorbed state or the liquid-filled pores of the particle.
According to the kinetic study, the pseudo-second-order is the best-fitted model for this process (R2 > 0.99) and from “Fig. 15” it's observed that the plot doesn't pass through the origin. Therefore, it can be concluded that the second stage is the rate-controlling stage.6,40
According to the thermodynamic study, it's clearly shown that the negative values of ΔG fall in the range of (−20 to 0 kJ mol−1) so, it can be concluded that the process is physiosorptive.6
Therefore, the process methodology can be deduced as follows:
(1) BG molecules encounter the boundary layer film and diffused rapidly onto the surface of activated date pits carbon (ADPC) due to the continuous shaking of bottles by the shaking water bath (Wisd laboratory instruments, DAHAN Scientific co., Ltd, 30, Korea).
(2) Intra-particle diffusion of BG molecules takes place in the porous structure of ADPC where hydrogen bonds (van der Waals or electrostatic attraction forces) were formed between BG molecules and the hydroxyl groups on the surface of ADPC until the process reaches the equilibrium state.
Conclusion
This study showed that activated carbon prepared from date pits (ADPC) by chemical activation with phosphoric acid was a favorable adsorbent for the removal of brilliant green dye from aqueous solutions over a wide range of concentrations. The optimum experimental data were 55 min contact time, 0.06 g adsorbent dose, and basic medium pH = 8. Kinetic and Equilibrium studies were best fitted with the pseudo-second order kinetic model (R2 > 0.99) and Freundlich isotherm model (R2 > 0.99). The specific surface area of ADPC was 311.38 m2 g−1 which gives a convenient maximum monolayer adsorption capacity of 77.8 mg g−1. The negative values of ΔG were demonstrated that the process is physical adsorption and spontaneous at low temperatures concerning the negative values of ΔH and ΔS which proved that the reaction is exothermic and as the temperature increase, the solubility of dye molecules increase so removal percent decrease.Conflicts of interest
There are no conflicts to declare.References
- A. Mittal and J. Mittal, in Green Chemistry for Dyes Removal from Wastewater, ed. K. Sanjay Sharma , Scrivener Publishing LLC, USA, 2015, pp. 409–457 Search PubMed.
- H. Daraei and A. Mittal, Desalin. Water Treat., 2017, 90, 294–298 CrossRef CAS.
- J. Mittal, V. Thakur and A. Mittal, Ecol. Eng., 2013, 60, 249–253 CrossRef.
- V. S. Mane and P. V. V. Babu, Desalination, 2011, 273, 321–329 CrossRef CAS.
- K. Bing, M. Vakili, B. Amini, P. Eong, A. Zuhairi and B. Salamatinia, Sep. Purif. Technol., 2015, 150, 229–242 CrossRef.
- M. Saif, U. Rehman, M. Munir, M. Ashfaq and N. Rashid, Chem. Eng. J., 2013, 228, 54–62 CrossRef.
- S. Soni, P. K. Bajpai, J. Mittal and C. Arora, J. Mol. Liq., 2020, 314, 113642 CrossRef CAS.
- J. Gao, Q. Zhang, K. Su, R. Chen and Y. Peng, J. Hazard. Mater., 2010, 174, 215–225 CrossRef CAS.
- H. Ben Amor, A. Mabrouk and N. Talmoudi, Int. J. Eng. Res. Gen. Sci., 2015, 3, 6–17 Search PubMed.
- J. Mittal, Reson. J. Sci. Educ., 2020, 25, 567–577 Search PubMed.
- A. Mittal and L. Kurup, Ecol. Environ. Conserv., 2006, 12, 181–186 CAS.
- A. Mittal, R. Ahmad and I. Hasan, Desalin. Water Treat., 2016, 57, 17790–17807 CrossRef CAS.
- V. Kumar, P. Saharan, A. K. Sharma, A. Umar, I. Kaushal, A. Mittal, Y. Al-Hadeethi and B. Rashad, Ceram. Int., 2020, 46, 10309–10319 CrossRef CAS.
- H. Daraei, A. Mittal, M. Noorisepehr and F. Daraei, Environ. Sci. Pollut. Res., 2013, 20, 4603–4611 CrossRef CAS.
- I. Anastopoulos, I. Pashalidis, A. G. Orfanos, I. D. Manariotis, T. Tatarchuk, L. Sellaoui, A. Bonilla-Petriciolet, A. Mittal and A. Núñez-Delgado, J. Environ. Manage., 2020, 261, 110236 CrossRef CAS.
- R. Ahmad, I. Hasan and A. Mittal, Desalin. Water Treat., 2017, 58, 144–153 CrossRef CAS.
- A. Mittal, R. Ahmad and I. Hasan, Desalin. Water Treat., 2016, 57, 19820–19833 CrossRef CAS.
- A. Mittal, R. Ahmad and I. Hasan, Desalin. Water Treat., 2016, 57, 15133–15145 CrossRef CAS.
- I. Anastopoulos, A. Mittal, M. Usman, J. Mittal, G. Yu, A. Núñez-Delgado and M. Kornaros, J. Mol. Liq., 2018, 269, 855–868 CrossRef CAS.
- C. Arora, S. Soni, S. Sahu, J. Mittal, P. Kumar and P. K. Bajpai, J. Mol. Liq., 2019, 284, 343–352 CrossRef CAS.
- V. K. Gupta, S. Agarwal, R. Ahmad, A. Mirza and J. Mittal, Int. J. Biol. Macromol., 2020, 158, 1310–1318 CrossRef CAS.
- A. Mittal, R. Jain, J. Mittal and M. Shrivastava, Fresenius Environ. Bull., 2010, 19, 1171–1179 CAS.
- M. B. Alqaragully, Int. J. Adv. Res. Chem. Sci., 2014, 1, 48–59 Search PubMed.
- A. Mittal, V. Thakur and V. Gajbe, Environ. Sci. Pollut. Res., 2012, 19, 2438–2447 CrossRef CAS.
- S. Sajjadi, A. Meknati, E. Claudio, G. L. Dotto, D. I. Mendoza-castillo, I. Anastopoulos, F. Alakhras, E. I. Unuabonah, P. Singh and A. Hosseini-bandegharaei, J. Environ. Manage., 2019, 236, 34–44 CrossRef CAS.
- J. Han, L. Zhang, B. Zhao, L. Qin, Y. Wang and F. Xing, Ind. Crop. Prod., 2019, 128, 290–297 CrossRef CAS.
- A. Karen, L. A. Godínez, F. Espejel, R. Ramírez-zamora and I. Robles, Waste Manag, 2019, 85, 202–213 CrossRef.
- A. F. M. Streit, L. N. Côrtes, S. P. Druzian, M. Godinho, G. C. Collazzo, D. Perondi, G. L. Dotto and C. Violet, Sci. Total Environ., 2019, 660, 277–287 CrossRef CAS.
- E. Menya, P. W. Olupot, H. Storz, M. Lubwama and Y. Kiros, Chem. Eng. Res. Des., 2018, 129, 271–296 CrossRef CAS.
- P. Nai, Y. Yek, R. Keey, M. Shahril, C. Leing, J. Huang, Y. Park and S. Shiung, J. Environ. Manage., 2019, 236, 245–253 CrossRef.
- K. Singh, S. H. Hasan and O. Nath, Groundw. Sustain. Dev., 2018, 7, 48–55 CrossRef.
- T. Ahmad and M. Danish, Environ. Sci. Pollut. Res., 2012, 19, 1464–1484 CrossRef CAS.
- M. del Rosario Moreno-Virgen, R. Tovar-Gómez, I. Didilia Mendoza-Castillo, and A. Bonilla-Petriciolet, in Lignocellulosic Precursors Used in the Synthesis of Activated Carbon-Characterization Techniques and Applications in the Wastewater Treatment, ed. A. Bonilla-Petriciolet and V. Hernández-Montoya, BoD–Books on Demand, México, 2012, pp. 58–71 Search PubMed.
- F. Al-Qaessi and L. ABU-FARAH, Energy Sources, Part A, 2010, 32, 1316–1325 CrossRef CAS.
- K. Mahmoudi, N. Hamdi and E. Srasra, J. Mater. Environ. Sci., 2014, 5, 1758–1769 Search PubMed.
- B. K. Nandi, A. Goswami and M. K. Purkait, J. Hazard. Mater., 2009, 161, 387–395 CrossRef CAS.
- V. S. Mane, I. D. Mall and V. C. Srivastava, J. Environ. Manage., 2007, 84, 390–400 CrossRef CAS.
- A. Mittal, D. Kaur and J. Mittal, J. Colloid Interface Sci., 2008, 326, 8–17 CrossRef CAS.
- G. Tafti, S. Dahdivan and Y. Ardakani, Int. Food Res. J., 2017, 24, 1399–1406 Search PubMed.
- R. A. Mansour, N. M. Aboeleneen and N. M. Abdelmonem, Int. J. Phytorem., 2018, 20, 1062–1074 CrossRef CAS.
- A. F. Halbus, Z. H. Athab and F. H. Hussein, Int. J. Chem. Sci., 2013, 11, 1219–1233 CAS.
- A. A. A. Salam, A. Mohammed, F. Mabood, W. Abdlatef, I. Wadi and E. Yousif, Drink. Water Eng. Sci. Discuss., 2018, 11, 1–8 CrossRef.
- N. L. U. Kumar, Int. J. Environ. Sci. Technol., 2018, 16, 1649–1662 Search PubMed.
- Y. İ. Coşkun, N. Aksuner and J. Yanik, Acta Chim. Slov., 2019, 66, 402–413 CrossRef.
- A. Amina and H. Zaghouane-boudiaf, Microchem. J., 2019, 146, 1255–1262 CrossRef.
- F. D. C. Silva, M. Maria, L. Clécio, B. Lima, J. A. Osajima and S. Filho, Int. J. Biol. Macromol., 2018, 114, 470–478 CrossRef CAS.
- R. Mansour, M. G. Simeda and A. Zaatout, Desalin. Water Treat., 2020, 202, 396–409 CrossRef CAS.
- J. Coates, in Encyclopedia of analytical chemistry, ed. R.A. Meyers, John Wiley & Sons Ltd, 2006, pp. 10815–10837 Search PubMed.
- B. Smith, Infrared Spectral Interpretation: A Systematic Approach, CRC press, United States of America, 1998 Search PubMed.
- P. Larkin, Infrared and Raman Spectroscopy Principles and Spectral Interpretation, Elsevier, United States of America, 2011 Search PubMed.
- A. Chandra, S. Talari, M. A. G. Martinez, S. Rehman, I. U. Rehman, A. Chandra, S. Talari and M. A. G. Martinez, Appl. Spectrosc. Rev., 2017, 52, 456–506 CrossRef.
- H. H. Hammud, A. Shmait and N. Hourani, RSC Adv., 2015, 5, 7909–7920 RSC.
- R. Baccar, P. Blánquez, J. Bouzid, M. Feki and M. Sarrà, Chem. Eng. J., 2010, 165, 457–464 CrossRef CAS.
- D. Pathania, S. Sharma and P. Singh, Arabian J. Chem., 2013, 10, S1445–S1451 CrossRef.
- K. Z. Mostafa Rajabi, O. Moradi, M. Sillanpää, V. K. G. Abdullah, M. Asiri and S. Agarwal, J. Mol. Liq., 2019, 293, 111484 CrossRef.
| This journal is © The Royal Society of Chemistry 2021 |

