 Open Access Article
Selective and sensitive visible-light-prompt photoelectrochemical sensor of paracetamol based on Bi2WO6 modified with Bi and copper sulfide†
Yijiong Lia,
Xiaoguang Yua,
Ruiqi Lia,
Feng Zhaoa,
Guobin Liua and
Xin Wang *b
*b
aDepartment of Orthopaedics, The First Hospital of Hebei Medical University, Shijiazhuang, Hebei 050000, P. R. China
bDepartment of Pathology, The First Hospital of Hebei Medical University, Shijiazhuang, Hebei 050000, P. R. China. E-mail: wangxin1850@163.com
First published on 12th January 2021
Abstract
Paracetamol (PA) is a ubiquitous non-steroidal anti-inflammatory drug, mainly used to treat headaches, arthritis and osteoarthritis and other diseases. In this work, a novel label free photoelectrochemical (PEC) sensor based on Bi–CuS/Bi2WO6 has been developed for the detection of PA, which was fabricated by a simple two-step hydrothermal process. It was found that Bi–CuS/Bi2WO6 with a CuS/Bi2WO6 heterojunction and surface plasmon resonance (SPR) effect of Bi possesses enhanced charge transfer and absorption wavelengths under visible light, particularly when compared to pristine Bi2WO6 films, thus producing an increase in the observed photocurrent. The photocurrent was increased after adding PA. And the photocurrent increment was linear with PA concentration in the range from 0.01–60 μM with a detection limit of 2.12 nM. Moreover, the PEC sensor also exhibited high anti-interference property and acceptable stability. In the present study, a Bi–CuS/Bi2WO6 photoelectrode is considered a promising candidate for carrying out PEC analysis.
1. Introduction
Paracetamol (PA), one of the frequently used anti-inflammatory and antipyretic agents, has been extensively adopted to relieve migraine, headache, osteoarthritis pain and postoperative pain in the clinic.1,2 Nonetheless, long-term and excess PA application can result in toxic metabolite accumulation, thereby damaging the liver or kidneys.3 As a result, it is of much importance to develop a simple, sensitive and accurate quantitative tool for PA analysis, which can be applied in quality control and clinical diagnosis to analyze PA-containing drugs.Various approaches have been employed for the determination of paracetamol in pharmaceutical tablets and biological fluids including UV-vis spectrophotometry,4 high performance liquid chromatography (HPLC),5 fluorescence,6 and electrochemical techniques.7 Among these methods, electrochemical methods attract enormous attention due to their fast response, high sensitivity and real-time detection, but they suffer from low selectivity. Photocatalytic method is an effective and promising way to remove PA owing to its high efficiency.8 Based on the discussion above, PEC method emerges to be a promising candidate for detecting and removing PA because it possesses the advantages of both electrochemical and photocatalytic technology.9 Therefore, the photoelectrochemical (PEC) method has attracted considerable attention for the potential development of PEC paracetamol sensors, not least for the reason that there is minimal instrumentation setup, in addition to simple sample preparation.10,11 At present, only Gao's group12 made the preparation of N-doped graphene quantum dots embedded in BiOBr nanosheets that could be used for quantitative photoelectrochemical detection PA.
Currently, the Bi-based semiconductor materials including BiPO4,13 BiVO4,14 Bi2WO6 ref. 15 and BiFeO3,16 may be the candidate active catalysts, since they have high photocatalytic activity under visible light. The Bi-based semiconductors are linked with the Bi 6s and O 2p hybrid orbitals, narrowed band gap as well as deep valance band, which have received extensive interest in the study of PEC owing to abundance, low toxicity, and low cost.17,18 Furthermore, the morphological structure of Bi2WO6 has significant influence on its physical and chemical properties, which being composed of the Bi2O2 layers and WO6 octahedral structure layers.19 Moreover, Bi2WO6 has been one of the promising visible-light-driven photocatalysts with a moderate band gap (about 2.5 eV).20,21 Given the above-mentioned merits, Bi2WO6 is extensively applied in the photocatalytic system to reduce carbon oxide, split water, and degrade organic pollutants.22–24 Nevertheless, the high recombination rate of photo-generated electron–hole pairs results in low efficiency of energy conversion. In order to deal with this problem, the development of heterojunction has been revealed as an efficient strategy to enhance the migration and separation efficiency of photogenerated charge.25,26 In addition, the incorporation of noble metals (Ag, Au) onto Bi2WO6 could improve the light absorption ability and stimulate the effective separation of photo-generated electron–hole due to the surface plasmon resonances.27,28
Bismuth (Bi), one of the semimetals, is well-known for its narrow band gap, low carrier density, great anisotropic Fermi surface, great carrier mean free path and low carrier effective mass. As a result, it has provided the investigators with many model systems for the exploration of one-dimensional materials.29,30 Recently, metallic Bi, which is apparently cheaper and easier for synthesis than noble metals, has been suggested to show surface plasmon resonance (SPR) like the noble metal. As a result, metallic Bi can be used to replace the noble metals for improving the photocatalyst photocatalytic activities due to its SPR effect.
Semiconductor chalcogenides have received tremendous interest, owing to their high abundance and low cost.31 Copper sulfide (CuS) exhibits availability, versatility as well as low toxicity, as a p-type semiconductor.32 Particularly, it also presents unique electronic and optical properties. Moreover it applied in catalysis, solar cell, sensing and lithium ion batteries. CuS is a narrow-bandgap semiconducting material (about 1.7 eV), which has been used to couple with bismuth-based semiconductors to improve photocatalytic performance.33–35
In this work, Bi–CuS/Bi2WO6 nanocomposites were prepared via hydrothermal process, and a sensitive label free PEC sensor based on Bi–CuS/Bi2WO6 was fabricated for the determination of PA. Bi NPs could enhance the light absorption of Bi2WO6 in the visible spectral range due to SPR and improve the separation of photo-generated charge carriers, consequently strengthen the PEC conversion efficiency of Bi–CuS/Bi2WO6. The results indicated that Bi–CuS/Bi2WO6 modified by Bi NPs and CuS were with good PEC activity and stability for PA application.
2. Experimental section
2.1. Reagents
All these reagents used in the experiment were of analytical grade, and were not purified further before use. Bismuth nitrate pentahydrate (Bi(NO3)3·5H2O), thiourea (CH4N2S), copper nitrate trihydrate (Cu(NO3)2·3H2O), sodium tungstate dihydrate (Na2WO4·5H2O) and sodium sulfate (Na2SO4) were provided by the Sinopharm Chemical Reagent Co., Ltd (Shanghai, China, http://www.sinoreagent.com).2.2. Preparation of all materials
Bi2WO6 material synthesis: add appropriate 2 mmol Bi(NO3)3·5H2O to ultrapure water (40 mL). 1 mmol of Na2WO4·5H2O was then added to obtained suspension slowly and appropriately under continuous stirring. Subsequently, the mixed suspension received another 1 h of stirring. After being transferred to a Teflon-lined autoclave (100 mL), the mixed solution underwent 20 h of heating treatment at 180 °C. At last, deionized water together with ethanol helped to wash the product for three times, followed by drying treatment at 60 °C.CuS/Bi2WO6 composite synthesis: 1 mmol of Bi2WO6 was added to 20 mL of ultrapure water, and different contents of CH4N2S and Cu(NO3)2·3H2O were added to the suspension obtained above, which were stirred continuously. Subsequently, the mixed suspension received another 30 min of stirring, and then 10 mL ethanol solution was added to the above suspension. After being transferred to 50 mL Teflon-lined autoclave, the mixed solution underwent 12 h of heating at 200 °C. The obtained samples were washed, calcined, and denoted as CuS/Bi2WO6-X%, X represents CuS mass percentage (3, 6 and 9%). The Bi–CuS/Bi2WO6-6% was obtained with adding glucose through the above method.
2.3. Characterization
A Bruker D8 Advance diffractometer equipped with Cu Kα radiation was applied for performing the X-ray diffraction (XRD). An ESCALAB 250Xi was employed to carry out the X-ray photoelectron spectroscopy (XPS). A UV-visible (UV-vis) spectrophotometer helped to collect the diffuse reflection spectra (DRS) exhibited by these materials, taking BaSO4 as the reference. The scanning electron microscopy (SEM) together with the transmission electron microscopy (TEM) helped characterize the morphology exhibited by these samples.2.4. Electrochemical experiments
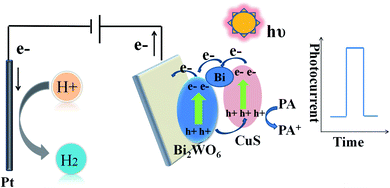
Experimenters implemented electrochemical experiments on a CHI 660E electrochemical workstation equipped with a three-electrode system. Pt wire was used as the counter electrode, saturated calomel electrode (SCE) as the reference electrode, and indium tin oxide (ITO) glass as the working electrode. The PEC experiment was outlined in Scheme 1. In brief, the whole mechanism related to PEC process is interpreted below: (1) photoactive semiconductor for absorbing light, (2) production of holes (h+) and electrons (e−) as the charge carriers, as well as (3) charge carrier separation (photoholes to electrolyte, photoelectrons to WE). The light source came from a xenon lamp (PLS-SXE 300, 100 mW cm−2, λ ≥ 420 nm). Electrochemical impedance spectroscopy (EIS) was performed in Na2SO4 (0.1 M, PH = 7). Water, acetone, and ethanol were employed to separately wash ITO electrodes (10 × 15 mm) for five minutes. Then experimenters dispersed 3 mg catalyst powders in the mixture of chitosan and ethanol (0.5 mL) for forming a homogeneous suspension, followed by coating 20 μL of the suspensions on ITO electrodes (0.5 cm2).2.5. HPLC analysis of PA
The content of paracetamol in commercial pharmaceutical samples was determined using HPLC (Agilent 1260, Agilent Technologies Inc., USA) followed the methods performed as indicated in Pharmacopoeia of the People's Republic Chian. The chromatographic separation was applied using a mobile phase of water and methanol (60/40), through a C18 column (Eclipse PluseC18, 4.6 × 150 mm, 5 mm) and were analyzed at 273 nm by the ultraviolet-visible (UV/VIS) variable wavelength detector (VWD G1314A, Agilent Technologies Inc, USA). The column temperature, the flow rate and the injection volume were set at 30 °C, 20 mL and 1 mL min−1, respectively.3. Results and discussion
3.1. Physical characterization
More detailed characterization regarding its composition/crystallinity by the X-ray diffraction (XRD) pattern (Fig. 1) confirms its pure Bi2WO6 (JCPDS 39-0256). Moreover, For CuS/Bi2WO6, the XRD patterns with different proportions are not only consistent with the diffraction peaks of pure Bi2WO6, but also the diffraction peaks at 27.52°, 31.78°, 53.04° correspond to (100), (103) and (108) crystal planes of CuS (JCPDS 06-0464). When adding Bi, the characteristic peaks at approximately 27.15° and 37.94°, matching with (012) and (104) of JCPDS card no. 44-1246. The results indicate that metal Bi and CuS successfully complexed with Bi2WO6.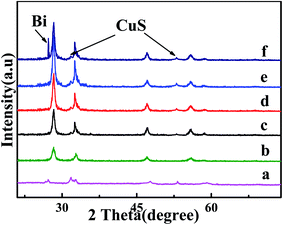 | ||
| Fig. 1 XRD patterns of (a) CuS; (b) Bi2WO6; (c) CuS/Bi2WO6-3%; (d) CuS/Bi2WO6-6%; (e) CuS/Bi2WO6-9%; (f) Bi–CuS/Bi2WO6-6%. | ||
The XPS spectrum for Bi–CuS/Bi2WO6-6% is presented in Fig. 2A. Elements Bi, O, S, W and Cu were verified to present within the sample. The high-resolution XPS spectrum for Bi 4f is displayed in Fig. 2B. The peaks observed were additionally deconvoluted to 3 distinct groups located at 158.7 eV and 163.9 eV, as wel as 159.3 eV and 164.6 eV, separately. Typically, those 2 peaks observed at 159.3 eV and 164.6 eV were indexed to Bi3+ in Bi2WO6,11 whereas those at 157.1 and 162.5 eV were associated with metallic Bi0.29 Those 2 peaks observed at 35.4 and 37.4 eV were linked with W 4f7/2 and W 4f5/2, separately (Fig. 2C), suggesting the presence of W6+ within the WO6 octahedron.27 Cu 2p whose peaks centered at 932.2 eV (Cu 2p3/2) and 952.0 eV (Cu 2p1/2) are displayed in Fig. 2D. In addition, satellite peaks at 941.5 eV confirmed the presence of +2 oxidation state copper, which revealing that Cu element exists in Cu2+ state.31 The O 1s spectra are presented in Fig. 3E. Clearly, the spectra were classified as 3 peaks at 530.1 eV, 530.9 eV and 532.2 eV, separately, and they were associated with [Bi2O2]2+ ref. 30 as well as the crystal lattice oxygen within [WO4]2−.28 As seen from Fig. 2F, the doublet peaks centered at 167.7 eV targets S 2p1/2 and that at 162.3 eV targets S 2p3/2, indicating the existence of metal sulfides.32 According to XPS analysis, metal Bi, CuS and Bi2WO6 existed within the composite, conforming to XRD results.
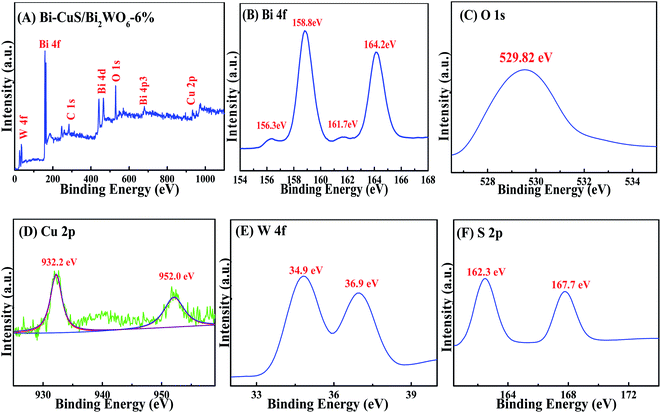 | ||
| Fig. 2 XPS spectra of Bi–CuS/Bi2WO6-6% composites: (A) survey, (B) Bi 4f, (C) O 1s, (D) Cu 2p, (E) W 4f and (F) S 2p. | ||
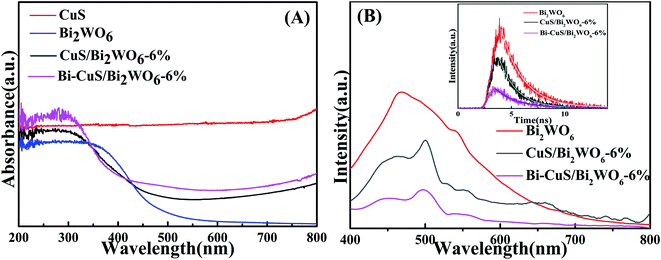 | ||
| Fig. 3 UV-vis diffuse reflectance spectra (A), PL spectra (B) of the Bi2WO6, CuS/Bi2WO6-6% and Bi–CuS/Bi2WO6-6%. | ||
The optical absorption properties of the as-prepared samples could be acquired by the UV-vis diffuse reflectance spectrometer (DRS). According to Fig. 3A, as an UV light driven photocatalyst, CuS have absorption ability in 200–800 nm. As a visible light driven photocatalyst, the absorption edge for Bi2WO6 is about 460 nm. Through combining Bi2WO6 with CuS, the absorption intensity of the heterostructure has been greatly enhanced compared to that of Bi2WO6. Moreover, the samples with metallic Bi show strong absorption of visible light, which was caused by the SPR effect of Bi.36 For figuring out the recombination and charge transfer process of carrier in the PEC process, the PL spectrum of the synthetic material was measured, (Fig. 3B). The strong peak appeared at 475 nm for Bi2WO6 CuS/Bi2WO6-6% and Bi–CuS/Bi2WO6-6% composite, the peak intensity of Bi–CuS/Bi2WO6-6% was significantly lower than that of others. The results indicated that the composite materials formed by CuS and Bi with Bi2WO6 can reduce the recombination efficiency of charge carriers.37 In addition, the insert map of Fig. 3B shows the fitting curve of the material's electronic decay time via the time-resolved PL spectrum. The lifespans of Bi2WO6, CuS/Bi2WO6-6% and Bi–CuS/Bi2WO6-6% are 1.07, 1.25 and 1.89 ns, which indicate that Bi–CuS/Bi2WO6-6% has excellent the charge carrier transport capacity.38 According to the above discussion, Bi–CuS/Bi2WO6-6% has excellent PEC performance.
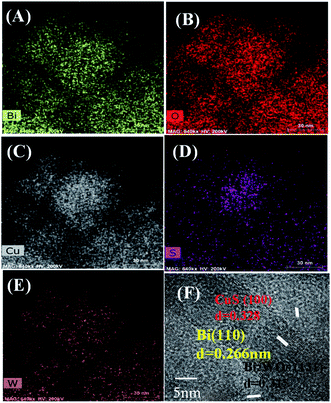
The morphology of Bi2WO6 and Bi–CuS/Bi2WO6-6% composites were studied by SEM. It can be seen from Fig. 4A and B that the overall morphology of the composite is stacked in layers. This may provide multiple active sites to improve catalytic performance. Fig. 5A–E further analyzes the main elemental components of Bi–CuS/Bi2WO6-6% through mapping images and high-resolution TEM (HRTEM) images. Fig. 5F shows three lattice spacings of 0.328 nm, 0.315 nm, and 0.266 nm, respectively, which are consistent with the CuS (100), Bi2WO6 (131), and Bi (110) planes in XRD. These results further prove that Bi–CuS/Bi2WO6-6% heterostructures were successfully prepared.
3.2. Optimization of conditions
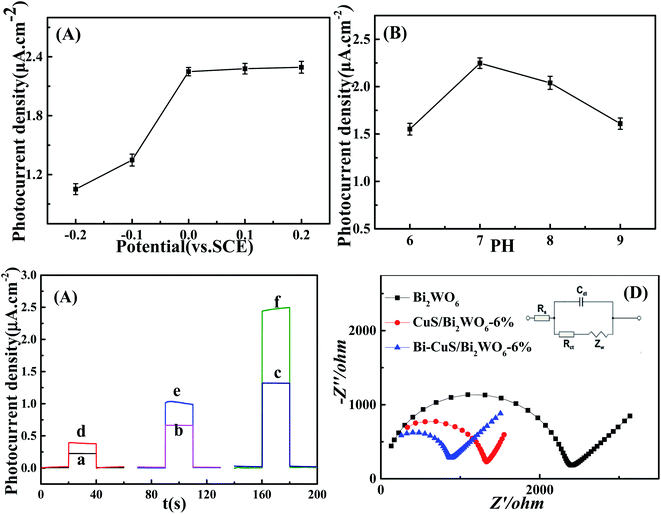
This study optimized all experimental parameters related to the synthesis of PEC sensor to fabricate the best photoelectrochemical sensor to detect PA. It was discovered that, the applied potential greatly affected the as-constructed sensor performance, as observed in Fig. 6A displaying the responses of photocurrent density to diverse applied potentials. A linear relationship is observed between increasing photocurrent density and the applied potential, with the highest photocurrent density signal response achieved at 0 V. This suggests improved different applied potential, causing increased photoelectric response ability, photocurrent density response plateaus at 2.25 μA cm−2. But the Fig. 6A shows that the photocurrent density changes little under different voltages, while reducing the counter electrode surface loss, therefore, 0 V was chosen to be the best applied potential to develop PA sensor electrode. In addition, this study examined how pH affected Bi–CuS/Bi2WO6-6% PEC performance in Na2SO4 (pH range, 6–9). It was illustrated from Fig. 6B that, PEC sensor achieved the highest photocurrent density at pH 7. Therefore, pH 7 was used for later analysis.3.3. Photoelectrochemical properties
The traditional three-electrode electrochemical system was used to estimate those photoelectrochemical behaviors of Bi2WO6, CuS/Bi2WO6-6% as well as Bi–CuS/Bi2WO6-6% microstructures, and 0.1 M Na2SO4 was used as the supporting electrolyte, with 0 V applied bias. In Fig. S1,† the CuS-modified Bi2WO6 sample showed increased photocurrent density relative to the primary Bi2WO6 in the presence of visible light irradiation. According to this result, there are enhanced number of photoexcited electrons due to heterojunction growth of CuS on Bi2WO6, improving the photoelectrochemical activity of the CuS/Bi2WO6-6% microstructures. In the Fig. 6C, the photocurrent density of Bi–CuS/Bi2WO6-6% was found to be 2.2 and 6 times greater than CuS/Bi2WO6-6% and Bi2WO6, respectively. When adding the 1 μM PA, the photocurrent density change value of Bi–CuS/Bi2WO6-6% is most obviously. Based on such findings, the electron–hole recombination was reduced, indicating that CuS and Bi existed within the Bi2WO6. Fig. 6D shows the Nyquist plots for those constructed PEC electrodes. The lower arc radius was seen within high frequency region and it was associated with the charge transfer resistance (Rct), suggesting the high charge transfer efficiency; besides, Bi2WO6 restricted electron transfer. Nonetheless, when the CuS heterojunction was formed, the resistivity apparently declined, and this was related to rapid electron transfer via Bi and CuS within the Bi2WO6 system. Therefore, EIS results suggest the successful fabrication of the PEC sensor.3.4. Photoelectrochemical sensing
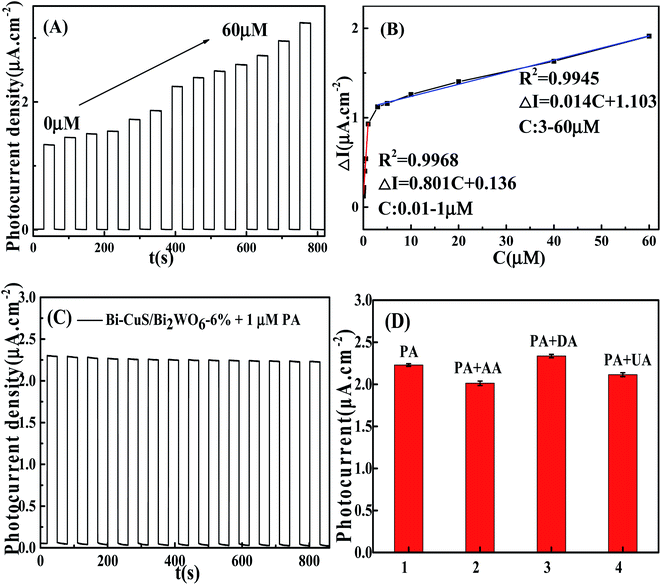
In order to study the potentiality of the fabricated modified CuS and Bi in Bi2WO6 electrode for photoelectrochemical sensing, PA was chosen as the model analyte. The transient photocurrent density responses of Bi–CuS/Bi2WO6-6% in the presence of 0.1 M Na2SO4 with successive addition of different molar concentration (0.01 to 60 μM) can be found in Fig. 7A. The photocurrent density decreases monotonically with the increase in PA concentration from 0.01 to 60 μM, suggesting that the photoelectric conversion process is being hindered due to incorporation of PA. Scheme 1 illustrates the potential mechanism in the detection of PA. It was well-known that, CuS and Bi2WO6 have the band gaps of approximately 2.18 and 2.82 eV, separately (Fig. S2†), besides, the former has increased conduction band (CB) and valence band (VB) positions compared with the latter. The CuS nanoparticles can be excited under irradiation and the charges are separated to produce holes (h+) and electrons (e−). Bi metal has SPR effect along with favorable conductivity; therefore, Bi may be adopted to be the electron conductor or contributor for improving PEC action. Thereafter, those photogenerated electrons rapidly transfer to Bi2WO6 because they have different CB energy levels. When PA is put into the electrolyte, those isolated holes on Bi2WO6 VB enter CuS to oxidize PA and acquire electrons, thus continuously producing photoelectrons. Such explanation also demonstrates the reason why Bi–CuS/Bi2WO6-6% may be adopted to detect PA. The association of photocurrent density increment I–I0 with PA content is displayed in Fig. 7B, with I and I0 indicating photocurrent intensity with and without PA, separately. The linear regression of PA content as a function of photocurrent density change is illustrated in Fig. 7B, the following equations are obtained, I–I0 = 0.136 + 0.081C (C-PA content, 0.01–1 μM; correlation coefficient R = 0.9968) along with I–I0 = 1.103 + 0.014C (C-PA content, 3–60 μM; correlation coefficient R = 0.9945), with the LOD of 2.12 nM. As a result, the present Bi–CuS/Bi2WO6-6% determines PA with linearity under applied bias. The current work owes to the electron contributor and conduct ability of Bi and the efficient charge separation by quenching the recombination of electron–hole pairs through heterojunction formation between CuS and Bi2WO6. A comparative Table S1† has been shown with the existing techniques and their values in the literature.It was illustrated from Fig. 7C that, the Bi–CuS/Bi2WO6-6% sensor was examined at the 800 s under visible light. Its photocurrent density was still unchanged under persistent radiation of chopped on-off light, indicating that the as-modified electrode was stable in PEC process. In order to study the sensor for its target analyte, interference experiments were conducted with the nanoprobe to individually detect target PA and other interfering substances at same experimental conditions. According to the results, that PA revealed large photocurrent density response, whereas 10-fold of interfering substances brought out no significant photocurrent density change (Fig. 7D), suggesting the good selectivity of sensor for PA detection.
3.5. Application in real sample
The feasibility of the fabricated photoelectrochemical sensor was analyzed by determining PA in commercial pharmaceutical samples, which was bought from the local drugstore. Initially, there paracetamol commercial tablets were ground to powders and the content of paracetamol in three tablets was determined by HPLC. Then the above paracetamol powders were dissolved in 0.1 M Na2SO4 solution and diluted till the range of working concentration to determine PEC. For PEC, its average percentage recovery was 96.88–102.14%, as determined by the proposed approach (Table 1). Based on such findings, the as-constructed Bi–CuS/Bi2WO6-6% electrode is highly sensitive and selective in the detection of PA within pharmaceutical samples.| Sample | Labeled (μM) | Added (μM) | Found (μM) | Recovery (%) | RSD (%) | HCLP (μM) |
|---|---|---|---|---|---|---|
| 1 | 0.6 | 1.00 | 1.55 | 96.88 | 2.12 | 1.57 |
| 2 | 1.2 | 1.00 | 2.15 | 97.72 | 3.51 | 2.23 |
| 3 | 1.8 | 1.00 | 2.86 | 102.14 | 3.06 | 2.85 |
4. Conclusions
To conclude, a Bi–CuS/Bi2WO6 ternary nanocomposite was firstly synthesized and employed to construct novel PEC sensing platform. Besides, advantages of the detection include time-cost saving and facile operation in comparison with conventional methods. The photoactive materials not only present distinctly enhanced visible-light PEC activity but also provide an ideal platform to directly fabricate sensor for PA detection. The proposed method has high sensitivity and good selectivity, holding great potentials for PA residue analysis in real samples.Conflicts of interest
The authors declare no conflict of interest.Acknowledgements
We acknowledge financial supported by grant from the Medical Science Key Research Program of Hebei China (20170484).References
- I. Lung, M. L. Soran, A. Stegarescu, O. Opris, S. Gutoiu, C. Leostean, M. D. Lazar, I. Kacso, T. D. Silipas and A. S. Porav, J. Hazard. Mater., 2021, 403, 123528 CrossRef CAS.
- C. S. Kushwaha and S. K. Shukla, ACS Appl. Polym. Mater., 2020, 2, 2252–2259 CrossRef CAS.
- J. Zia and U. Riaz, ACS Omega, 2020, 5, 16386–16394 CrossRef CAS.
- B. Doğan, A. Elik and N. Altunay, Microchem. J., 2020, 154, 104645 CrossRef.
- T. A. P. Fernandes, J. P. Aguiar, A. I. Fernandes and J. F. Pinto, J. Pharm. Anal., 2017, 7, 401–405 CrossRef.
- X. T. Liu, W. D. Na, H. Liu and X. G. Su, Biosens. Bioelectron., 2017, 98, 222–226 CrossRef CAS.
- A. Pollap, K. Baran, N. Kuszewska and J. Kochana, J. Electroanal. Chem., 2020, 878, 114574 CrossRef CAS.
- J. Shu and D. P. Tang, Anal. Chem., 2020, 92, 363 CrossRef CAS.
- S. Z. Lv, K. Y. Zhang, L. Zhu and D. P. Tang, Anal. Chem., 2020, 92, 1470 CrossRef CAS.
- Q. Zhou and D. P. Tang, Trends Anal. Chem., 2020, 124, 115814 CrossRef CAS.
- J. Shu and D. P. Tang, Chem.–Asian J., 2017, 12, 2780 CrossRef CAS.
- K. Gao, X. Bai, Y. Zhang and Y. T. Ji, Electrochim. Acta, 2019, 318, 422–429 CrossRef CAS.
- P. C. Yan, D. S. Jiang, H. N. Li, J. Bao, L. Xu, J. C. Qian, C. Chen and J. X. Xia, Sens. Actuators, B, 2019, 279, 466–475 CrossRef CAS.
- Z. Z. Yu, S. Z. Lv, R. R. Ren, G. N. Cai and D. P. Tang, Microchim. Acta, 2017, 184, 799–806 CrossRef CAS.
- Y. L. Zhang, Y. C. Zhao, Z. Xiong, T. Gao, B. G. Gong, P. F. Liu, J. Liu and J. Y. Zhang, Appl. Catal., B, 2020, 11, 119534 Search PubMed.
- Y. X. Lei, Y. P. Zhang, W. M. Ding, L. Q. Yu, X. P. Zhou and C. M. L. Wu, RSC Adv., 2020, 10, 26658–26663 RSC.
- S. Z. Lv, K. Y. Zhang, Y. Y. Zeng and D. P. Tang, Anal. Chem., 2018, 90, 7086–7093 CrossRef CAS.
- Y. J. Pang, Y. W. Li, G. Q. Xu, Y. T. Hu, Z. K. Kou, Q. Feng, J. Lv, Y. Zhang, J. Wang and Y. C. Wu, Appl. Catal., B, 2019, 248, 255–263 CrossRef CAS.
- X. Hou, T. L. Shi and C. H. Wei, Biomaterials, 2020, 119937 CrossRef CAS.
- Y. Liu, M. Y. Zhang and L. Li, Appl. Catal., B, 2014, 160–161, 757–766 CrossRef CAS.
- X. W. Ruan, H. Hu and G. B. Che, Appl. Surf. Sci., 2020, 499, 143668 CrossRef CAS.
- S. Adhikari and D. H. Kim, Chem. Eng. J., 2018, 354, 692–705 CrossRef CAS.
- X. Tang, X. L. Guo and Z. T. Chen, Appl. Surf. Sci., 2020, 510, 145447 CrossRef CAS.
- Y. Q. Liu, Y. Zhou and Q. J. Tang, RSC Adv., 2020, 10, 1757–1768 RSC.
- T. T. Huang, Y. H. Li, X. F. Wu, K. L. Lv, Q. Li, M. Li, D. Y. Du and H. P. Ye, Chin. J. Catal., 2018, 39, 718–727 CrossRef CAS.
- B. Y. Alfaifi, A. A. Tahir and K. G. UpulWijayanth, Sol. Energy Mater. Sol. Cells, 2019, 195, 134–141 CrossRef CAS.
- X. X. Deng, S. Tian, Z. M. Chai, Z. J. Bai, Y. X. Tan, L. Chen, J. K. Guo, S. Shen, M. Q. Cai, C. T. Au and S. F. Yin, Ind. Eng. Chem. Res., 2020, 59, 13528–13538 CrossRef CAS.
- H. Chen, C. T. Zhang, Y. Pang, Q. H. Shen, Y. Yu, Y. X. Su, J. B. Wang, F. Zhang and H. Yang, RSC Adv., 2019, 9, 22559–22566 RSC.
- J. Shu, Z. L. Qiu, Z. Z. Lin, G. N. Cai, H. H. Yang and D. P. Tang, Anal. Chem., 2016, 88, 12539–12546 CrossRef CAS.
- L. Xu, P. C. Yan, H. N. Li, S. Y. Ling, J. X. Xia, J. X. Qiu, Q. Xu, H. M. Li and S. Q. Yuan, Mater. Lett., 2017, 196, 225–229 CrossRef CAS.
- J. S. Tan, B. Peng, L. Tang, G. M. Zeng, Y. Lu, J. J. Wang, X. L. Ouyang, X. Zhu, Y. Chen and H. P. Feng, Anal. Chem., 2020, 122248 Search PubMed.
- L. Zou, L. Yang and Y. Zhan, Microchim. Acta, 2020, 187, 433 CrossRef CAS.
- H. Y. Ding, D. L. Han, Y. J. Han, Y. Q. Liang, X. M. Liu, Z. Y. Li, S. L. Zhu and S. L. Wu, J. Hazard. Mater., 2020, 393, 122423 CrossRef CAS.
- X. Wang, J. Lv, J. X. Zhang, X. L. Wang, C. Z. Xue, G. Q. Bian, D. S. Li, Y. Wang and T. Wu, Nanoscale, 2020, 12, 772–784 RSC.
- C. H. N. Wei, X. Zou, Q. M. Liu, S. X. Li, C. X. Kang and W. Xiang, Electrochim. Acta, 2020, 334, 135630 CrossRef CAS.
- M. Y. Li, Y. L. Huang and S. Q. Wang, Microchim. Acta, 2019, 186, 345 CrossRef.
- M. Y. Li, G. X. Zhang and C. Q. Feng, Sens. Actuators, B, 2020, 305, 127449 CrossRef CAS.
- J. Cao, B. Y. Xu and H. L. Lin, Chem. Eng. J., 2013, 228(15), 482–488 CrossRef CAS.
Footnote |
| † Electronic supplementary information (ESI) available. See DOI: 10.1039/d0ra08599e |
| This journal is © The Royal Society of Chemistry 2021 |

