DOI:
10.1039/D0RA08775K
(Paper)
RSC Adv., 2021,
11, 3202-3208
Hydrothermal synthesis of a novel nanolayered tin phosphate for removing Cr(III)†
Received
15th October 2020
, Accepted 23rd December 2020
First published on 22nd January 2021
Abstract
In this work, an outstanding nanolayered tin phosphate with 15.0 Å interlayer spacing, Sn (HPO4)2·3H2O (SnP–H+), has been synthesized by conventional hydrothermal method and first used in the adsorptive removal of Cr(III) from aqueous solution. A number of factors such as contact time, initial concentration of Cr(III), temperature, pH, and ionic strength on adsorption were investigated by batch tests. Moreover, the isothermal adsorption characteristics and kinetic model of Cr(III) onto SnP–H+ were studied. The results showed that the adsorption of Cr(III) by SnP–H+ was in accordance with the Langmuir adsorption isotherm model and the pseudo-second-order kinetic model. The adsorption capacity of Cr(III) onto SnP–H+ at temperature 40.0 °C and pH 3.0 could reach 81.1 mg g−1. And the distribution coefficient Kd was 23.0 g L−1. Overall, experiments certified that SnP–H+ was an excellent adsorbent that can effectively remove Cr(III) from aqueous solution.
1. Introduction
Many industrial production activities such as leather tanning, electroplating, metal refining, metallurgy, and so on will produce chromium-containing wastewater resulting in water environment pollution.1–3 Chromium is a transition metal that has several oxidation states, but chromium trivalent and chromium hexavalent are the most stable.2 Cr(III) is an essential trace element for the growth of many organisms.4 However, Cr(VI) is a highly toxic substance that can cause many diseases through the skin, respiratory and digestive tracts.2,5–7 Although trivalent chromium is beneficial to the life activities of organisms, excess chromium is toxic and harmful.5,8 The fact that chromium changes rapidly from trivalent to hexavalent have been proved by a group of researchers.9 Therefore, chromium must be removed as much as possible from industrial wastewater with the complex matrix before discharging.10–14 The methods of removing chromium from aqueous solutions include precipitation, ion exchange, reduction, electrochemical precipitation, solvent extraction, membrane separation, adsorption, etc.15 Among them, adsorption is an important method to treat wastewater containing heavy metals with high efficiency, low cost and simple operation.6 However, due to being short of appropriate adsorbents with excellent adsorption properties, such as traditional adsorbent activated carbon, this method is still limited in application.16 Organic ion exchangers such as ion exchange resins have limited chemical, thermal and radiation stability, which makes them unsuitable for the harsh wastewater environment in practice. In recent years, many researches on inorganic layered ion exchangers have been performed, including layered double hydroxides,17 layered metal oxides,18 and layered metal sulfides.19 These materials show potential applications because of their simple preparation, excellent chemical stability, rich composition and structure, and strong ion exchange ability.20–28
Considering the special structure of SnP–H+ and the less application of layered phosphate in trivalent chromium removal technology, this paper mainly studied the effect of conventional hydrothermal synthesis SnP–H+ in the removal of Cr(III) in aqueous solution. The effects of adsorption time, initial concentration of Cr(III), temperature, pH, and ionic strength on the adsorption of Cr(III) onto SnP–H+ will be researched. Thus, the effective conditions for the adsorption of Cr(III) with a low concentration on SnP–H+ were obtained.
2. Experimental
2.1 Materials
The reagents used in this study were all of the analytical grade. NaH2PO4 (99.0%) and concentrated HCl (36.0–38.0%) were supplied by Chengdu Kelong Chemical Co., Ltd., China. SnCl4·5H2O (99.99%) and Cr(NO3)3·9H2O (99.0%) were purchased from Aladdin Chemistry Co., Ltd., China.
2.2 Characterization
The SnP–H+ was investigated by X-ray diffractometer (XRD, Panalytical, EMPYREAN), high resolution transmission electron microscopy (HRTEM, Tecnal G2 F20), and thermal analysis (METTLER TOLEDO, TGA-DSC2/1600), respectively.
XRD (Cu-target) pattern was collected with Kα1 radiation of wavelength λ = 1.540598 Å and Kα2 radiation of wavelength λ = 1.544426 Å. Scan speed of 1 s per step and step size of 0.03°. HRTEM image was obtained by Tecnal G2 F20 operated at 200 kV. TGA and DSC were carried out with a heating rate of 10 °C min−1.
2.3 Preparation of SnP–H+
The synthesis method is similar to the microwave hydrothermal synthesis of SnP–H+.29 5 mL of 1 M SnCl4 in 1 M HCl and 20 mL of 3 M NaH2PO4 were mixed fully in 100 mL Teflon-lined stainless steel autoclave. The pH was adjusted to 0.4 with concentrated hydrochloric acid and then reacted at 195.0 °C hydrothermal for 48 hours. The product after cooling was washed 4 times with 1 M HCl and deionized water, respectively. The final samples were obtained after centrifugation and dried at 60 °C for 5 hours.
2.4 Adsorption experiments
Certain amounts of Cr(NO3)3·9H2O were dissolved in deionized water to prepare a series of solutions of different concentrations (10.0, 20.0, 30.0, 40.0, 50.0 mg L−1). Afterward, batch adsorption experiments were performed by contacting 10 mg of SnP–H+ with aqueous solutions of different initial concentrations of Cr(III) (40 mL) in sealed 150 mL triangular flasks, which determined the effect of contact time on adsorption capacity. Subsequent experiments confirmed the adsorption capacity of SnP–H+ in a low concentration of Cr(III) at different temperatures (25.0, 30.0, 35.0, 40.0, 45.0 °C) and pH (1.0, 1.5, 2.0, 2.5, 3.0, 3.7). All the above adsorption operations were conducted in a thermostatic oscillator with a speed of 140 rpm. The content of Cr(III) in the supernatant after centrifugation was measured by atomic absorption spectrometry (AAS). The measurements of the chromium concentration in the studied were performed using flame atomic absorption spectrophotometer (SHIMADZU, AA-6880). A hollow cathode lamp (Shimadzu (Shanghai) Global Laboratory Consumables Co., Ltd) was used for the measurement of chromium concentration with a lamp current of 10 mA. The wavelength of 357.9 nm and slit width of 0.7 nm were selected for the measurement. Moreover, the values of acetylene and air flow, the basic spectrometer parameters, were 2.8 and 15 L min−1 respectively. The limit of Cr detection was at the level of 0.13 mg L−1.
The adsorption capacity (qe, mg g−1) of Cr(III) on SnP–H+ at equilibrium and the amount adsorbed per unit mass of the SnP–H+ at time t (qt, mg g−1), as well as the distribution coefficient (Kd, L g−1) were respectively calculated by the following eqn (1)–(3):
| |
 | (1) |
| |
 | (2) |
| |
 | (3) |
where
C0 (mg L
−1) is the initial concentration of Cr(
III);
Ct (mg L
−1) and
Ce (mg L
−1) are the concentration of Cr(
III) at time
t and adsorption equilibrium;
V (L) is the volume of the solution;
m (g) is the amount of SnP–H
+ used in the experiment.
Kd (L g
−1) is the ratio of the amount of Cr(
III) adsorbed by one gram of adsorbent to the amount of Cr(
III) remaining in the solution. When the
Kd of a certain adsorbent is greater than or equal to 10.0 L g
−1, it is regarded as a superior adsorbent.
16
The removal efficiency (R) is expressed as:
| |
 | (4) |
2.5 Desorption experiments
The samples used in desorption experiments was prepared by using a solution of 20 mg L−1 of Cr(III) at pH 3.0 in contact with 10 mg of sorbent, at 25 °C for 40 min. The samples were then filtered and placed in an oven at 60 °C for 2 h. Then 8 mg dried sample was contacted with 20 mL HCl (1 or 3 M), HNO3 (1 or 3 M) and H2SO4 (1 or 3 M) solutions respectively in a closed 150 mL conical flask. The conical flask shaked at 25 °C for 24 h. After the desorption experiments, the samples were filtered and the content of Cr(III) in the liquid was analyzed. The desorption efficiency, Rdes (%) was calculated as follows:| |
 | (5) |
where Cdes (mg L−1) is the concentration of Cr(III) and mdes (g) is the amount of sample in the desorption experiments.
3. Results and discussion
3.1 Characterization
The XRD pattern is shown in Fig. 1. The main peak of the synthesized phosphate is at 15.1 Å. This is consistent with the report in the previous article,29 which proves that we synthesized a nanolayered tin phosphate with 15.0 Å interlayer spacing. The HRTEM in Fig. 2(a)–(c) displays that lattice fringes with a plane spacing of 0.375, 0.751 and 0.292 nm respectively. An identical conclusion is obtained in the XRD pattern. As we can see from Fig. 3, the weight loss of SnP–H+ reaches 11.4% at 225.6 °C, that is, about 2.2 moles of water molecules are released.30 Besides, we observe that the peak at 3.4 Å in the XRD pattern belongs to anhydrous tin phosphate. Thus, we think the synthesized sample should be a mixture of anhydrous tin phosphate and SnP–H+.
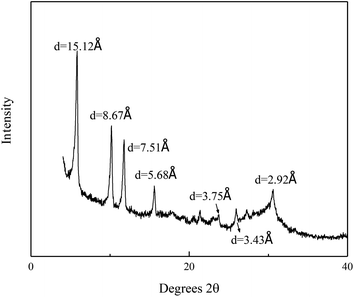 |
| | Fig. 1 XRD pattern of SnP–H+. | |
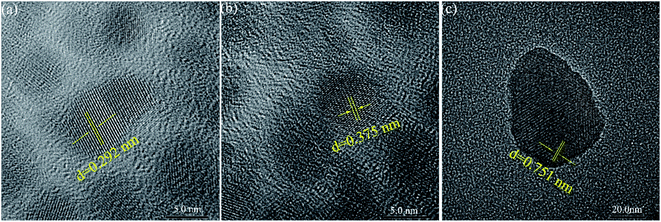 |
| | Fig. 2 TEM image (a)–(c) of SnP–H+ at high magnification. | |
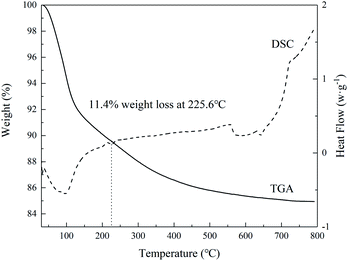 |
| | Fig. 3 DSC-TGA curves of SnP–H+. | |
3.2 Effect of contact time
Fig. 4 shows that the influence of contact time on adsorption of Cr(III) different concentrations on SnP–H+. The adsorption on SnP–H+ reached adsorption equilibrium at an initial concentration of 10.0 mg L−1 after 10 minutes. The highest removal efficiency of Cr(III) was 96.9%. As for the initial concentrations of Cr(III) from 20.0 to 50.0 mg L−1, the removal efficiency was stable after 40 minutes. Moreover, it was observed that all the curves rose rapidly in the first 10 minutes, which indicates that the adsorption rate increased rapidly at this stage. This is due to a higher interlayer spacing of SnP–H+, which makes it easier for hydrated protons with larger diameters to exchange with Cr3+.29 The adsorption capacity of the adsorbent for Cr(III) with various initial concentrations of Cr(III) (20.0–50.0 mg L−1) increased slowly after 10 minutes until the adsorption was steady. With the increase over time, the number of switching bits available in SnP–H+ decreases, resulting in a slow increase in removal efficiency.
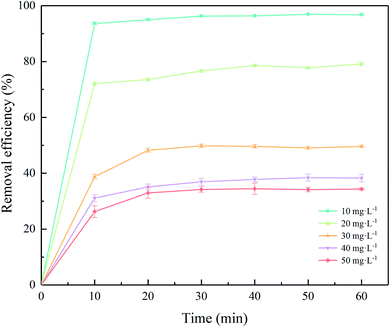 |
| | Fig. 4 Effect of contact time on the adsorption of different initial Cr(III) concentration onto SnP–H+ at 25.0 °C. | |
3.3 Effect of initial concentration of Cr(III)
The effect of initial concentration of Cr(III) (10.0–50.0 mg L−1) on adsorption is presented in Fig. 5 and S1.† The removal efficiency was 96.9% with the initial concentration of Cr(III) at 10.0 mg L−1, and then decreasing to 34.5% when the concentration was 50.0 mg L−1. In the case of the same quality of adsorbent, the adsorption capacity increases with the initial concentration of Cr(III). Higher concentrations of Cr(III) provide an important driving force for overcoming mass resistance between the water phase and the solid phase, causing an enhancement of the adsorption process.31
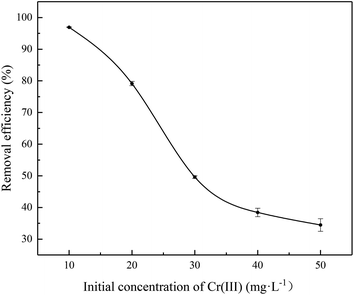 |
| | Fig. 5 Effect of initial concentration on the adsorption of Cr(III) onto SnP–H+ at 25.0 °C. | |
3.4 Effect of temperature
It is known that an increasing temperature will increase the diffusion rate of adsorbate molecules on the outer boundary layer. Changing the temperature will result in a change in the equilibrium capacity of a specific adsorbent.32 Fig. 6 shows that temperature obviously affected the adsorption of Cr(III) on SnP–H+. The removal efficiency of SnP–H+ increased slowly from 25.0 to 40.0 °C, reaching the maximum removal efficiency of 81.0% at 40.0 °C. Then it decreased as the temperature increased (40.0–45.0 °C). The increase of removal efficiency indicates that the adsorption process has endothermic properties.33 The decrease in removal efficiency with the increases of temperature, which may because of the weakening of the adsorption force between the adsorbent and Cr(III).34
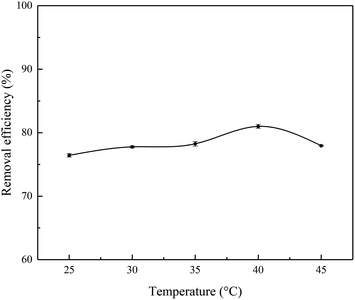 |
| | Fig. 6 Effect of temperature on the adsorption of Cr(III) onto the SnP–H+ (adsorption conditions: initial concentration = 20.0 mg L−1, contact time = 40 min, pH = 3.7). | |
3.5 Effect of pH
The pH of solution is regarded as an important factor affecting the adsorption of heavy metals because it can affect the speciation of metal ions and the surface properties of adsorbents.35 Taking into account the synthesis conditions of SnP–H+ and the pH of the solution with the initial concentration of Cr(III) at 20.0 mg L−1 is 3.7. And owing to most of acidic chromium-containing wastewater, the pH range we measured in the experiments were from 1.0 to 3.7. Fig. 7 displays that pH had a signification influence on the adsorption capacity of the SnP–H+. As we can see, the adsorption ability of the SnP–H+ increased gradually in the pH range of 1.0–3.0, but then decreased when the pH continued to rise. At a pH of 3.0, the maximum removal efficiency of the adsorbent was 85.2%. And the distribution coefficient Kd was 23.0 g L−1 much greater than 10.0 g L−1 at this moment. Under the condition of lower pH, excessive protons compete with Cr(III) for adsorption sites that may result in a reduced adsorption ratio. As pH increases, the number of protons in the solution decreases, making metal ions more likely to be adsorbed.36 When the pH is higher than 3, the amount of CrOH2+, Cr(OH)2+, Cr2(OH)24+, and Cr3(OH)45+ formed by hydrolysis of Cr3+ will increase.37 The diameter of Cr-hydroxyl ion is larger than that of Cr3+. Thus, the exchange between Cr3+ and hydrated proton may become difficult, leading to a weakened removal efficiency of SnP–H+.
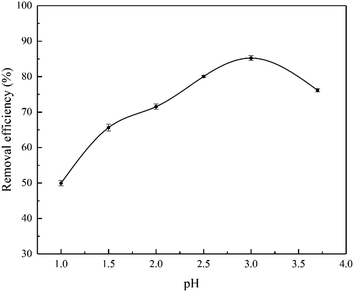 |
| | Fig. 7 Effect of pH on the adsorption of Cr(III) onto SnP–H+ (adsorption conditions: temperature = 40.0 °C, initial concentration = 20.0 mg L−1, contact time = 40 min). | |
3.6 Effect of ionic strength
Chrome-containing industrial wastewater often contains plenty of salt, and sodium chloride in tannery wastewater has been identified as one of the main pollutants.38 Fig. 8 shows the effect of sodium chloride concentration on adsorption of Cr(III) onto the SnP–H+. As the concentration of sodium chloride increased from 0 to 0.05 M, the equilibrium adsorption capacity decreased significantly. The presence of Na+ may cause steric hindrance to Cr(III) with a large radius, leading to a decrease in the adsorption capacity of Cr(III) on the SnP–H+.39 The stronger ionic strength results in the preemption of more active sites by Na+, thus reducing the equilibrium adsorption capacity of Cr(III) on the SnP–H+.
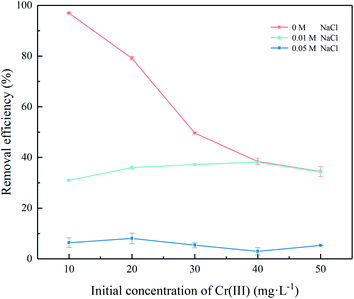 |
| | Fig. 8 Effect of pH on the adsorption of Cr(III) onto SnP–H+ (adsorption conditions: temperature = 40.0 °C, initial concentration = 20.0 mg L−1, SnP–H+ dosage was 0.25 g L−1, contact time = 40 min, pH = 3.0, and NaCl concentration ranged from 0.01 to 0.05 M). | |
3.7 Desorption experiments
The desorption of Cr(III) from SnP–H+ using different kinds and concentrations of acid solutions was studied. The results of desorption efficiency could obtained by Fig. 9. When the concentration of acid solution was 1 M, the desorption efficiency of sulfuric acid (6.3%) was the highest, followed by nitric acid (4.8%) and hydrochloric acid (2.2%). The concentration of acid solution increased from 1 to 3 M, and the desorption efficiency was improved to different degrees which nitric acid increased the most. In addition, the desorption efficiency of Cr(III) ranked as: HNO3 (15.5%) > H2SO4 (6.5%) > HCl (4.8%). The above results indicate that the desorption of Cr(III) from SnP–H+ is not complete which means better retention of Cr(III) by the SnP–H+ phase.
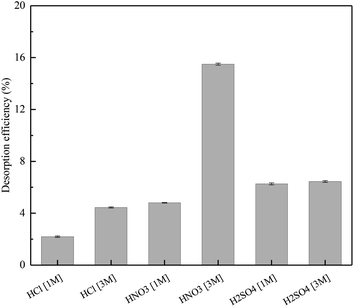 |
| | Fig. 9 Cr(III) desorption efficiency after 24 h washing of the SnP–H+ with several eluents. | |
3.8 Adsorption isotherm
The adsorption isotherm is a curve plotted by qe and different initial concentrations of adsorbate (Ce).16 Langmuir40 and Freundlich41 isotherm models are respectively expressed by the following eqn (6) and (7):| |
 | (6) |
| |
 | (7) |
where qm (mg g−1) is the maximum adsorption capacity of SnP–H+, KL (L mg−1)is the Langmuir constant, Kf (mg−(n+1)/n L1/n g−1) is the Freundlich constant, and n is a constant related to sorption intensity.
The adsorption of Cr(III) on SnP–H+ was studied by Langmuir and Freundlich isotherms and the results are shown in Fig. 10 and S2,† respectively. The isotherm parameters calculated by Langmuir and Freundlich model were listed in Table 1. Evidently, the correlation coefficient of the Langmuir model (R2 = 0.9892) was higher than that of the Freundlich model (R2 = 0.8568). Thus the Langmuir model was fitted better. This result confirms that the adsorption on SnP–H+ is monolayer adsorption.37,42
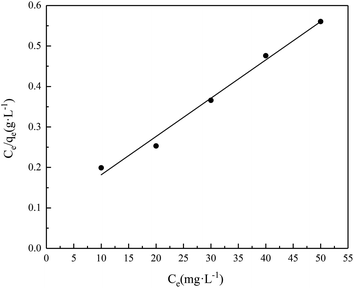 |
| | Fig. 10 Isotherm plot for Cr(III) adsorption by SnP–H+ at the fitting of Langmuir isotherm model (adsorption conditions: temperature = 25.0 °C, contact time = 40 min). | |
Table 1 Langmuir and Freundlich constants for the adsorption of Cr(III) on SnP–H+ at 25.0 °Ca
| Model |
Constants |
Cr(III) |
| Where qm,cal (mg g−1) is the theoretical maximum adsorption capacity of SnP–H+. |
| Langmuir model |
qm,cal (mg g−1) |
105.3 |
| KL (L mg−1) |
0.1088 |
| R2 |
0.9892 |
| Freundlich model |
n |
2.97 |
| Kf (mg−(n+1)/n L1/n g−1) |
25.12 |
| R2 |
0.8568 |
According to the Langmuir model, the maximum adsorption capacity of Cr(III) on SnP–H+ was 105.3 mg g−1. Compared with the maximum adsorption capacity of Cr(III) on other adsorbents in literatures, SnP–H+ has excellent adsorption efficiency (see Table 2).
Table 2 Comparison of the adsorption capacity of SnP–H+ for Cr(III) with different forms of adsorbent
| Adsorbent |
Adsorption capacity (mg g−1) |
References |
| Ferrihydrite |
53.14 |
45 |
| Cus·PPP-SH |
52.30 |
46 |
| Na-Bent |
6.44 |
47 |
| Polyacrylamide–montmorillonite |
59.74 |
48 |
| Nitrolite |
2.39 |
49 |
| Ettringite |
58.80 |
50 |
| 8-PTO |
92.00 |
51 |
| Boehmite nanoplates |
19.85 |
52 |
| SnP–H+ |
105.30 |
This study |
3.9 Adsorption kinetics
The adsorption kinetics of Cr(III) with different concentrations on SnP–H+ were described by pseudo-first order43 (eqn (8)) and pseudo-second order44 model (eqn (9)):| |
 | (8) |
| |
 | (9) |
where K1 (min−1) and K2 (g mg−1 min−1) are pseudo-first order and pseudo-second order rate constants.
Fig. S3† and 11 show the pseudo-first order and pseudo-second order curves, respectively. Kinetics parameters adsorption of Cr(III) on SnP–H+ are listed in Table 3. The above date illustrates that the correlation coefficient of pseudo-second order (R2 ≥ 0.9977) is higher than that of the pseudo-first-order model (R2 ≥ 0.7159). Hence the adsorption of Cr(III) on SnP–H+ is more consistent with the quasi-second-order model. Therefore, the adsorption is more in line with the pseudo-second-order model. In addition, the theoretical maximum adsorption capacity of SnP–H+ calculated by the pseudo-second order kinetic model basically conformed to the experimental value, indicating that the adsorption of Cr(III) on SnP–H+ is chemical adsorption.44
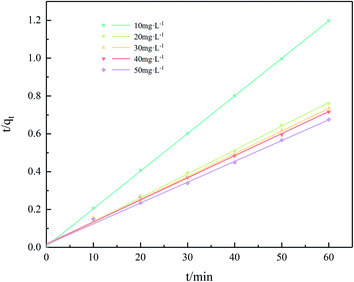 |
| | Fig. 11 The fitting plots of the pseudo-second-order kinetic model for Cr(III) adsorption on SnP–H+. | |
Table 3 Kinetics parameters adsorption of Cr(III) on SnP–H+ at 25 °C
| Experiment |
Pseudo-first-order kinetics |
Pseudo-second-order kinetics |
| C0 (mg L−1) |
qe (mg g−1) |
K1 (min−1) |
qe,cal (mg g−1) |
R2 |
K2 (g mg−1 min−1) |
qe,cal (mg g−1) |
R2 |
| 10.0 |
50.2 |
0.062 |
3.0 |
0.9619 |
0.079 |
50.3 |
0.9999 |
| 20.0 |
79.0 |
0.056 |
12.7 |
0.7159 |
0.015 |
79.4 |
0.9993 |
| 30.0 |
82.0 |
0.067 |
17.3 |
0.7432 |
0.011 |
83.3 |
0.9980 |
| 40.0 |
84.0 |
0.082 |
37.0 |
0.9998 |
0.008 |
85.5 |
0.9984 |
| 50.0 |
89.2 |
0.069 |
19.1 |
0.7815 |
0.008 |
90.9 |
0.9977 |
4. Conclusions
In this study, the adsorption capacity of low concentration Cr(III) on the SnP–H+ under different conditions was investigated. It is illustrated that the maximum adsorption capacity of Cr(III) with initial concentration at 20.0 mg L−1 was 81.1 mg g−1 at temperature 40.0 °C and pH 3.0 through batch experiments. The adsorption of Cr(III) on SnP–H+ accords with Langmuir isotherm model and pseudo-second order kinetic model. In general, SnP–H+ has the potential for practical application of Cr(III) adsorption in aqueous solution.
Conflicts of interest
There are no conflicts to declare.
Acknowledgements
We gratefully acknowledge financial support from the Natural Science Foundation of China (21776181), Sichuan University innovation spark project (2018SCUH0012), Special Project of Building World-class Universities (2030704401004) and Special Fund Project for Cooperation between Sichuan University and Panzhihua City (2018CDPZH-21).
References
- M. A. Hashem, M. Hasan, M. A. Momen, S. Payel and M. S. Nur-A-Tomal, Environ. Sustain. Indicat., 2020, 5, 100022 CrossRef.
- A. L. Arim, M. J. Quina and L. M. Gando-Ferreira, Chem. Eng. Technol., 2018, 41, 1378–1389 CrossRef CAS.
- A. Dabrowski, Z. Hubicki, P. Podkoscielny and E. Robens, Chemosphere, 2004, 56, 91–106 CrossRef CAS.
- Z. Bahadır, V. N. Bulut, D. Ozdes, C. Duran, H. Bektas and M. Soylak, J. Ind. Eng. Chem., 2014, 20, 1030–1034 CrossRef.
- P. Miretzky and A. F. Cirelli, J. Hazard. Mater., 2010, 180, 1–19 CrossRef CAS.
- W. Liu, H. Chen, A. G. L. Borthwick, Y. Han and J. Ni, Chem. Eng. J., 2013, 232, 228–236 CrossRef CAS.
- T. A. Kurniawan, G. Y. S. Chan, W.-H. Lo and S. Babel, Chem. Eng. J., 2006, 118, 83–98 CrossRef CAS.
- J. Kanagaraj, T. Senthilvelan, R. C. Panda, R. Aravindhan and A. B. Mandal, Chem. Eng. Technol., 2014, 37, 1741–1750 CrossRef CAS.
- M. S. El-Shahawi, S. S. M. Hassan, A. M. Othman and M. A. El-Sonbati, Microchem. J., 2008, 89, 13–19 CrossRef CAS.
- A. Zarezadeh, H. R. Rajabi, O. Sheydaei and H. Khajehsharifi, Mater. Sci. Eng., C, 2019, 94, 879–885 CrossRef CAS.
- S. Alipour, P. A. Azar, S. W. Husain and H. R. Rajabi, Sens. Actuators, B, 2020, 323, 128668 CrossRef CAS.
- M. B. Gholivand, M. Shamsipur, S. Dehdashtian and H. R. Rajabi, Mater. Sci. Eng., C, 2014, 36, 102–107 CrossRef CAS.
- M. Shamsipur, H. R. Rajabi, S. M. Pourmortazavi and M. Roushani, Spectrochim. Acta, Part A, 2014, 117, 24–33 CrossRef CAS.
- H. R. Rajabi, M. Shamsipur, M. M. Zahedi and M. Roushani, Chem. Eng. J., 2015, 259, 330–337 CrossRef CAS.
- K. Mukherjee, R. Saha, A. Ghosh and B. Saha, Res. Chem. Intermed., 2012, 39, 2267–2286 CrossRef.
- W. He, K. Ai, X. Ren, S. Wang and L. Lu, J. Mater. Chem. A, 2017, 5, 19593–19606 RSC.
- N. Hidayati, D. R. Apriliani, Helda, T. Taher, R. Mohadi, Elfita and A. Lesbani, J. Phys.: Conf. Ser., 2019, 1282, 012075 CrossRef CAS.
- D. T. Hobbs, M. J. Barnes, R. L. Pulmano, K. M. Marshall, T. B. Edwards, M. G. Bronikowski and S. D. Fink, Sep. Sci. Technol., 2005, 40, 3093–3111 CrossRef CAS.
- M. J. Manos and M. G. Kanatzidis, J. Am. Chem. Soc., 2012, 134, 16441–16446 CrossRef CAS.
- D. Sarma, C. D. Malliakas, K. S. Subrahmanyam, S. M. Islam and M. G. Kanatzidis, Chem. Sci., 2016, 7, 1121–1132 RSC.
- Z. Yang, F. Wang, C. Zhang, G. Zeng, X. Tan, Z. Yu, Y. Zhong, H. Wang and F. Cui, RSC Adv., 2016, 6, 79415–79436 RSC.
- C. Li, M. Wei, D. G. Evans and X. Duan, Small, 2014, 10, 4469–4486 CrossRef CAS.
- K. H. Goh, T. T. Lim and Z. Dong, Water Res., 2008, 42, 1343–1368 CrossRef CAS.
- Z. Gu, J. J. Atherton and Z. P. Xu, Chem. Commun., 2015, 51, 3024–3036 RSC.
- R. Tian, R. Liang, M. Wei, D. G. Evans and X. Duan, Struct. Bonding, 2016, 172, 65–84 CrossRef.
- B. Zümreoglu-Karan and A. Ay, Chem. Pap., 2012, 66, 1–10 Search PubMed.
- D. Yang, H. Liu, Z. Zheng, S. Sarina and H. Zhu, Nanoscale, 2013, 5, 2232–2242 RSC.
- A. Dyer, M. Pillinger, R. Harjula and S. Amin, J. Mater. Chem., 2000, 10, 1867–1874 RSC.
- W. Huang, S. Komarneni, A. R. Aref, Y. D. Noh, J. Ma, K. Chen, D. Xue and B. Jiang, Chem. Commun., 2015, 51, 15661–15664 RSC.
- A. I. Bortun, S. A. Khainakov, L. N. Bortun, E. Jaimez, J. R. García and A. Clearfield, Mater. Res. Bull., 1999, 34, 921–932 CrossRef CAS.
- K. Wang, J. Gu and N. Yin, Ind. Eng. Chem. Res., 2017, 56, 1880–1887 CrossRef CAS.
- L. Khezami and R. Capart, J. Hazard. Mater., 2005, 123, 223–231 CrossRef CAS.
- J. H. Chen, H. T. Xing, H. X. Guo, G. P. Li, W. Weng and S. R. Hu, J. Hazard. Mater., 2013, 248–249, 285–294 CrossRef CAS.
- S. Guilane and O. Hamdaoui, Desalin. Water Treat., 2015, 57, 15826–15834 CrossRef.
- J. Liu, X. Wu, Y. Hu, C. Dai, Q. Peng and D. Liang, J. Chem., 2016, 2016, 1–11 Search PubMed.
- Z.-h. Yang, B. Wang, L.-y. Chai, Y.-y. Wang, H.-y. Wang and S. Chang-qing, J. Cent. South Univ., 2008, 16, 0101–0107 CrossRef.
- W. S. W. Ngah, A. Kamari, S. Fatinathan and P. W. Ng, Adsorption, 2006, 12, 249–257 CrossRef CAS.
- X. S. Wang, Z. Z. Li and S. R. Tao, J. Environ. Manage., 2009, 90, 721–729 CrossRef CAS.
- T. Wang, W. Liu, L. Xiong, N. Xu and J. Ni, Chem. Eng. J., 2013, 215–216, 366–374 CrossRef CAS.
- I. Langmuir, J. Am. Chem. Soc., 1918, 40, 1361–1403 CrossRef CAS.
- H. M. F. Freundlich, Z. Phys. Chem. A, 1906, 57, 385–470 CAS.
- R. Vala, D. Wankasi and E. Dikio, Hem. Ind., 2016, 70, 565–572 CrossRef.
- Y. S. Ho and G. McKay, Process Biochem., 1999, 34, 451–465 CrossRef CAS.
- X. He, X. Min and X. Luo, J. Chem. Eng. Data, 2017, 62, 1519–1529 CrossRef CAS.
- A. Dzieniszewska, J. Kyziol-Komosinska and M. Pająk, PeerJ, 2020, 8, 22 CrossRef.
- T. Ai, X. Jiang and Q. Liu, Open Chem., 2018, 16, 842–852 CAS.
- J. D. Castro-Castro, N. R. Sanabria-González and G. I. Giraldo-Gómez, Data Brief, 2020, 28, 105022 CrossRef.
- J. Qiu, X. Du, S. Komarneni, H. Wang, X. Cheng and Z. Du, J. Appl. Polym. Sci., 2020, 137, e49065 CrossRef.
- G. Wójcik, Materials, 2020, 13, 2256 CrossRef.
- X. Wang, S. Cui, B. Yan, L. Wang, Y. Chen and J. Zhang, J. Wuhan Univ. Technol., Mater. Sci. Ed., 2019, 34, 587–595 CrossRef CAS.
- W. Peng, S. Du, Z. Shaoning, H. Xieyi, B. Qingyuan, Q. Meng, Z. Wei and H. Fuqiang, J. Hazard. Mater., 2020, 384, 121278 CrossRef CAS.
- W. Cui, X. Zhang, C. I. Pearce, Y. Chen, S. Zhang, W. Liu, M. H. Engelhard, L. Kovarik, M. Zong, H. Zhang, E. D. Walter, Z. Zhu, S. M. Heald, M. P. Prange, J. J. De Yoreo, S. Zheng, Y. Zhang, S. B. Clark, P. Li, Z. Wang and K. M. Rosso, Environ. Sci. Technol., 2019, 53, 11043–11055 CrossRef CAS.
Footnote |
| † Electronic supplementary information (ESI) available. See DOI: 10.1039/d0ra08775k |
|
| This journal is © The Royal Society of Chemistry 2021 |
Click here to see how this site uses Cookies. View our privacy policy here.  Open Access Article
 *
*


