 Open Access Article
Removal of lithium and uranium from seawater using fly ash and slag generated in the CFBC technology†
Tomasz Kalak *a and
Yu Tachibana
 b
b
aPoznań University of Economics and Business, Institute of Quality Science, Department of Industrial Products and Packaging Quality, Niepodległości 10, 61-875 Poznań, Poland. E-mail: tomasz.kalak@ue.poznan.pl
bDepartment of Nuclear System Safety Engineering, Graduate School of Engineering, Nagaoka University of Technology, 1603-1, Kamitomioka, Nagaoka, Niigata 940-2188, Japan
First published on 21st June 2021
Abstract
Fly ash and slag were produced as a result of the incineration of municipal sewage sludge using the circulating fluidized bed combustion (CFBC) technology and were examined for the simultaneous recovery of lithium and uranium from seawater in batch adsorption experiments. These waste materials have been characterized in terms of their physicochemical properties using several research methods including particle size distribution, bulk density, SEM-EDS analysis, thermogravimetry, SEM and TEM morphology, BET, specific surface area, pore volume distribution by the BJH method, ATR FT-IR, and zeta potential. The fly ash and slag waste materials showed the following research results for Li-ion recovery: adsorption efficiency 12.1% and 6.8%, adsorption capacity 0.55 mg g−1 and 0.15 mg g−1, respectively. Better results were reported for U ion recovery: adsorption efficiency 98.4% and 99.9%, adsorption capacity 21.3 mg g−1 and 56.7 mg g−1 for fly ash and slag, respectively. In conclusion, the conducted research revealed that CFBC fly ash and slag are promising low-cost adsorbents for the effective recovery of Li and U ions from seawater.
1. Introduction
Nowadays, lithium is recognized as one of the most essential minerals in human activity. Lithium compounds are used widely in many industries, such as ceramics,1 glass,2,3 pharmaceutical,4 nuclear power,5 batteries and accumulators,6 catalysts,7 lubricating greases,3 glazes for ceramic and enamel coatings;3 Li-6 is used as a raw material for tritium (T) production in nuclear fusion reactors in the 6Li(n,α)T reaction,8 LiOH is used as a pH controller in pressurized water reactors.8 In recent years, due to environmental protection and the reduction of CO2 emissions to the atmosphere, the industrial development of electric vehicles and portable electronic devices has resulted in a huge demand for lithium compounds for the production of batteries. In this situation, with the increase in lithium consumption, the problem may be the limited amounts of this element obtained for production. According to the literature, the global consumption of Li for lithium-ion batteries was 31% in 2010 and 43% in 2017. It is estimated that consumption may reach 65% in 2025.9 Due to the growing trend in the production of vehicles and electrical equipment, global lithium consumption will increase and may amount to approx. 5.11 million tons by 2050.10 Currently, lithium is produced industrially from ores and brines on land, where the total Li reserves are estimated to be around 14 million tons.11 Therefore, the search for other unconventional sources of Li is essential to meet future market needs. Oceans may be a promising source of the element, in which the amount was estimated at 230 billion tons.12 It has been reported that the average Li concentration in seawater is estimated at 26 μM.13 Despite the large amounts of Li dissolved in seawater, it is not considered as a Li reserve for industrial use as there is no cheap technology to selectively remove Li from seawater containing huge amounts of contaminants such as Mg, K, Na, etc.14 Hence, it is justified to search for a cheap and innovative technology for recovering Li from seawater so the growing demand for this element could be satisfied. A promising method for Li recovery may be the adsorption process with the use of appropriate selective adsorbents. The problem is finding an adsorbent that is capable of ion exchange or complexation reaction and is chemically and physically stable enough not to dissolve in seawater after a long immersion time.Uranium compounds are released into the environment through the slow release from natural deposits, combustion of coal and other fossil fuels, discharge from post-flotation wastes, and the use of uranium-containing phosphate fertilizers and emissions from nuclear reactors.15 Uranium is a toxic and radioactive element. In living organisms, it accumulates in the kidneys and bones, and its pathogenic effect is manifested in the liver and kidneys, even resulting in cancer. Uranium enters the human body through food, drinks, or by inhaling dust particles containing this metal.17
Global uranium mining production amounted to approximately 53![[thin space (1/6-em)]](https://www.rsc.org/images/entities/char_2009.gif) 656 tons in 2019, which accounted for approximately 79% of the global demand. Uranium exists mainly in the form of uraninite and its main exporters include Kazakhstan (43%, 22
656 tons in 2019, which accounted for approximately 79% of the global demand. Uranium exists mainly in the form of uraninite and its main exporters include Kazakhstan (43%, 22![[thin space (1/6-em)]](https://www.rsc.org/images/entities/char_2009.gif) 808 tons), Canada (13%, 6938 tons), Australia (12%, 6613 tons), Namibia (11%, 5476 tons), Niger (6%, 2983 tons), Russia (5%, 2911 tons), Uzbekistan (4.5%, 2404 tons), China (3.5%, 1885 tons), and others.18 At the current global rate of uranium consumption, it is predicted that the U reserves for nuclear power may only last for about 80–120 years. Hence, nuclear energy will partially satisfy the increased demand for world energy. In addition to land-based uranium mining, an alternative may be to recover it from seawater, in which the average concentration is around 14 nM. Seawater contains around 4.5 billion tons of U in its reserves, which may be sufficient to power the world's nuclear reactors for around 13
808 tons), Canada (13%, 6938 tons), Australia (12%, 6613 tons), Namibia (11%, 5476 tons), Niger (6%, 2983 tons), Russia (5%, 2911 tons), Uzbekistan (4.5%, 2404 tons), China (3.5%, 1885 tons), and others.18 At the current global rate of uranium consumption, it is predicted that the U reserves for nuclear power may only last for about 80–120 years. Hence, nuclear energy will partially satisfy the increased demand for world energy. In addition to land-based uranium mining, an alternative may be to recover it from seawater, in which the average concentration is around 14 nM. Seawater contains around 4.5 billion tons of U in its reserves, which may be sufficient to power the world's nuclear reactors for around 13![[thin space (1/6-em)]](https://www.rsc.org/images/entities/char_2009.gif) 000 years.19 Uranium can exist in seawater in the following chemical neutral and anionic forms: Mg2[UO2(CO3)3], Ca2[UO2(CO3)3], Ca[UO2(CO3)3]2−, UO2(CO3)34−, (UO2)11(CO3)6(OH)122− and (UO2)2CO3(OH)3−.16,19–21 As with lithium, it is also possible to recover U from seawater using an adsorption process. A number of adsorbents capable of binding U ions exist, including the following: inorganic substances,22 polymers,23 atom transfer radical polymerization prepared adsorbents (ATRPAs),24 mesostructured organosilica-phosphonate hybrids,25 highly porous and stable metal–organic frameworks (MOFs),26 benzimidazole-functionalized 2-D COF,27 nanostructured carbons (NCs),28 genetically-engineered proteins and their associated materials (HAGEPs),29 metal silicate nanotubes30 and many others. All these adsorbents are expensive and therefore increase the cost of the entire process. Therefore, for the industrial recovery of uranium from seawater profitable, cheap adsorbents should be found and proposed that will withstand a long time of U ions recovery from seawater.
000 years.19 Uranium can exist in seawater in the following chemical neutral and anionic forms: Mg2[UO2(CO3)3], Ca2[UO2(CO3)3], Ca[UO2(CO3)3]2−, UO2(CO3)34−, (UO2)11(CO3)6(OH)122− and (UO2)2CO3(OH)3−.16,19–21 As with lithium, it is also possible to recover U from seawater using an adsorption process. A number of adsorbents capable of binding U ions exist, including the following: inorganic substances,22 polymers,23 atom transfer radical polymerization prepared adsorbents (ATRPAs),24 mesostructured organosilica-phosphonate hybrids,25 highly porous and stable metal–organic frameworks (MOFs),26 benzimidazole-functionalized 2-D COF,27 nanostructured carbons (NCs),28 genetically-engineered proteins and their associated materials (HAGEPs),29 metal silicate nanotubes30 and many others. All these adsorbents are expensive and therefore increase the cost of the entire process. Therefore, for the industrial recovery of uranium from seawater profitable, cheap adsorbents should be found and proposed that will withstand a long time of U ions recovery from seawater.
In recent years, there has been an increased interest in searching for low-cost adsorbents among the industrial, agricultural and municipal waste. Due to the constantly growing amount of waste, the aim is to reuse it (circular economy) or reduce mass in incineration processes. Nowadays, in the European Union, the circulating fluidized bed combustion (CFBC) technology is recommended for the reduction of municipal sewage sludge. The products of combustion in this technology are fly ash (FA) and slag (S), which can be reused in industry. There are many publications in the literature on the good adsorption properties of these materials. They are characterized by irregular shape with a porous surface, high content of dehydrated silicate minerals and other minerals, large specific surface area and a large number of active centers. It should be mentioned that they are industrial waste, which means that the costs are very low. Hence, in the future, fly ash and slag obtained using the CFBC technology may be of great importance for the processes of metal ion separation from wastewater, but also for the recovery of lithium and uranium ions from seawater.31
The purpose of the present work is to study the adsorption behaviour of Li(I) and U(VI) ions on fly ash and slag generated with the CFBC technology as a result of municipal sewage sludge incineration. The adsorption experiments were conducted using seawater samples at room temperature. The aim was also to determine the physical and chemical properties of the adsorbents using various analytical methods and to study the process kinetics, equilibrium and isotherms.
2. Experimental procedure
2.1. Materials and methods
Before adsorption experiments, fine particles in the seawater taken from the Sea of Japan were removed using an MF-Millipore glass fiber filter (pore size 2.0 μm, diameter 47 mm, thickness 1.2 mm). After filtering, the lithium and uranium ion contents were determined by the absolute calibration method to be 114.6 ± 0 ppb and 611.4 ± 25.4 ppb, respectively. The initial and equilibrium pH of the seawater were determined using a pH meter (pHSpear model). Ultrapure water (a Merck Millipore apparatus, Milli-Q Integral 3 Water Purification System) was used to prepare sample solutions. The total carbon content and specific electrical resistance of the ultrapure water were equal to ≤3 ppb and ≥18.2 MΩ cm, respectively.
 | (1) |
Determination of bulk density was carried out using a measuring cylinder and calculated according to eqn (2):
 | (2) |
Selected properties of sample particles were determined using the following analytical methods: (1) particle size distribution was determined by the laser diffraction method using a Zetasizer Nano ZS (Malvern Instruments Ltd., UK); (2) determination of bulk density was carried out by loosely filling the samples into a cylinder and thickening on a vibrating table; (3) the elemental composition and mapping were determined using a scanning electron microscope (SEM) Hitachi S-3700N with an attached a Noran SIX energy dispersive X-ray spectrometer (EDS) microanalyser; (4) thermogravimetry was by Setsup DTG, DTA 1200; (5) the specific surface area and the average pore diameter by the BET method using Autosorb iQ Station 2 (Quantachrome Instruments, USA); (6) the pore volume by the BJH method using Autosorb iQ Station 2 (Quantachrome Instruments, USA); (7) the morphology by a scanning electron microscope (SEM) EVO-40 (Carl Zeiss, Germany); (8) the surface structure analysis by the ATR FT-IR method using Spectrum 100 (PerkinElmer, Waltham, USA); (9) zeta potential (Malvern Instruments Ltd, UK).
The adsorption efficiency A [%] and the adsorption capacity qe [mg g−1] were calculated based on eqn (3) and (4), respectively:
 | (3) |
 | (4) |
Distribution coefficients (Kd) were calculated according to the following eqn (5):
| Kd = (CA/CS) × (VS/VA) = {(C0 − CS)/CS} × (VS/VA) | (5) |
3. Results and discussion
3.1. Characterization of the adsorbents
The analysis of the grain composition was carried out and the results are as follows: (a) CFBC-FA: particle size range 0–0.212 mm – 87.7%, 0.212–0.500 mm – 11.2%, 0.500–1.0 mm – 1.1%; (b) CFBC-S: 0–0.212 mm – 13.1%, 0.212–0.5 mm – 73.5%, 0.500–1.0 mm – 11.5%, 1.0–1.7 mm – 0.5%, >1.7 mm – 1.4%. The results show that the particles are not homogeneous. According to the literature, particle size influences the physicochemical properties and adsorption efficiency of metal ions. Smaller particles of adsorbents lead to higher process efficiency.34,35 Based on the analysis of the particle size distribution, plots revealed only one peak related to particle sizes of 1205 and 955.4 nm for CFBC-FA and CFBC-S, respectively (Fig. SM1 and SM2, ESI†). The difference is that CFBC-FA particles are more volatile and less dense as compared to CFBC-S, therefore CFBC-FA particles of even larger diameter were able to be suspended in an aqueous solution during the measurement.Determination of bulk density was conducted and the results were 0.74 ± 0.02 g cm−3 (by loosely filling the samples into a cylinder) and 1.46 ± 0.03 g cm−3 (by thickening) for CFBC-FA, respectively. The results for CFBC-S were as follows: 0.84 and 1.37 g cm−3, respectively. The compaction process caused an increase in the bulk density of the samples in these tests.
Elemental analysis using the SEM-EDS method was carried out and the results are shown in Fig. SM3 and SM4 (ESI†) and Table 1. The peaks present in the spectrum of CFBC-FA refer to the elements O, Ca, P, Si, Al, Fe, Mg, S, C, Ti, Zn, K and oxides CaO, P2O5, SiO2, Al2O3, Fe2O3, MgO, SO3, CO2, TiO2, ZnO, K2O. The analysis of slag revealed the presence of O, Ca, P, Si, Al, Mg, Fe, C, Na, S, Ti, K and CaO, P2O5, SiO2, Al2O3, MgO, Fe2O3, CO2, Na2O, SO3, TiO2, K2O. It should be mentioned that the content of oxides was not determined as a result of the measurement but calculated from stoichiometry in the EDS microanalysis based on data estimation. The tested materials are diverse agglomerates and their quantitative and qualitative compositions differ slightly at each measuring point on the sample using the SEM-EDS method. Comparing the results of the analysis, it can be concluded that the quantitative compositions of both materials are similar. Composition differences may be due to many factors, such as the type of dried sewage sludge, parameters of the combustion process, etc. According to the literature, better adsorption efficiency of metals (e.g. mercury) results from the presence of more carbon black and iron oxide in the composition of FA.36,37
| Elements | C | O | Na | Mg | Al | Si | P | S | K | Ca | Ti | Fe | Zn |
|---|---|---|---|---|---|---|---|---|---|---|---|---|---|
| CFBC-FA, weight [%] | 1.46 | 42.81 | — | 2.53 | 4.01 | 6.83 | 8.01 | 1.49 | 0.13 | 28.31 | 0.78 | 3.18 | 0.46 |
| CFBC-FA, atomic [%] | 2.76 | 60.97 | — | 2.38 | 3.39 | 5.55 | 5.89 | 1.06 | 0.07 | 16.1 | 0.37 | 1.3 | 0.16 |
| CFBC-S, weight [%] | 1.33 | 43.84 | 0.74 | 2.51 | 3.54 | 3.74 | 14.18 | 0.46 | 0.19 | 27.15 | 0.44 | 1.89 | — |
| CFBC-S, atomic [%] | 2.5 | 61.6 | 0.72 | 2.33 | 2.95 | 2.99 | 10.29 | 0.32 | 0.11 | 15.23 | 0.21 | 0.76 | — |
| Oxides | CO2 | Na2O | MgO | Al2O3 | SiO2 | P2O5 | SO3 | K2O | CaO | TiO2 | Fe2O3 | ZnO | |
| CFBC-FA, oxides [%] | 5.34 | — | 4.2 | 7.58 | 14.62 | 18.35 | 3.73 | 0.15 | 39.61 | 1.29 | 4.55 | 0.57 | |
| CFBC-S, oxides [%] | 4.89 | 1.0 | 4.17 | 6.68 | 7.99 | 32.48 | 1.14 | 0.23 | 37.98 | 0.73 | 2.71 | — | |
The mineralogical composition was determined by X-ray diffraction analysis and the results are shown in Fig. SM5 and SM6 (ESI†). In accordance with the analysis, the following crystalline phases were found in CFBC-FA: quartz, calcite, maghemite-Q, whitlockite, calcium sulfate, zinc magnesium phosphate, portlandite, stanfieldite. Nowak et al. reported the presence of similar substances, such as tricalcium aluminate, sodium chloride, potassium chloride, calcium carbonate, calcium sulfate and quartz.35 Many other research papers presented similar FA compositions, including, inter alia, quartz, aluminum oxide and hematite.38–40 As a result of slag analysis, the main crystalline phases were reported: calcium sulfate, calcite, quartz, portlandite, lime, magnesium oxide. Similar results for the slag composition analysis were found in the literature.41,42
The thermogravimetric analyses of both materials showed weight loss (TGA) with an increase in temperature from 29 °C to 600 °C (Fig. SM7 and SM8, ESI†). Constant linear weight loss was observed when measuring CFBC-FA. This phenomenon is due to the evaporation of adsorbed water as well as the removal of other volatile substances (e.g. CO and other organic compounds). The analysis of slag revealed sudden weight loss in the temperature range of 400–450 °C. The combustion of organic substances present in slag is likely to be the cause of this sharp decline.43 Another slight decrease of about 0.5% occurred with the temperature increase to about 550–600 °C. In this range of the combustion process, gases may be released from the inside of the grains as a result of the degradation of their surface walls. The DTG analysis showed a derivative weight loss [% min−1]. As a result, one peak is present at 340 °C (weak peak) and 420 °C (intensive peak) in the case of CFBC-FA and CFBC-S, respectively; this may be due to the dehydroxylation of Ca(OH)2. The subsequent decrease in the DTG spectrum curve at about 600 °C may be the consequence of the evaporation of gaseous compounds. Negative values indicate that endothermic reactions took place.44
Elemental analysis confirmed the presence of carbon dioxide, which may be the result of carbon oxidation and CaCO3 decomposition. Based on the literature, the oxidation of carbon to CO2 takes place at a temperature lower than 700 °C.44,45
According to the BET analysis, the specific surface areas (SBET) of CFBC-FA and CFBC-S were 3.75 and 1.87 m2 g−1, the volumes of the pores (Vp) were 0.014 and 0.0096 cm3 g−1, and the average pore diameters (Apd) were 17.6 and 21.2 nm, respectively (Fig. SM9–SM16, ESI†). Based on the analysis, it is supposed that the pores are formed between the particles and some of them are presumed to be meso-sized. Particles during adsorption can be clustered around the most favorable places on the surface of a macroporous or non-porous adsorbent.46 The shapes of the isotherms correspond to type III isotherms that are convex towards the pressure axis. This shape provides information about the so-called co-operating adsorption, which is related to the fact that previously adsorbed molecules can influence the increased adsorption of the remaining particles. The adsorbate interacts more with another adsorbate than with the adsorbent. Under conditions of low relative pressure, the poor adsorbate–adsorbent interaction may be the cause of low adsorption efficiency. The molecules adsorbed in the active centers of the adsorbent surface cause the attraction of other ions present in the solution for subsequent adsorption. This type of action is shown in the form of a convex isotherm towards the pressure axis.
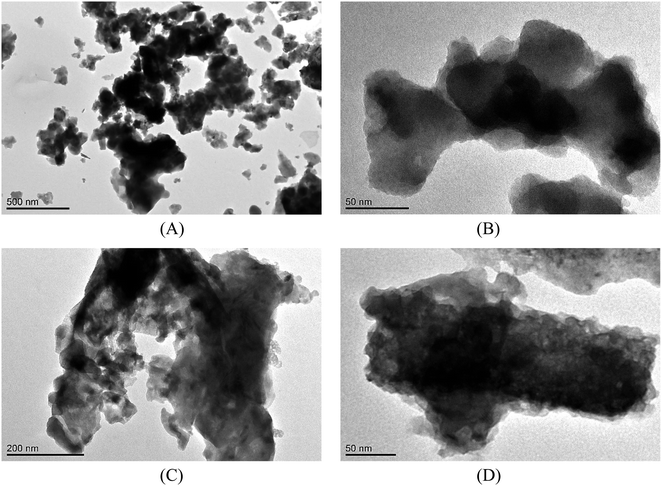
SEM analyses of the tested materials were performed and the images are presented in Fig. 1. The crystalline phases were observed and the particles were of irregular shape and formed dense agglomerates of various sizes. In judging the external appearance, the particles were compact and spongy with both sharp and gentle edges. The porous surface and heterogeneous structure were characteristically seen in the pictures; larger irregularities occurred with larger particles. According to the literature, the combustion temperature and time influenced the later shape of fly ash and slag, which can take an irregular, elongated or acicular form. The particles became more spherical or crystalline in the case of a longer burning time.47,48 TEM analysis (Fig. 2) showed that fly ash and slag particles are composed of irregularly shaped flocs of various sizes (agglomerates in an amorphous matrix). The particles are opaque, the darker zones are for the thicker layers of the material, while the lighter zones are lighter in the image due to the thinner layers. Similar results for TEM analysis were reported in the literature.49–51
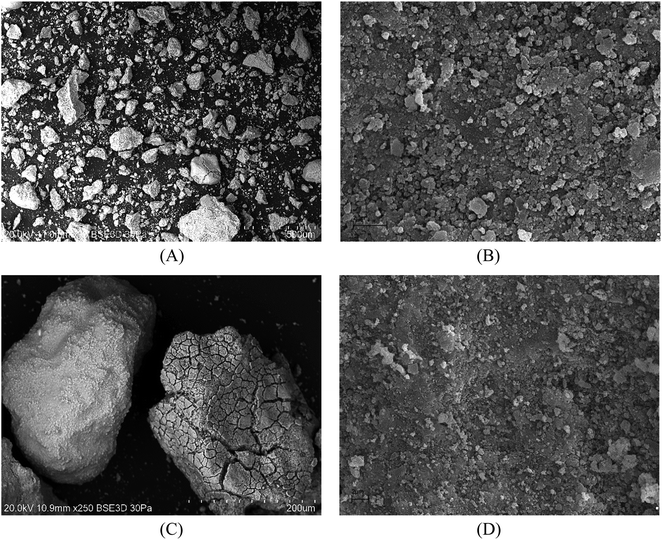 | ||
Fig. 1 SEM images of CFBC-FA: (A) magn.: ×70, scale bar: 500 μm; (B) ×10![[thin space (1/6-em)]](https://www.rsc.org/images/entities/char_2009.gif) 000, 2 μm; and CFBC-S: (C) ×250, 200 μm, (D) ×10 000, 2 μm; and CFBC-S: (C) ×250, 200 μm, (D) ×10![[thin space (1/6-em)]](https://www.rsc.org/images/entities/char_2009.gif) 000, 2 μm. 000, 2 μm. | ||
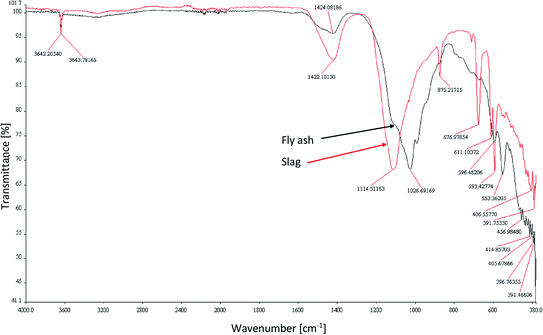
The FT-IR analysis of the tested adsorbents was conducted and the spectra are shown in Fig. 3. The chemical functional bonds were characterized by comparing the peak frequencies with the typical mid-infrared absorption frequencies of the functional groups, and the results are presented in Table 2. Similar results for the FT-IR analysis of fly ash and slag have been presented in the literature.42,52–55
| FT-IR bands of CFBC-FA [cm−1] | FT-IR bands of CFBC-S [cm−1] | Type of vibration and band assignment |
|---|---|---|
| 3644 | 3642 | Asymmetric and symmetric stretching vibrations O–H (presumably hydrated aluminum silicates or amorphous silicates) |
| 1424 | 1422 | Valence vibration of carbonate ions, C![[double bond, length as m-dash]](https://www.rsc.org/images/entities/char_e001.gif) C stretching bond in the aromatic ring56 C stretching bond in the aromatic ring56 |
| 1027 | 1114 | Asymmetric stretching vibrations of silica Si–O–Si and Al–O–Si |
| — | 875 | Symmetric stretching of Al–O–M,53 vibrations of carbonates (calcite) |
| — | 677, 611 | Stretching vibrations Al–O (ref. 53) |
| 596 | 593 | Vibrations Si–O–M |
| 553 | — | O–P–O, O![[double bond, length as m-dash]](https://www.rsc.org/images/entities/char_e001.gif) P–O bending vibration (presumably phosphorus pentoxide) P–O bending vibration (presumably phosphorus pentoxide) |
| 457, 415, 406, 397, 391 | 407 | Bond bending vibrations Si–O–Si (ref. 54) |
The zeta potentials were determined in our previous studies. This parameter is important in many industrial applications, such as wastewater treatment and others related to environmental protection. The shapes of CFBC-FA and CFBC-S curves were quite similar, however, the values for ash were slightly high. Neither of them reached the isoelectric point (IEP). This means that there is an advantage of negative ions over positive ions in the solution. In the range of pH 2.1–2.6 (5.6–18 mV) the low stability of the dispersion system was observed. Then, as the pH increased, the surface electrostatic charge decreased from 18 mV (pH 2.2) to 1.2 mV (pH 4.2), and then increased to 9.2 (pH 7).31,33
3.2. Adsorption behaviour of Li(I) and U(VI) ions
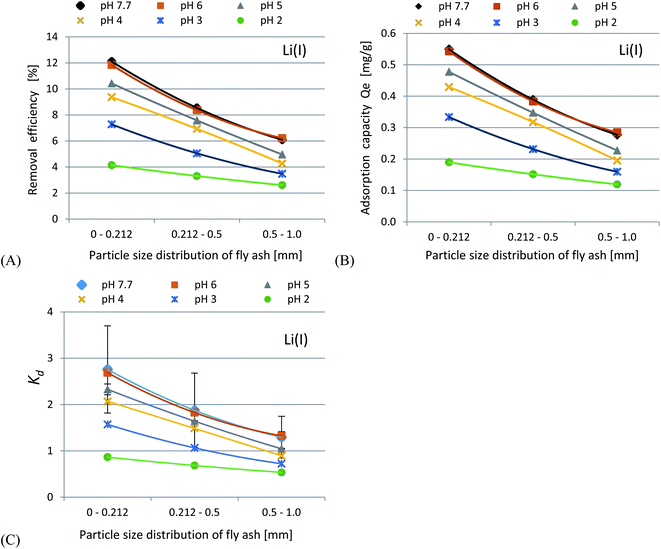
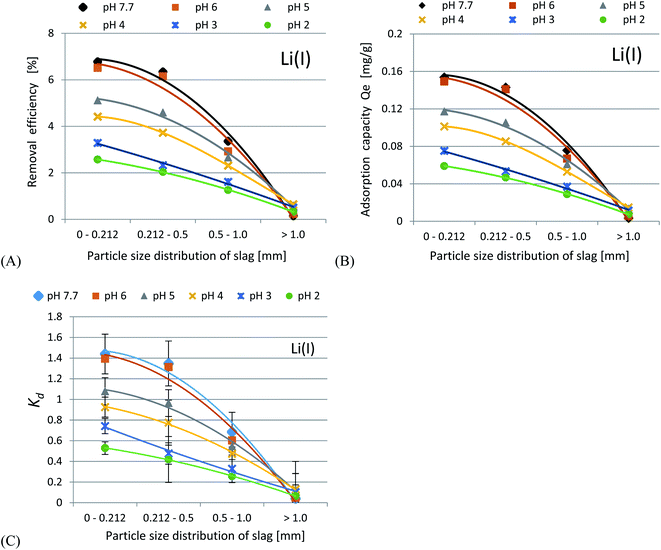
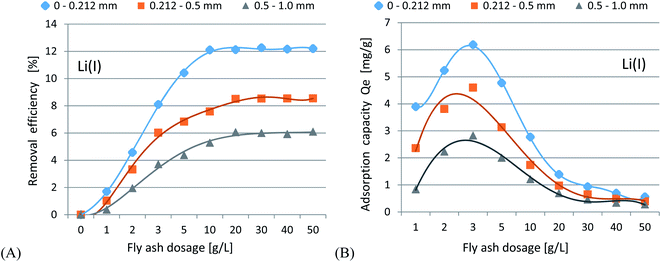
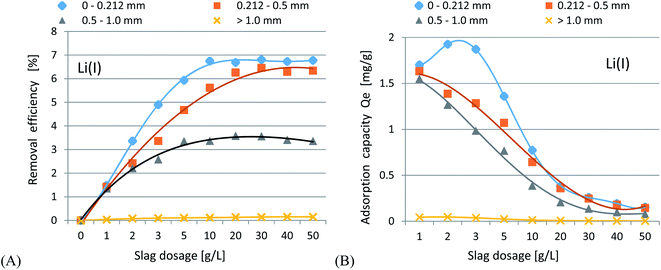
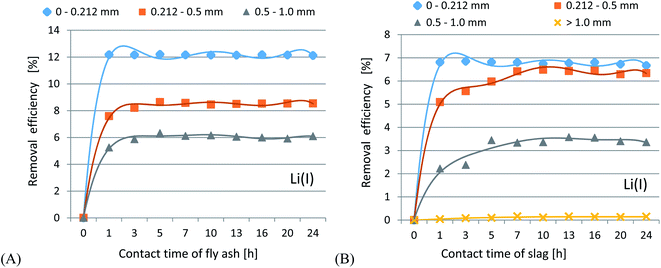
In accordance with the results presented in Fig. 4(A–C) and 5(A–C), it was shown that as the size of the adsorbent particles decreased, the value of the Kd coefficient, adsorption efficiency and adsorption capacity increased. Lowering the initial pH reduced the adsorption efficiency. The best results were obtained in the pH range of 6.0–7.7. For lithium-ion removal, the best results for CFBC-FA and CFBC-S (pH 7.7, 0–0.212 mm) were as follows: adsorption efficiency 12.1%, adsorption capacity 0.55 mg g−1, Kd coefficient 2.76, and 6.8%, 0.15 mg g−1, 1.44 (Kd), respectively. These low yield results suggest that Li adsorption reactions were disrupted by other elements present in seawater (e.g. K, Na, Mg), which can competitively oppose the binding of Li ions. In the aqueous solution, Li ions occur most frequently in the form of aqua ions [Li(H2O)n]+ (n = 3–4) in a wide pH range,57 which means that they have higher hydrophilicity. Hence, hydrated Li-ions may have an affinity for the active centers of the studied adsorbents.
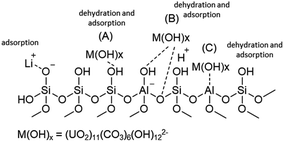 | ||
| Fig. 6 The chemical structure of the aluminosilicate model present on the fly ash and slag surfaces.63 | ||
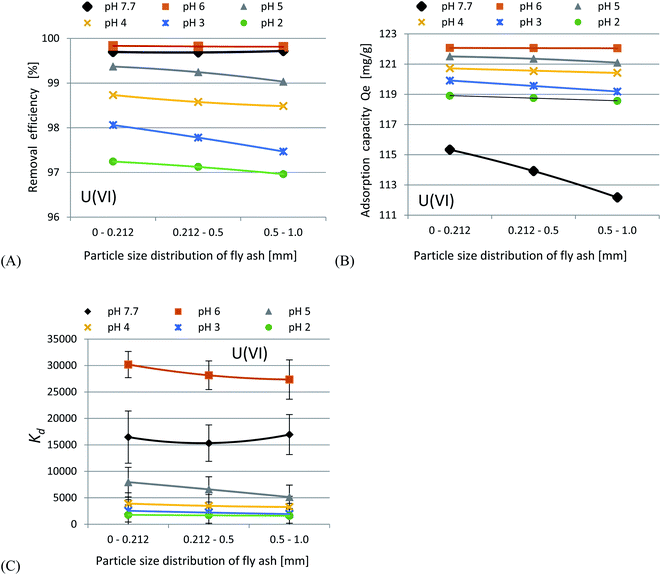
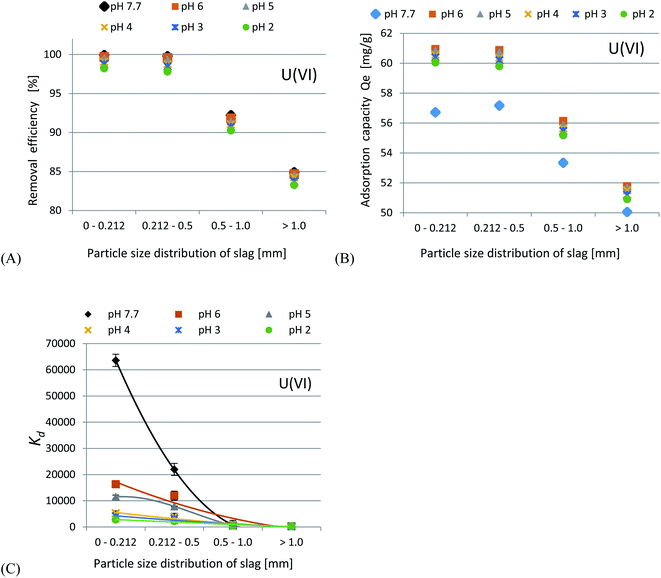
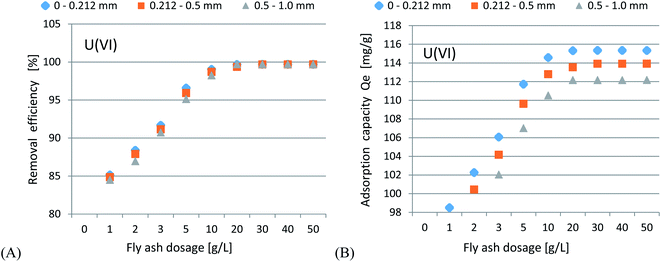
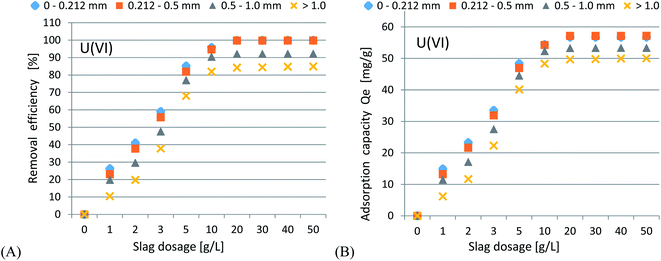
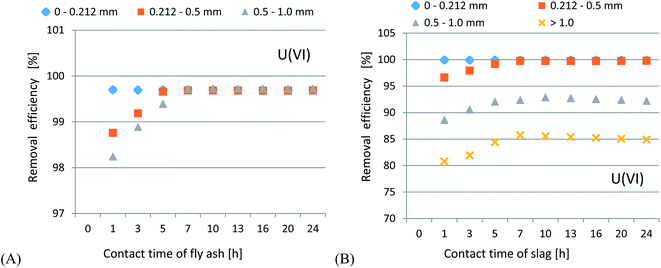
Uranium ion adsorption from seawater was investigated and the results are presented in Fig. 7(A–C) and 8(A–C). The U ion adsorption reactions were much more effective as compared to the Li-ions. When the initial pH was lowered, this resulted in a reduction in the adsorption efficiency. The best results were obtained in the range of pH 6–7.7. For U ion removal, the most favorable research results for CFBC-FA and CFBC-S (0–0.212 mm) were as follows: adsorption efficiency 98.4%, adsorption capacity 21.3 mg g−1, Kd coefficient 16![[thin space (1/6-em)]](https://www.rsc.org/images/entities/char_2009.gif) 474.7, and 99.9%, 56.7 mg g−1, 63
474.7, and 99.9%, 56.7 mg g−1, 63![[thin space (1/6-em)]](https://www.rsc.org/images/entities/char_2009.gif) 611.9 (Kd), respectively. CFBC-FA adsorbs metal ions at a constant level, while in the case of slag, the adsorption decreases with increasing grain thickness. The phenomenon of high efficiency of the removal process may be caused by complexation reactions between the U ion and the hydroxyl groups present on the surface of the adsorbent particles. Based on the literature, the ionic strength (IS) of seawater was estimated to be 0.7.58 The existence of many chemical forms of U ions in seawater has been proposed using the stability constants between U and OH−, Cl−, CO32− and CO2(g) (IS = 0.5 at 25 °C) in order to demonstrate the possibility of establishing the adsorption mechanism. Based on our proposed distribution diagram of U(VI) species as a function of pH at 25 °C (Fig. 8), it was found that (UO2)11(CO3)6(OH)122− is probably the major form of U ion in the Sea of Japan in the pH range 7.7–9.0.19 During the experiments in seawater, an anion exchange reaction between the U ions and the dissociated anions of the adsorbents probably took place. According to the diagram presented in Fig. 9, under these experimental conditions (pH 7.7–12.0) no cationic forms such as UO22+ or (UO2)2(OH)22+ were present. At higher pH, the CFBC-FA and CFBC-S surfaces were negative, and therefore the uptake of Li and U ions can be explained by electrostatic interactions.19 Additionally, the uptake can be attributed to the calcium content, as well as the content of SiO2, Al2O3, Fe2O3 oxides, which ensure alkalinity in the systems, raising the pH to alkaline values, thus facilitating the uptake of ions with CFBC-FA and CFBC-S.60 In accordance with Yasim et al., the functional groups of adsorbents could be hydrolyzed to other compounds, affecting the availability of binding sites.61 Cheira et al. reported the probable adsorption mechanism between U ions and the Ambersep 920U SO4 resin.59 In accordance with their findings, the proposed adsorption mechanism is the complexation reaction between U ions and the quaternary amine groups. The anionic form of uranium is attached to a positively charged quaternary nitrogen atom to form a complex. In this study, it was estimated that the probable mechanism would be the electrostatic interaction between (UO2)11(CO3)6(OH)122− and a single chemical bond between a metal and an oxygen atom with a higher positive charge as a result of electronegativity of hydroxyl groups in the adsorbent particles. However, it is not known whether the reaction mechanism works the same way with CFBC-FA and CFBC-S.
611.9 (Kd), respectively. CFBC-FA adsorbs metal ions at a constant level, while in the case of slag, the adsorption decreases with increasing grain thickness. The phenomenon of high efficiency of the removal process may be caused by complexation reactions between the U ion and the hydroxyl groups present on the surface of the adsorbent particles. Based on the literature, the ionic strength (IS) of seawater was estimated to be 0.7.58 The existence of many chemical forms of U ions in seawater has been proposed using the stability constants between U and OH−, Cl−, CO32− and CO2(g) (IS = 0.5 at 25 °C) in order to demonstrate the possibility of establishing the adsorption mechanism. Based on our proposed distribution diagram of U(VI) species as a function of pH at 25 °C (Fig. 8), it was found that (UO2)11(CO3)6(OH)122− is probably the major form of U ion in the Sea of Japan in the pH range 7.7–9.0.19 During the experiments in seawater, an anion exchange reaction between the U ions and the dissociated anions of the adsorbents probably took place. According to the diagram presented in Fig. 9, under these experimental conditions (pH 7.7–12.0) no cationic forms such as UO22+ or (UO2)2(OH)22+ were present. At higher pH, the CFBC-FA and CFBC-S surfaces were negative, and therefore the uptake of Li and U ions can be explained by electrostatic interactions.19 Additionally, the uptake can be attributed to the calcium content, as well as the content of SiO2, Al2O3, Fe2O3 oxides, which ensure alkalinity in the systems, raising the pH to alkaline values, thus facilitating the uptake of ions with CFBC-FA and CFBC-S.60 In accordance with Yasim et al., the functional groups of adsorbents could be hydrolyzed to other compounds, affecting the availability of binding sites.61 Cheira et al. reported the probable adsorption mechanism between U ions and the Ambersep 920U SO4 resin.59 In accordance with their findings, the proposed adsorption mechanism is the complexation reaction between U ions and the quaternary amine groups. The anionic form of uranium is attached to a positively charged quaternary nitrogen atom to form a complex. In this study, it was estimated that the probable mechanism would be the electrostatic interaction between (UO2)11(CO3)6(OH)122− and a single chemical bond between a metal and an oxygen atom with a higher positive charge as a result of electronegativity of hydroxyl groups in the adsorbent particles. However, it is not known whether the reaction mechanism works the same way with CFBC-FA and CFBC-S.
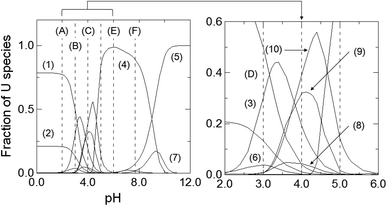 | ||
| Fig. 9 Diagram showing the presence of different U(VI) ion forms as a function of pH at 25 °C (the stability constants between U(VI)O22+ and OH−, Cl−, CO32−, and CO2(g)): (1) UO22+, (2) UO2Cl+, (3) (UO2)2(OH)22+, (4) (UO2)11(CO3)6(OH)122−, (5) (UO2)2CO3(OH)3−, (6) (UO2)2(OH)3+, (7) UO2(CO3)34−, (8) (UO2)3(OH)42+, (9) (UO2)4(OH)62+, (10) (UO2)3(OH)5+. Other U(VI) species, such as UO2Cl2, UO2OH+, UO2(OH)3−, (UO2)3(OH)7−, (UO2)4(OH)35+, UO2CO3, UO2(CO3)22−, (UO2)3(CO3)66−, were omitted due to their small fraction of U(VI) ion forms. (A) pH = 2, (B) pH = 3, (C) pH = 4, (D) pH = 5, (E) pH = 6, (F) pH = 7.7. This speculation was performed by using the data in ref. 19. | ||
Wang et al. reported that the type of atmosphere influences the adsorption of metal ions on the FA surface. Three different atmospheres were tested, namely N2, N2 + O2 and the simulated flue gas. Only three oxides, Al2O3, Fe2O3 and TiO2, showed great ability to absorb Hg2+ (the highest was in the case of Al2O3), while other oxides, CaO and MgO, exhibited little adsorption capacity. The N2 + O2 and simulated flue gas had little effect on the adsorption process. The greater effect on adsorption occurred in the case of the N2 atmosphere.62
At higher pH values (pH > 7), the concentration of H3O+ ions decreased and OH− ions increased. Under such aqueous conditions, OH− ions can bind to H+ ions to form water molecules, then the number of anions dissociated from the hydroxyl group on the surface of the adsorbent material (e.g. SiO−) will increase, which will result in greater electrostatic attraction between ions (including Li and U metal cations). This is because the charges of SiO2, Al2O3 and other oxides (present in the composition of CFBC-FA and CFBC-S) depend on the pH of the solution, therefore it may affect the behavior of the ions.
In the literature, there are three possible mechanisms for binding metal ions to the silica present in FA. Firstly, metal ions under alkaline conditions can bind with hydroxyl groups to form M(OH)X, which interacts with specific –OH groups on silica to remove water ((A) in Fig. 6). Secondly, the hydroxyl group of M(OH)X interacts with Bronsted acid centers ((B) in Fig. 6). In this study, the adsorption mechanism (B) may be excluded because of a low concentration of H+. Thirdly, the hydroxyl groups (–OH) bound to the metal interact with Lewis acid centers, such as tertiary coordinated aluminum in the FA structure ((C) in Fig. 6).63 Hence, the lithium and uranium adsorption mechanism can be generally proposed by eqn (6)–(13).
| X–OH + H3O+ ↔ X–OH2+ + H2O | (6) |
| X–OH + OH− ↔ X–O− + H2O | (7) |
| X–O− + Li+ ↔ (X–O)Li | (8) |
(![[triple bond, length as m-dash]](https://www.rsc.org/images/entities/char_e002.gif) Si–O−) + Li+ ↔( Si–O−) + Li+ ↔(![[triple bond, length as m-dash]](https://www.rsc.org/images/entities/char_e002.gif) Si–O)Li Si–O)Li
| (9) |
(![[triple bond, length as m-dash]](https://www.rsc.org/images/entities/char_e002.gif) Al–O−) + Li+ ↔ ( Al–O−) + Li+ ↔ (![[triple bond, length as m-dash]](https://www.rsc.org/images/entities/char_e002.gif) Al–O)Li Al–O)Li
| (10) |
| X–OH + (UO2)11(CO3)6(OH)122− ↔ X–O−·(UO2)11(CO3)6(OH)112− + H2O | (11) |
(![[triple bond, length as m-dash]](https://www.rsc.org/images/entities/char_e002.gif) Si–OH) + (UO2)11(CO3)6(OH)122− ↔ ( Si–OH) + (UO2)11(CO3)6(OH)122− ↔ (![[triple bond, length as m-dash]](https://www.rsc.org/images/entities/char_e002.gif) Si–O−)·(UO2)11(CO3)6(OH)112− + H2O Si–O−)·(UO2)11(CO3)6(OH)112− + H2O
| (12) |
(![[triple bond, length as m-dash]](https://www.rsc.org/images/entities/char_e002.gif) Al–OH) + (UO2)11(CO3)6(OH)122− ↔ ( Al–OH) + (UO2)11(CO3)6(OH)122− ↔ (![[triple bond, length as m-dash]](https://www.rsc.org/images/entities/char_e002.gif) Al–O−)·(UO2)11(CO3)6(OH)112− + H2O Al–O−)·(UO2)11(CO3)6(OH)112− + H2O
| (13) |
![[triple bond, length as m-dash]](https://www.rsc.org/images/entities/char_e002.gif) SiO−,
SiO−, ![[triple bond, length as m-dash]](https://www.rsc.org/images/entities/char_e002.gif) AlO− are adsorption sites for metal ion removal.
AlO− are adsorption sites for metal ion removal.
3.3. Kinetics analysis
| Metal ion, adsorbent | Adsorbent dosage [g L−1] | Pseudo-first-order kinetic model | Pseudo-second-order kinetic model | ||||
|---|---|---|---|---|---|---|---|
| kad [min−1] | qe [mg g−1] | R2 | k [g mg−1 min−1] | qe [mg g−1] | R2 | ||
| Li(I), fly ash | 50.5 | 0.0014 | 0.003 | 0.471 | 1.206 | 1.994 | 0.999 |
| Li(I), slag | 50.53 | 0.0039 | 0.0046 | 0.682 | 1.071 | 2.116 | 0.999 |
| U(VI), fly ash | 10.57 | 0.0055 | 0.0062 | 0.790 | 147.63 | 0.180 | 0.999 |
| U(VI), slag | 10.77 | 0.0097 | 0.021 | 0.853 | 1172.75 | 0.064 | 0.995 |
| Metal ion, adsorbent | Adsorbent dosage [g L−1] | Langmuir isotherm | Freundlich isotherm | ||||
|---|---|---|---|---|---|---|---|
| Calculated qm [mg g−1] | KL [L mg−1] | R2 | Kf [mg g−1] [L mg−1](1/n) | n | R2 | ||
| Li(I), fly ash | 50.5 | 0.926 | 0.0039 | 0.985 | 0.0055 | 1.200 | 0.994 |
| Li(I), slag | 50.53 | 0.562 | 0.0038 | 0.988 | 0.0038 | 1.269 | 0.995 |
| U(VI), fly ash | 10.57 | 147.6 | 0.263 | 0.976 | 5.471 | 1.031 | 0.998 |
| U(VI), slag | 10.77 | 171.45 | 0.610 | 0.988 | 70.369 | 1.160 | 0.992 |
4. Conclusions
Fly ash and slag obtained from the incineration of municipal sewage sludge using the CFBC technology were studied for the possibility of simultaneously recovering Li(I) and U(VI) ions from seawater (the Sea of Japan) in adsorption processes at room temperature. In the initial tests, the physical and chemical properties of the adsorbents were characterized, then experiments on the adsorption of Li and U ions from seawater were carried out under real and simulated experimental conditions. The best results in the case of Li recovery using CFBC-FA and CFBC-S (particle size range 0–0.212 mm, pH 6.0–7.7) were as follows: adsorption efficiency 12.1%, adsorption capacity 0.55 mg g−1, Kd coefficient 2.76, and 6.8%, 0.15 mg g−1, 1.44 (Kd), respectively. For U adsorption, the results turned out to be very good: adsorption efficiency 98.4%, adsorption capacity 21.3 mg g−1, Kd coefficient 16![[thin space (1/6-em)]](https://www.rsc.org/images/entities/char_2009.gif) 474.7 (fly ash), and 99.9%, 56.7 mg g−1, 63
474.7 (fly ash), and 99.9%, 56.7 mg g−1, 63![[thin space (1/6-em)]](https://www.rsc.org/images/entities/char_2009.gif) 611.9 (Kd) (slag) for CFBC-FA and CFBC-S, respectively. Studies on the effect of the initial pH revealed that lowering the pH caused a reduction in the adsorption efficiency. Analysis of the impact of adsorbent dosage showed that increasing the dose up to 50 g L−1 increased the removal efficiency. Moreover, a dose in the range of 10–50 g L−1 can be considered optimal at pH 7.7. Studies on the influence of contact time revealed that the process reached adsorption equilibrium in the first few hours of the experiments.
611.9 (Kd) (slag) for CFBC-FA and CFBC-S, respectively. Studies on the effect of the initial pH revealed that lowering the pH caused a reduction in the adsorption efficiency. Analysis of the impact of adsorbent dosage showed that increasing the dose up to 50 g L−1 increased the removal efficiency. Moreover, a dose in the range of 10–50 g L−1 can be considered optimal at pH 7.7. Studies on the influence of contact time revealed that the process reached adsorption equilibrium in the first few hours of the experiments.
The adsorption mechanisms of Li and U ions in seawater at pH 7.7 (real conditions) were investigated. Based on the slight dependence of H+ ions on the Li adsorption reaction, it was possible to suggest cation exchange reactions between Li and oxides derived from metal oxides and hydroxides contained in the adsorbent material. The low adsorption efficiency may be due to the strong competitive effect of other elements (e.g. K, Na, Mg) present in seawater, as evidenced by the low value of the Kd coefficient. The elements could possibly prevent the adsorption of Li ions in seawater. It was proposed that a probable mechanism of adsorption was through electrostatic interactions between (UO2)11(CO3)6(OH)122− and a single chemical bond between oxygen and a metal atom with a greater positive charge resulting from the electronegativity of the hydroxyl groups in fly ash and slag adsorbents.
The experiments confirmed that fly ash and slag have higher adsorption capacities in relation to U ions as compared to Li ions in seawater. However, the obtained results confirmed that these waste materials (with the smallest particle size distribution in the range of 0–0.212 mm) produced using the CFBC technology can be successfully used for the simultaneous recovery of Li and U ions from seawater. This achievement can be the basis for further research and potential industrial application in the future.
Conflicts of interest
The authors declare no competing interests.Acknowledgements
This research did not receive a specific grant from any funding agency in the public, commercial or not-for-profit sectors. We would like to express special thanks to Dr Grzegorz Nowaczyk (Nanobiomedical Centre, Adam Mickiewicz University in Poznań, Poland) for taking TEM images in nanoscale of the research samples.References
- L. H. Silva, E. de Lima, R. B. de Paula Miranda, S. S. Favero, U. Lohbauer and P. F. Cesar, Braz. Oral Res., 2017, 31, 133–146 Search PubMed.
- O. Dubois and D. Thiery, Glass Int., 2013, 36, 32–34 Search PubMed.
- A. Sawada, Bull. Soc. Sea Water Sci., Jpn., 2012, 66, 2–7 CAS.
- R. Oruch, M. A. Elderbi, H. A. Khattab, I. Pryme and A. Lund, Eur. J. Pharmacol., 2014, 740, 464–473 CrossRef CAS PubMed.
- A. M. Bradshaw, T. Hamacher and U. Fischer, Fusion Eng. Des., 2011, 86, 2770–2773 CrossRef CAS.
- W. Zhang, C. Xu, W. He, G. Li and J. Huang, Waste Manage. Res., 2018, 36, 99–112 CrossRef CAS PubMed.
- H. Vikstrom, S. Davidsson and M. Hook, Appl. Energy, 2013, 110, 252–266 CrossRef.
- A. R. Putra, Y. Tachibana, M. Tanaka and T. Suzuki, Fusion Eng. Des., 2018, 136, 377–380 CrossRef CAS.
- P. K. Choubey, K.-S. Chung, M.-s. Kim, J.-c. Lee and R. R. Srivastava, Miner. Eng., 2017, 110, 104–121 CrossRef CAS.
- S. Yang, F. Zhang, H. Ding, P. He and H. Zhou, Joule, 2018, 2, 1648–1651 CrossRef.
- USGS, Mineral Commodity Summaries 2017, U.S. Geological Survey, 2017 Search PubMed.
- M. S. Diallo, M. R. Kotte and M. Cho, Environ. Sci. Technol., 2015, 49, 9390–9399 CrossRef CAS PubMed.
- K. Isshiki, Chemistry of the oceans and lakes: studies using trace elements, ed. T. Fujinaga, Y. Sohrin and K. Isshiki, Kyoto University Press, Kyoto, 1st edn, 2005 Search PubMed.
- Y. Tachibana, T. Suzuki, M. Nogami, M. Nomura and T. Kaneshiki, J. Ion Exch., 2018, 29, 90–96 CrossRef CAS.
- I. M. Yamazaki and L. P. Geraldo, Appl. Radiat. Isot., 2003, 59, 133–136 CrossRef CAS PubMed.
- Y. Yamazaki, Y. Tachibana, T. Kaneshiki, M. Nomura and T. Suzuki, Prog. Nucl. Energy, 2015, 82, 74–79 CrossRef CAS.
- D. A. Fungaro, M. Yamaura and G. R. Craesmeyer, Int. Rev. Chem. Eng., 2012, 4, 353–358 Search PubMed.
- World Nuclear Association, World Uranium Mining Production, 2020, https://www.world-nuclear.org/information-library/nuclear-fuel-cycle/mining-of-uranium/world-uranium-mining-production.aspx, accessed: 16.09.2020 Search PubMed.
- Y. Tachibana, M. Tanaka and M. Nogami, J. Radioanal. Nucl. Chem., 2019, 322, 717–730 CrossRef CAS.
- K. Yoshizuka, J. Ion Exch., 2012, 23, 59–65 CrossRef.
- C. W. Abney, R. T. Mayes, T. Saito and S. Dai, Chem. Rev., 2017, 117, 13935–14013 CrossRef CAS PubMed.
- S. Ma, L. Huang, L. Ma, Y. Shim, S. M. Islam, P. Wang, L. D. Zhao, S. Wang, G. Sun, X. Yang and M. G. Kanatzidis, J. Am. Chem. Soc., 2015, 137, 3670–3677 CrossRef CAS PubMed.
- P. A. Kavakli, N. Seko, M. Tamada and O. Güven, Adsorption, 2005, 10, 309–315 CrossRef.
- S. Brown, Y. Yue, L. J. Kuo, N. Mehio, M. Li, G. Gill, C. Tsouris, R. T. Mayes, T. Saito and S. Dai, Ind. Eng. Chem. Res., 2016, 55, 4139–4148 CrossRef CAS.
- P. J. Lebed, J.-D. Savoie, J. Florek, F. Bilodeau, D. Larivi`ere and F. Kleitz, Chem. Mater., 2012, 24, 4166–4176 CrossRef CAS.
- M. Carboni, C. W. Abney, S. B. Liu and W. B. Lin, Chem. Sci., 2013, 4, 2396–2402 RSC.
- J. Li, X. D. Yang, C. Y. Bai, Y. Tian, B. Li, S. Zhang, X. Y. Yang, S. D. Ding, C. Q. Xia and X. Y. Tan, A novel benzimidazole-functionalized 2-D COF material: synthesis and application as a selective solid-phase extractant for separation of uranium, J. Colloid Interface Sci., 2015, 437, 211 CrossRef CAS PubMed.
- A. F. Ismail and M. S. Yim, Nucl. Eng. Technol., 2015, 47, 579–587 CrossRef.
- S. Kou, Z. Yang and F. Sun, ACS Appl. Mater. Interfaces, 2017, 9, 2035–2039 CrossRef CAS PubMed.
- J. Qu, W. Li, C. Y. Cao, X. J. Yin, L. Zhao, J. Bai, Z. Qin and W. G. Song, J. Mater. Chem., 2012, 22, 17222–17226 RSC.
- T. Kalak, A. Kłopotek and R. Cierpiszewski, Microchem. J., 2019, 145, 1011–1025 CrossRef.
- T. Kalak, J. Dudczak and R. Cierpiszewski, in Selected problems of quality of industrial products, ed. M. Paździor, J. Żuchowski, R. Zieliński and K. Melski, Kazimierz Pułaski University of Technology and Humanities in Radom, 2018, pp. 191–203 Search PubMed.
- T. Kalak and R. Cierpiszewski, Pol. J. Chem. Technol., 2019, 4, 72–81 CrossRef.
- G. Itskosa, N. Koukouzasa, C. Vasilatosb, I. Megremib and A. Moutsatsouc, J. Hazard. Mater., 2010, 183, 787–792 CrossRef PubMed.
- B. Nowak, P. Aschenbrenner and F. Winter, Fuel Process. Technol., 2013, 105, 195–201 CrossRef CAS.
- R. Bhardwaj, X. Chen and R. D. Vidic, J. Air Waste Manage. Assoc., 2009, 59, 1331–1338 CrossRef CAS PubMed.
- S. V. Yadla, V. Sridevi and M. V. V. Chandana Lakshmi, Int. J. Eng. Res. Technol., 2012, 1, 1–7 CrossRef.
- G. F. Brendel, Proceedings of 11th International Symposium on the Use and Management of Coal Combustion By-products (CCBs), Orlando, USA, 1995, vol. 2, p. 65 Search PubMed.
- H. Cho, D. Oh and K. A. Kim, J. Hazard. Mater., 2005, 127, 187–195 CrossRef CAS PubMed.
- S. Wang, M. Soudi, L. Li and Z. H. Zhu, J. Hazard. Mater., 2006, 133, 243–251 CrossRef CAS PubMed.
- L. Kong, J. Bai, Z. Bai, Z. Guo and W. Li, Fuel, 2013, 109, 76 CrossRef CAS.
- Z. Kavaliauskas, V. Valincius, G. Stravinskas, M. Milieska and N. Striugas, J. Air Waste Manage. Assoc., 2015, 65, 1292–1296 CrossRef CAS PubMed.
- H. Rong, T. Wang, M. Zhou, H. Wang, H. Hou and Y. Xue, Energies, 2017, 10, 438–444 CrossRef.
- M. Mohebbi, F. Rajabipour and B. E. Scheetz, World of Coal Ash (WOCA) Conference in Nasvhill, 2015 Search PubMed.
- J. Paya, J. Monzo, M. V. Borrachero, E. Perris and F. Amahjour, Cem. Concr. Res., 1998, 28, 675–686 CrossRef CAS.
- J. Liu, Q. Qiu, F. Xing and D. Pan, Materials, 2014, 7, 4282–4296 CrossRef PubMed.
- Y. S. Ho, Bioresour. Technol., 2005, 96, 1292–1296 CrossRef CAS PubMed.
- C. H. Weng and C. P. Huang, Colloids Surf., A, 2004, 247, 137–143 CrossRef CAS.
- L. Ma, Q. Wei, Y. Chen, Q. Song, C. Sun, Z. Wang and G. Wu, R. Soc. Open Sci., 2018, 5, 171051 CrossRef PubMed.
- W. Li, S. Zhou, X. Wang, Z. Xu, C. Yuan, Y. Yu, Q. Zhang and W. Wang, J. Geophys. Res., 2011, 116, 129642250 Search PubMed.
- A. Assi, F. Bilo, A. Zanoletti, J. Ponti, A. Valsesia, R. La Spina, L. E. Depero and E. Bontempi, Sustainability, 2020, 12(10), 4193 CrossRef.
- D. A. Fungaro and M. V. da Silva, Am. J. Environ. Prot., 2014, 2, 83–88 CrossRef.
- S. Ueda, H. Koyo, T. Ikeda, Y. Kariya and M. Maeda, ISIJ Int., 2000, 40, 739–743 CrossRef CAS.
- O. Iliashevsky, E. Rubinov, Y. Yagen and M. Gottlieb, Open J. Inorg. Chem., 2016, 6, 163–174 CrossRef CAS.
- L. Bláhová, M. Mucha, Z. Navrátilová and S. Gorošová, Inz. Miner., 2015, 2, 89–94 Search PubMed.
- M. Martinez, N. Miralles, S. Hidalgo, N. Fiol, I. Villaescusa and J. Poch, J. Hazard. Mater., 2006, 133, 203–211 CrossRef CAS PubMed.
- Y. Tachibana, T. Kaneshiki, M. Nomura and T. Suzuki, J. Ion Exch., 2014, 25, 199–206 CrossRef.
- A. Ohta, Geochem. J., 2006, 40, 13–30 CrossRef CAS.
- M. F. Cheira, B. M. Atia and M. N. Kouraim, J. Radiat. Res. Appl. Sci., 2017, 10, 307–319 CrossRef CAS.
- I. J. Alinnor, Fuel, 2007, 86, 853–857 CrossRef CAS.
- N. S. E. M. Yasim, N. A. N. Ariffin, N. Mohammed and S. Ayob, Proc. the 3rd Int. Symp. Appl. Chem., 2017, vol. 1904, pp. 1–15, DOI: DOI:10.1063/1.5011939.
- F. Wang, S. Wang, Y. Meng, L. Zhang, Q. Wu and J. Hao, Fuel, 2016, 163, 232–239 CrossRef CAS.
- E. Sočo and J. Kalembkiewicz, J. Environ. Chem. Eng., 2013, 1, 581–588 CrossRef.
- E. Oguz, J. Colloid Interface Sci., 2005, 281, 62 CrossRef CAS PubMed.
Footnote |
| † Electronic supplementary information (ESI) available. See DOI: 10.1039/d0ra09092a |
| This journal is © The Royal Society of Chemistry 2021 |

