 Open Access Article
Magnetic-enhanced fluorescence sensing of tumor miRNA by combination of MNPs@PDA with duplex specific nuclease †
Yujie Sun,
Cancan Wang,
Lina Tang,
Yulin Zhang * and
Guo-Jun Zhang*
School of Laboratory Medicine, Hubei University of Chinese Medicine, 16 Huangjia Lake West Road, Wuhan 430065, People's Republic of China. E-mail: zhanggj@hbtcm.edu.cn; zhangyulin2001@163.com; Fax: +86-27-68890259; Tel: +86-27-68890259
First published on 13th January 2021
Abstract
Highly sensitive and specific detection of miRNA still remains challenging. In this work, a simple and sensitive fluorescence biosensor has been developed for detection of miRNA by combining the magnetic nanoparticles coated with poly-dopamine (MNPs@PDA) with duplex specific nuclease (DSN). The MNPs@PDA could be easily synthesized via autoxidation of dopamine on the surface of magnetic nanoparticles. The MNPs@PDA could specifically bind with the FAM-labeled single-strand DNA (ssDNA) probes via polyvalent metal-mediated coordination, resulting in the quench of fluorescence signal. The MNPs@PDA exhibited good anti-interference performance in complex matrix. The inner filter effect (IFE) of the MNPs@PDA could be eliminated via magnetic separation. In the presence of specific miRNA, DSN digested the DNA in the DNA–miRNA duplexes and small fragments were formed. The force between these small fragments and MNPs@PDA was negligible, resulting in the occurrence of fluorescence signal. Due to the incorporation of DSN, signal amplification was realized via the recycling process. The established method achieved a low detection limit down to 0.42 pM. The linear concentration range was from 5 pM to 5 nM. Moreover, this method also had high specificity. Remarkably, the target miRNAs extracted from human cells were detected by using the sensing platform.
Introduction
Cancer has the second-highest mortality rate. The early diagnosis is the most efficient way to improve the survival rate of cancer patients. Due to its easy operation, non-invasiveness, and rapid response, liquid biopsy is considered to be one of the most promising technologies for early diagnosis of tumors. Differential changes of miRNA expression in body fluid are associated with many diseases, including multiple types of cancer. Therefore, detection of disease-specific miRNA in vivo can effectively diagnose diseases and develop personalized treatment schemes. Electrochemistry,1 surface-enhanced Raman scattering,2 mass spectrometry,3 microchip electrophoresis,4 chemiluminescence imaging array,5 surface plasmon resonance6 have been developed for the detection of miRNA. These assays have utilized the different strategies and each of them has respective advantages. However, these methods still remain challenging for the detection of miRNA in biological samples.Fluorescence spectroscopy (FS) has the advantages of simple operation, low-cost, and high selectivity. Based on the characteristics of nanomaterials (graphene oxide,7 carbon nanotube, WS2,8 molybdenum disulfide9), they have been widely used in FS for the detection of biomarkers (DNA,8 miRNA,10 proteins,11 small molecules12 and exosomes13). In principle, these biomarkers are adsorbed on nanomaterials through π–π stacking and hydrogen bond. But these binding forces are all susceptible to competition from biomolecules, resulting in non-specific displacement and false-positive signals. Due to the interference of the biomolecules in complex sample matrix, most of these assays had the difficulty in detecting biological samples. It is reported that poly-dopamine nanoparticles (PDANs) present better anti-interference performance via polyvalent metal-mediated coordination in most biological matrix compared to these above-mentioned nanomaterials.14 The PDANs can coordinate with DNA oligonucleotides in the presence of divalent metal ion (Mg2+ or Ca2+). This adsorption function can resist non-specific displacement of biomolecules in complex sample matrix. PDANs can be easily formed by self-polymerization of dopamine at pH 8.5. However, not only are the PDANs difficult to be collected but also the PDANs are also easy to aggregate during the synthesis process. Inner filter effect (IFE) is an important non-irradiation energy conversion model in fluorescence spectroscopy, which results from the absorption of the excitation and/or emission light by the quencher in the detection system. Moreover, the PDANs weaken the fluorescence signal of solution due to IFE, resulting from the absorption of the excitation and/or emission light. In view of magnetic nanoparticles' (MNPs) easy-handing property, the MNPs@PDA can easily be synthesized by coating PDA on the surface of MNPs. Meanwhile, the MNPs@PDA can be easily collected under a magnetic field. This eliminates the cumbersome centrifugation procedure for collecting PDANs. Moreover, the IFE of the MNPs@PDA can be eliminated by removing them under magnetic force by replacing PDANs.
FS is always combined with the signal amplification strategy to improve the detection sensitivity of biomarkers. For instance, hybridization chain reaction,15 T7 exonuclease,16 rolling circle amplification17 have been utilized for the detection of miRNA in FS. Duplex specific nuclease (DSN) is a heat-stabilized nuclease, which can selectively digest the DNA strands in double-stranded DNA and DNA–RNA hybridization duplexes. But it has no effect on single-stranded nucleic acid molecules (ssDNA or ssRNA). So DSN is considered to be an ideal signal amplification tool for its high selectivity and high efficiency.
In this study, we aim to develop a magnetic-enhanced fluorescence biosensor for quantitative detection of miRNA based on MNPs@PDA and DSN. Firstly, we prepare the MNPs@PDA via a simple procedure. The FAM-labeled DNA can adsorb on the surface of MNPs@PDA via polyvalent metal-mediated coordination and the fluorescence of FAM-labeled DNA is quenched. The target miRNAs hybridized with the FAM-labeled DNA to form duplex-strand structure which has the weak affinity with the MNPs@PDA. DSN digests the FAM-labeled DNA of the duplex-strand structure to generate large number of small fragment sequences. These small fragment sequences have very weak affinity with the MNPs@PDA. This procedure leads to the occurrence of strong fluorescence. The IFE of MNPs@PDA can also be alleviated via magnetic separation of MNPs@PDA from solution, which can further improve the sensitivity of this strategy.
Experimental
Materials
The probe DNA sequences and miRNA sequences used in the experiment were synthesized by Shanghai Sangon Biotech Co. Ltd. (Shanghai, China, https://www.sangon.com/) and purified by HPLC. The sequences are shown in Table S1.† Duplex-specific nuclease (DSN) was obtained from Evrogen Joint Stock Company (Moscow, Russia, http://evrogen.com/). Fe3O4 magnetic nanoparticles were purchased from Nanjing XFNANO Materials Tech. Co. Ltd. (Nanjing, China, https://www.xfnano.com/). HEPES, sodium chloride, calcium chloride, dopamine hydrochloride, and other chemicals were purchased from Sigma-Aldrich (Saint Louis, MO, USA, https://www.sigmaaldrich.com/). The pure water used to prepare the solution was provided by Millipore water purification system (Millipore Corp., Bedford, USA, http://www.merckmillipore.com/) with an electrical resistance of 18.2 MΩ and autoclaved with 0.1% DEPC. The buffer composition used in the experiment was: 1 × DSN buffer (50 mmol L−1 Tris–HCl, pH 8.0, 5 mmol L−1 MgCl2, 1 mmol L−1 DTT), Tris–HCl buffer (25 mmol L−1, pH 7.4, 50 mmol L−1 NaCl), HEPES buffer (50 mmol L−1, pH 7.4, 50 mmol L−1 NaCl, 2 mmol L−1 CaCl2).Instrumentation
Nicolet Nexus-6700 type Fourier transform infrared spectrometer (Thermo Fischer technology Co. Ltd., USA), DXR Raman spectrometer (Thermo Fischer technology Co. Ltd., USA), EI Talos F200X transmission electron microscope (Thermo Fischer technology Co. Ltd., USA), Hitachi F-4600 fluorescence spectrophotometer (Hitachi Co. Ltd., Japan) fluorescence spectrum measurement conditions: xenon lamp excitation, excitation and emission slit width are 5.0 nm, voltage is set at 700 V, response time is 0.04 s, excitation wavelength is 495 nm, emission wavelength scanning range is 510–650 nm. The sample volume was 1 mL with standard quartz colorimeter. Fluorescence data were processed by professional software Origin 8.0.Preparation of polydopamine-coated magnetic nanoparticles (MNPs@PDA)
10 milligrams of Fe3O4 magnetic nanoparticles powder were dissolved in 100 mL of pH 8.5 Tris–HCl buffer. The mixture was placed in ultrasonically homogenized by an ultrasonic cell disruptor at 150 W for 3 h to obtain a homogeneous magnetic nanoparticles solution (final concentration: 0.1 mg mL−1). Dopamine hydrochloride (DA) was added to the above magnetic nanoparticle solution and the mixture were vortexed for at least 10 h protected from light. Then MNPs@PDA were collected magnetically and washed with water to remove the non-reacted DA for 3 times. The Raman spectrometer and a FT-IR spectrometer were used to characterize MNPs@PDA. Well-characterized MNPs@PDA were dispersed in water for ultrasonic treatment for 2 h to obtain evenly dispersed black MNPs@PDA aqueous solution (0.1 mg mL−1). The prepared MNPs@PDA were placed in a refrigerator at 4 °C for later use.Determination of the target sequence
The miRNA detection procedure included two sequential steps. Firstly, 20 μL of reaction solution containing 1 × DSN master buffer (50 mM Tris–HCl, pH 8.0, 5 mM MgCl2, 1 mM DTT), 0.2 U DSN (dissolved in 25 mM Tris–HCl, pH 8.0, 50% glycerol), probe DNA (4 μL, 10 μM) and target miRNA at different concentrations, were incubated at 50 °C for 90 min, then cooled to room temperature. Subsequently, the mixture was diluted with 970 μL of HEPES buffer solution (25 mM HEPES, pH 7.4, 50 mM NaCl, 2 mM CaCl2), after which the MNPs@PDA (10 μL, 0.1 mg mL−1) were added. After incubation for 5 min and magnetic separation for 2 min, the fluorescence intensity of the mixture was measured. F1 is the fluorescence intensity in the presence of miRNA-141. F0 is the fluorescence intensity in the absence of miRNA-141.Cell culture and RNA extraction
The human prostate carcinoma cells (PC-3) and normal prostate epithelial cells (RWPE-1) were cultured in Dulbecco's Modified Eagle's Medium (DMEM) containing 10% (v/v) FBS and 1% penicillin–streptomycin solution (100 U mL−1) at 37 °C in a humidified atmosphere with 5% CO2. Total RNA was extracted from cells using the miRcute miRNA Isolation Kit (Tiangen Biotech Co. Ltd., Beijing, China). The total RNA samples were then analyzed directly using our fluorescence biosensor.Results and discussion
Principle of amplified miRNA detection
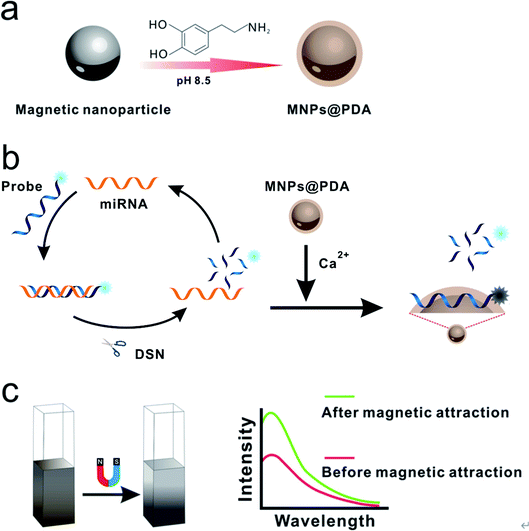
The principle of MNPs@PDA-mediated detection of miRNA is illustrated in Scheme 1. Firstly, the MNPs@PDA is synthesized by dispersing the MNPs in the dopamine solution (pH 8.5). In the presence of target miRNA, the DNA probes hybridize with miRNAs to form DNA–RNA hetero-duplexes. On the other hand, because DSN can selectively digest DNA in DNA–RNA hybridization, the FAM-labeled DNA sequences are cleaved into small fragments, releasing miRNA from the duplexes. The released target miRNA hybridizes with another DNA probe again and the next round of cleavage starts. In such a way, the enzyme digestion reaction is recycled, resulting in more and more fragments. The DNA probe labeled with 6-carboxy fluorescence (FAM) can be adsorbed onto the surface of MNPs@PDA with Ca2+ aided, leading to the quench of fluorescence. While fragments of DSN digestion results in significant amplification of fluorescence signal. The nanomaterials as quencher dispersed in solution can decrease the fluorescence intensity due to the IFE. Nevertheless, the IFE of MNPs@PDA can be easily alleviated via separating the MNPs@PDA to the bottom of the tube under the magnetic force. In this strategy, the increase of fluorescence signal is directly proportional to the amount of target miRNA. Based on the synergy of multiple factors, the low abundance of target miRNA can be quantitatively determined.Characterizations
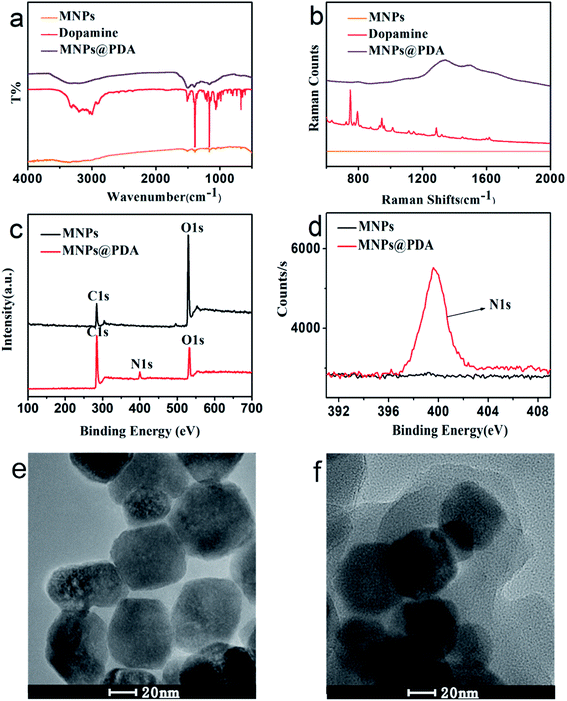
Different techniques such as high-resolution transmission electron microscope (HRTEM), X-ray photoelectron spectroscopy (XPS), FT-IR and Raman spectroscopy were used to characterize the prepared MNPs@PDA. FT-IR spectra of MNPs@PDA are displayed in Fig. 1a. The FT-IR of MNPs has no characteristic peak. The FT-IR of dopamine has an obvious absorption band around 3200 cm−1, which is ascribed to hydroxyl (–OH) and nitrogen hydrogen bond (N–H) groups. Dopamine has multiple absorption bands appeared at about 1620 cm−1 (superposition of C–N bending and phenylic C![[double bond, length as m-dash]](https://www.rsc.org/images/entities/char_e001.gif) C stretching), 1495 cm−1 (C–N) and 1273 cm−1 (C–O stretching). MNPs@PDA have a broad absorption band between 3000–3500 cm−1, which is ascribed to hydroxyl (–OH) and nitrogen hydrogen bond (N–H) groups. Meanwhile, MNPs@PDA has characteristic absorption band between 1000–1600 cm−1. Because MNPs@PDA is a solid particle which has an impact on the infrared absorption characteristic band, so the absorption band of MNPs@PDA shows a large blunt peak. These indicated the PDA layer was successfully modified on the surface of the MNPs.
C stretching), 1495 cm−1 (C–N) and 1273 cm−1 (C–O stretching). MNPs@PDA have a broad absorption band between 3000–3500 cm−1, which is ascribed to hydroxyl (–OH) and nitrogen hydrogen bond (N–H) groups. Meanwhile, MNPs@PDA has characteristic absorption band between 1000–1600 cm−1. Because MNPs@PDA is a solid particle which has an impact on the infrared absorption characteristic band, so the absorption band of MNPs@PDA shows a large blunt peak. These indicated the PDA layer was successfully modified on the surface of the MNPs.
Raman spectra (Fig. 1b) shows the MNPs has no characteristic peak. The MNPs@PDA has the two peaks appeared at ca. 1300 cm−1 (associated to the stretching of catechol) and 1500 cm−1 (associated to the deformation of catechol). The PDA film coated on the MNPs surface was also confirmed by Raman spectroscopy. In order to further confirm the PDA shell was triumphantly coated on the surface of the Fe3O4 particles, XPS was carried out to provide detailed elemental information of the surface atomic composition of the synthesized products. Fig. 1c shows XPS spectra for MNPs and MNPs@PDA. Compared with the MNPs, the MNPs@PDA has extra N 1s peak showed at 399.6 eV (Fig. 1c and d). This suggest the presence of PDA on the MNPs surface after polymerization step and confirmed the successful coating of MNPs with the PDA film.
Fig. 1e and f shows the HRTEM images of the MNPs and the MNPs@PDA core–shell hybrid nanomaterials, respectively. The MNPs had an average diameter of about 60 nm (MNPs, Fig. 1e). The synthetic MNPs@PDA with dark MNPs core were individually coated with gray PDA shells. After coated with PDA shell, the nanocomposites had a smooth surface. The mean thickness of the PDA coating shell was ca. 15 nm (MNPs@PDA, Fig. 1f). All above characteristics indicate the successful synthesis of MNPs@PDA.
Feasibility study of the method
Nanomaterials including graphene oxide (GO),10 carbon nanotubes,18 carbon nanoparticles,19 MoS2,9 gold nanoparticles20 can adsorb the ssDNA via π–π stacking. These nanomaterials adsorbed biomolecules mainly via π–π stacking, they can adsorb proteins, nucleic acids and cells. There are large amounts of proteins and cells in the biological samples, this will cause great interference to the detection of nucleic acid in these nanomaterials-based sensing systems. However, polydopamine nanoparticles (PDANs) can adsorb ssDNA via polyvalent metal-mediated coordination.14 Compared with only π–π bond, the polyvalent metal-mediated coordination has higher specificity. PDA adsorbs single strand nucleic acid specifically and is not affected by matrix such as protein and cells. Therefore, PDA shows good potential for detection of biomolecules in clinical diagnosis due to its high anti-interference ability. The preparation of MNPs@PDA is also convenient. At the same time, the MNPs@PDA can avoid the aggregation issue of PDANs. In this work, PDA was coated on the surface of MNPs to form the MNPs@PDA. As shown in Fig. S1,† in the absence of divalent metal ion Ca2+, the solution had strong fluorescence signal (Fig. S1a†). This indicates the FAM-labeled ssDNA has weak adsorption to the MNPs@PDA. In the presence of divalent metal ions Ca2+, the solution had weak fluorescence signal (Fig. S1b†). It showed that the ssDNA adsorption on MNPs@PDA surface is mainly based on the effect of metal-mediated coordination not π–π stacking force. It means the MNPs@PDA has strongly bound with the FAM-labeled ssDNA under the assistance of divalent metal ion. The binding mechanism is similar with that of the PDA.14To confirm the validity of the proposed platform, the fluorescence measurement was performed with 500 pM miRNA-141. The miRNA-141 is selected as model targets because their expression level is closely related with human cancer. When MNPs@PDA was added to the solution, the fluorescence signal of the FAM-labeled ssDNA (Fig. 2a) was quenched about 90% (Fig. 2d). The high quench efficiency shows the high affinity between DNA probe and MNPs@PDA. When the target miRNA was introduced, the DNA–RNA heteroduplex was formed and DNA was released from the MNPs@PDA surface. Thus the fluorescence was recovered a bit (Fig. 2c). In the simultaneously exist of the target miRNA and DSN, the FAM-labeled ssDNA in the duplex was digested by DSN and formed FAM-labeled fragment sequences. The strong fluorescence signal emerged due to the very weak affinity between FAM-labeled fragment sequences and MNPs@PDA (Fig. 2b). The amplified fluorescence signal was obtained after the addition of DSN.
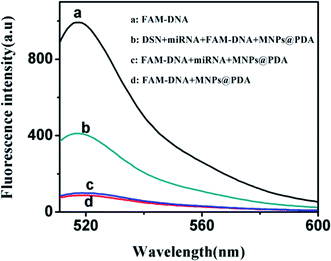 | ||
| Fig. 2 Fluorescence emission spectra of (a) FAM-DNA; (b) DSN + miRNA + FAM-DNA + MNPs@PDA; (c) FAM-DNA + miRNA + MNPs@PDA; (d) FAM-DNA + MNPs@PDA. | ||
We used magnetic force separating the MNPs@PDA from the solution to confirm the IFE. The fluorescence spectra of the system before and after magnetic separation are shown in Fig. S2.† When miRNA and DSN were present in the solution, the fluorescence signal of “after magnetic separation” (Fig. S2a†) was significantly enhanced compared to the fluorescence signal of “before magnetic separation” (Fig. S2b†). This indicates that the MNPs@PDA in solution can decrease the fluorescence intensity of the solution due to the IFE. Meanwhile, the IFE of MNPs@PDA can be alleviated via magnetic separation. In the absence of miRNA and DSN, the fluorescence signal also has slight increase after magnetic separation (Fig. S2c and d†). The above results indicate that the miRNA detection platform based on MNPs@PDA and DSN is feasible.
Optimization of experimental conditions
In order to achieve the best detection results, the experimental conditions such as the concentration of MNPs@PDA, the concentration of DSN, the enzyme digestion temperature and time are optimized.The concentration of MNPs@PDA affects the fluorescence value of F1 as well as the value of F0. As shown in Fig. 3a, when the DA concentration was changed from 1 μg mL−1 to 10 μg mL−1, the ratio between F1 and F0 gradually increased. When the MNPs@PDA concentration exceeded 10 μg mL−1, the ratio between F1 and F0 did not increase significantly. Although the affinity of small DNA fragments produced from enzyme digestion with MNPs@PDA was weak, excessive MNPs@PDA also led to the adsorption of nucleic acid sequences of small fragments. This reduced the fluorescence intensity of the F1. Therefore, 10 μg mL−1 was selected as the optimal MNPs@PDA reaction concentration.
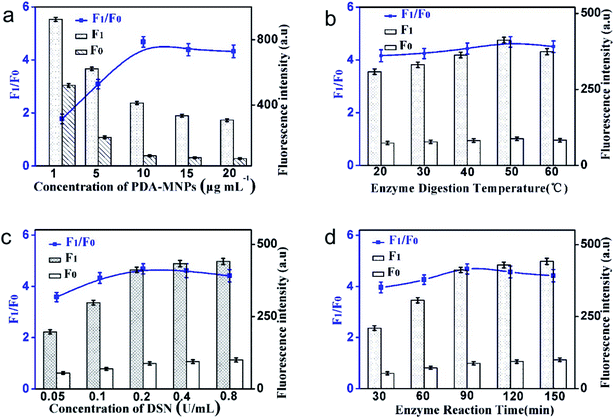 | ||
| Fig. 3 The effect of (a) MNPs@PDA concentration, (b) enzyme digestion temperature, (c) DSN concentration and (d) enzyme reaction time on the fluorescence response of the sensing system. | ||
In this experimental system, higher temperature can promote the activity of enzyme digestion. Meanwhile, higher temperature, which is over the Tm of DNA–RNA duplexes, leads to duplexes dissolution and reduces the reaction rate. Therefore, it is very important to choose a suitable reaction temperature. As shown in Fig. 3b, the ratio of F1 to F0 was the highest at the temperature of 50 °C, so the temperature of the enzyme digestion reaction was selected as 50 °C.
The fluorescence intensity of F1 and F0 with different concentrations of DSN is shown in Fig. 3c. The F1/F0 increased significantly with the increase of the concentration of DSN in the range from 0.05 U mL−1 to 0.2 U mL−1, and decreased slowly from 0.2 U mL−1 to 0.8 U mL−1 due to the non-specific enzyme digestion. In order to ensure the specificity of the experiment, the optimal enzyme concentration was set as 0.2 U mL−1.
As can be seen from Fig. 3d, in the reaction system of 20 μL, when the incubation time was increased to 90 min, the F1/F0 achieved the highest value. When the dosage of DSN was 0.2 U mL−1 and the incubation time was 90 min, the enzyme digestion efficiency of the system reached the saturation state.
Specificity of miRNA detection
To evaluate the specificity of the method, a series of sequences, including miR-21, RS ssDNA, SM RNA were applied at the proposed method. The miR-141 (T1) is fully complementary with the FAM-labeled DNA, SM RNA (T2) is single-base mismatched sequences, the RS ssDNA (T3) is a random DNA sequences, miR-21 (T4) is completely mismatched sequences, blank is without adding sequence. Experimental results are shown in Fig. 4. When 500 pM miR-141 (T1) was added into the system, the obvious fluorescence signal was observed. But the fluorescence signals of T3 and T4 only increased slightly compared with that of the blank. Noticeably, even the single-base mismatch sequence (T2) did not produce obvious fluorescence enhancement. It can be seen that the method designed in this work has high selectivity and can achieve specific detection of miRNA-141, even single base mismatched. The high selectivity of this established sensor was mainly based on the two factors: the high specificity of DSN enzyme and the high anti-interference ability of the MNPs@PDA.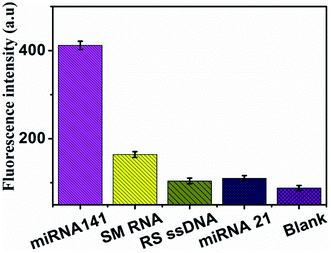 | ||
| Fig. 4 Specificity evaluation of the method for miRNA detection. Bars represent the fluorescence intensity vs. different targets. | ||
Stability of quenching efficiency of MNPs@PDA
To evaluate the stability of quenching efficiency of MNPs@PDA, we repeated the detection of 500 pM miRNA-141 by the proposed biosensors over one week. As shown in Fig S3,† there is high stability (RSD = 0.25%) in the repeated fluorescence signals of the target-responsive signal. This indicates the prepared MNPs@PDA has high stability which is beneficial for real application.Detection of miRNA
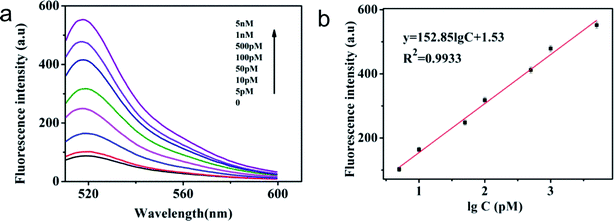
Under optimal experimental conditions, a series of different concentrations of T1 were used to evaluate the detection sensitivity of the sensor. As shown in Fig. 5 and S4,† when T1 concentration increased from 0 to 5 nmol L−1, the fluorescence signals of the system also increased in both cases (before and after magnetic separation). There is a good linear relationship between fluorescence signal and T1 concentration ranging from 10 pM to 5 nM (R2 = 0.9906) without magnetic separation and 5 pM to 5 nM (R2 = 0.9933) with magnetic separation. Based on the 3σ method, the detection limit of 0.42 pM with magnetic separation was obtained, while the detection limit without magnetic separation was 6.1 pM. We found that the sensor with magnetic separation had a wider linear relationship range and the lower detection limit than that without magnetic separation. It demonstrates that magnetic separation can significantly enhance the sensitivity of the magnetic sensor. The analytical performances of different assays are compared in Table 1. The LOD of this proposed method is better or comparable to that of some previously reported fluorescence sensors for miRNA detection.| Detection target | Detection method | Linear range | LOD | Ref. |
|---|---|---|---|---|
| miRNA-141 | Fluorescence method | 5 pM to 5 nM | 0.42 pM | This work |
| let-7a | Fluorescence method | 0.5 pM to 500 pM | 0.4 pM | 21 |
| miRNA-21 | Fluorescence method | 0.001 nM to 10 nM | 300 fM | 22 |
| miRNA-21 | Fluorescence method | — | 2.0 pM | 23 |
| miRNA-141 | Colorimetric method | 10 pm to 100 nm | 10 pM | 24 |
| let-7a | Fluorescence method | 5 pM to 500 pM | 3.8 pM | 25 |
| miRNA-122 | Chemiluminescence | 80 pM to 50 nM | 49.6 pM | 26 |
| let-7a | Fluorescence method | 10 pM to 1 nM | 2.3 pM | 27 |
Detection of miRNA from human cells
To further evaluate the applicability of our proposed method, the content of miR-141 in human prostate cancer cell line PC-3 cell and normal prostate cell line RWPE-1 cell was analyzed. Total RNA was extracted from each cell line according to the kit protocol, after which the fluorescence signal was measured with the proposed biosensor. As displayed in Fig. 6, there was significant increase of fluorescence intensity with the rising of cell numbers (from 105 to 106 cells) for PC-3 cell, while negligible signal was observed for RWPE-1 cell. This result indicates that miR-141 is highly up-regulated in cancer cells as compared to that in normal cells, which is consistent with the known literature.28–30 It demonstrates that the proposed platform has a promising application in research of clinical diagnosis of cancers.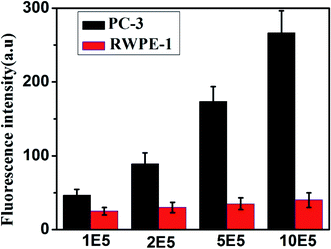 | ||
| Fig. 6 Fluorescence intensity in PC-3 and RWPE-1 cell of different concentrations. Error bars are standard deviation of three repetitive experiments. | ||
Conclusions
In this study, a novel fluorescence biosensor based on MNPs@PDA and DSN enzyme digestion has been designed for detection of miRNA. The DSN has high enzyme digestion activity and selectivity. The prepared MNPs@PDA as fluorescence quencher has ideal quenching efficiency and good performance in terms of anti-interference to biomolecules under the assistance of divalent metal ion. Moreover, the IFE of MNPs@PDA can be avoided via magnetic separation of the MNPs@PDA from the solution. Based on the synergy of these features, the developed method exhibits high sensitivity and good specificity for the detection of miRNA. The detection limit for miRNA can be as low as 0.42 pM. Besides, the proposed method is successfully employed for analysis of miR-141 in human cells. This proposed strategy shows good potential for detection of miRNAs in clinical diagnosis. In addition, due to good biocompatibility and magnetic properties of composites, MNPs@PDA are promising candidates in the fields of controlled targeted drug delivery as well as MR imaging.Conflicts of interest
There are no conflicts to declare.Acknowledgements
This work was supported by the National Natural Science Foundation of China (No. 21974035) and Research Plan Projects of the Hubei Provincial Department of Education (No. Q20162007).References
- F. Mo, J. Wu, M. Chen, H. Meng, Q. Han and Y. Fu, Sens. Actuators, B, 2019, 289, 269–276 CrossRef CAS.
- H. Zhang, C. Fu, S. Wu, Y. Shen, C. Zhou, J. Neng, Y. Yi, Y. Jin and Y. Zhu, Anal. Methods, 2019, 11, 783–793 RSC.
- C.-X. Shi, S.-X. Li, Z.-P. Chen, Q. Liu and R.-Q. Yu, Anal. Chem., 2018, 91, 2120–2127 CrossRef.
- K. Wei, J. Zhao, Y. Qin, S. Li, Y. Huang and S. Zhao, Talanta, 2018, 189, 437–441 CrossRef CAS.
- S. Yue, T. Zhao, S. Bi and Z. Zhang, Biosens. Bioelectron., 2017, 98, 234–239 CrossRef CAS.
- W. Nie, Q. Wang, X. Yang, H. Zhang, Z. Li, L. Gao, Y. Zheng, X. Liu and K. Wang, Anal. Chim. Acta, 2017, 993, 55–62 CrossRef CAS.
- Y. Zhang, L. Tang, F. Yang, Z. Sun and G.-J. Zhang, Microchim. Acta, 2015, 182, 1535–1541 CrossRef CAS.
- S. Wang, Y. Zhang, Y. Ning and G.-J. Zhang, Analyst, 2015, 140, 434–439 RSC.
- L. Xiao, L. Xu, C. Gao, Y. Zhang, Q. Yao and G.-J. Zhang, Sensors, 2016, 16, 1561 CrossRef.
- S. Guo, F. Yang, Y. Zhang, Y. Ning, Q. Yao and G.-J. Zhang, Anal. Methods, 2014, 6, 3598–3603 RSC.
- Z. Liu, D. Luo, F. Ren, F. Ran, W. Chen, B. Zhang, C. Wang, H. Chen, J. Wei and Q. Chen, RSC Adv., 2019, 9, 11960–11967 RSC.
- Y. Zhang, Z. Sun, L. Tang, H. Zhang and G.-J. Zhang, Microchim. Acta, 2016, 183, 2791–2797 CrossRef CAS.
- D. Jin, F. Yang, Y. Zhang, L. Liu, Y. Zhou, F. Wang and G.-J. Zhang, Anal. Chem., 2018, 90, 14402–14411 CrossRef CAS.
- Y. Meng, P. Liu, W. Zhou, J. Ding and J. Liu, ACS Nano, 2018, 12, 9070–9080 CrossRef CAS.
- F. Zhang, S. Wang, R. Zou, L. Xiang and C. Cai, Talanta, 2019, 202, 342–348 CrossRef CAS.
- X. Li, N. Huang, L. Zhang, J. Zhao and S. Zhao, Talanta, 2019, 202, 297–302 CrossRef CAS.
- W. Yu, J. Li, C. Zuo, Y. Tao, S. Bai, J. Li, Z. Zhang and G. Xie, Anal. Chim. Acta, 2019, 1068, 96–103 CrossRef CAS.
- R. Yang, J. Jin, Y. Chen, N. Shao, H. Kang, Z. Xiao, Z. Tang, Y. Wu, Z. Zhu and W. Tan, J. Am. Chem. Soc., 2008, 130, 8351–8358 CrossRef CAS.
- H. Li, Y. Zhang, L. Wang, J. Tian and X. Sun, Chem. Commun., 2011, 47, 961–963 RSC.
- X.-M. Miao, L.-S. Ling and X.-T. Shuai, Anal. Biochem., 2012, 421, 582–586 CrossRef CAS.
- X. Lin, C. Zhang, Y. Huang, Z. Zhu, X. Chen and C. J. Yang, Chem. Commun., 2013, 49, 7243–7245 RSC.
- B. Mateescu, L. Batista, M. Cardon, T. Gruosso, Y. De Feraudy, O. Mariani, A. Nicolas, J.-P. Meyniel, P. Cottu and X. Sastre-Garau, Nat. Med., 2011, 17, 1627–1635 CrossRef CAS.
- S. Wang, B. Fu, J. Wang, Y. Long, X. Zhang, S. Peng, P. Guo, T. Tian and X. Zhou, Anal. Chem., 2014, 86, 2925–2930 CrossRef CAS.
- T. Tian, H. Xiao, Z. Zhang, Y. Long, S. Peng, S. Wang, X. Zhou, S. Liu and X. Zhou, Chem.–Eur. J., 2013, 19, 92–95 CrossRef CAS.
- Y. Li, J. Zhang, J. Zhao, L. Zhao, Y. Cheng and Z. Li, Analyst, 2016, 141, 1071–1076 RSC.
- Q. Wang, B.-C. Yin and B.-C. Ye, Biosens. Bioelectron., 2016, 80, 366–372 CrossRef CAS.
- Y. Xie, X. Lin, Y. Huang, R. Pan, Z. Zhu, L. Zhou and C. J. Yang, Chem. Commun., 2015, 51, 2156–2158 RSC.
- Z. Lichner, A. Fendler, C. Saleh, A. N. Nasser, D. Boles, S. Al-Haddad, P. Kupchak, M. Dharsee, P. S. Nuin, K. R. Evans, K. Jung, C. Stephan, N. E. Fleshner and G. M. Yousef, Clin. Chem., 2013, 59, 1595–1603 CrossRef CAS.
- A. W. Tong, P. Fulgham, C. Jay, P. Chen, I. Khalil, S. Liu, N. Senzer, A. C. Eklund, J. Han and J. Nemunaitis, Cancer Gene Ther., 2009, 16, 206–216 CrossRef CAS.
- S. Wach, E. Nolte, J. Szczyrba, R. Stöhr, A. Hartmann, T. Ørntoft, L. Dyrskjøt, E. Eltze, W. Wieland, B. Keck, A. B. Ekici, F. Grässer and B. Wullich, Int. J. Cancer, 2012, 130, 611–621 CrossRef CAS.
Footnote |
| † Electronic supplementary information (ESI) available. See DOI: 10.1039/d0ra09237a |
| This journal is © The Royal Society of Chemistry 2021 |

