 Open Access Article
Research on the mechanisms of polyacrylamide nanospheres with different size distributions in enhanced oil recovery
Shuo Wanga,
Zhongli Tangb,
Jin Qua,
Tongbo Wub,
Yuxing Liua,
Jing Wanga,
Xiaofei Liu *a,
Ye Juc and
Fenggang Liuc
aDepartment of Materials Science and Engineering, Tianjin University, No.135, Yaguan Road, Jinnan District, Tianjin 300350, China. E-mail: liuxf315@aliyun.com; Fax: +86 285356417; Tel: +86 18802202697
bDepartment of Chemical Engineering and Technology, Tianjin University, No.135, Yaguan Road, Jinnan District, Tianjin 300350, China
cChina Oilfield Services Limited, No.1581, Haichuan Road, Binhai New District, Tianjin 300459, China
First published on 2nd February 2021
Abstract
Crosslinked polyacrylamide microspheres are widely used as in-depth flooding agents in petroleum development due to their unique properties of thickening, salt-resistance, high-temperature resistance, low cost, etc. To solve the problem of their injections in heterogeneous reservoirs, polyacrylamide nanospheres were synthesized. However, mechanisms of polymer nanospheres in enhanced oil recovery were not investigated comprehensively. In this study, we synthesized polymer nanospheres with different size distributions and studied their mechanisms in enhancing the oil recovery. First, the effects of polyacrylamide nanospheres in enhanced oil recovery of heterogeneous sand-packed tubes was explored by sand-packed tube oil displacement experiments. Second, the rheological properties of polyacrylamide nanosphere dispersion were explored using a rheometer. Third, through the visual microchannel experiment, the mechanism of polymer nanosphere emulsion on the removal of the residual oil film was explored. Finally, through the crude oil removal experiment, it was found that polymer nanospheres with a particle size of about 54 nm can cooperate with surfactants to accelerate the removal of oil droplets.
Introduction
There is a noticeable increasing demand for oil because it is still the most powerful energy source in the world. Among the available conventional resources, the amount of oil recovered in situ is about 30%. Therefore, enhanced oil recovery (EOR) needs to be developed. At present, the heterogeneity of reservoirs is one of the important reasons that hinders the further improvement of oil recovery.1The reservoir heterogeneity is a serious issue, which causes water to go around small pores and low permeability layers, and then flow along large pores and high permeability layers. Therefore, the remaining oil in low permeability layers cannot be exploited and a valid water cycle cannot be formed.2,3 The profile control technology expands the sweep efficiency of the injected fluid by plugging high permeability layers.4,5 Colloidal dispersion gel,6 weak gel,7 foam,8 alkaline soil,9 oily sludge,10 and microbial,11 have been proposed for the same. In order to further improve the deep profile control technology, scholars have put forward the application of polymer microspheres for deep profile control and flooding. Polymer microspheres, which possess the characteristics of migration, plugging, remigration, and re-plugging, can effectively plug water channelling and reduce water cut in heterogeneous reservoirs.12–14 Simultaneously, these microspheres have excellent characteristics such as thickening properties, salt-resistance, high-temperature resistance, and low cost.15–17 There are numerous studies on the migration and plugging mechanisms of polymer microspheres.18–21 However, a contradiction was found between the injection and plugging performance in the microsphere profile control technology. To solve this problem, polyacrylamide nanospheres were proposed as a solution. Yu et al.22 synthesized heat and salt-resistant amphiprotic polyacrylamide microspheres via inverse microemulsion polymerization. Compared with the initial diameter of 50 nm, the average diameter of the microspheres increased up to 634 nm after aging for 7 days at 90 °C in synthetic brine. Hua et al. synthesized and studied the clogging characteristics and morphology control mechanism of polyacrylamide nanospheres.23
Polymer nanospheres have a good effect on EOR. Polymer nanospheres have been applied to low-permeability oilfields in China and have shown good applicability in CNPC Changqing Oilfield. According to Changqing's 2017–2018 statistics, polymer nanospheres were used in 3807 well times, corresponding to a cumulative oil increase of 419![[thin space (1/6-em)]](https://www.rsc.org/images/entities/char_2009.gif) 401 tons and cumulative precipitation of 464
401 tons and cumulative precipitation of 464![[thin space (1/6-em)]](https://www.rsc.org/images/entities/char_2009.gif) 396 m3. In addition to the traditional migration and plugging mechanisms of polymer microspheres, the contribution of other mechanisms to the excellent effects of polymer nanospheres is the focus of attention.
396 m3. In addition to the traditional migration and plugging mechanisms of polymer microspheres, the contribution of other mechanisms to the excellent effects of polymer nanospheres is the focus of attention.
Nanofluid is one of the emerging technologies to improve oil displacement efficiency.24,25 A series of oil drop removal experiments have found that high concentrations of sodium lauryl sulphate micelles or silica nanoparticles can lead to the formation of aqueous films between rapeseed oil drops and the solid surface, which facilitates the separation of the oil drops from the solid surface.26–29 Zhao et al. found that the synergy between 0.1 wt% silica nanoparticles and 0.1 wt% non-ionic surfactant TX-100 resulted in a higher oil recovery compared with only 0.1 wt% TX-100.30 Bila et al. used polymer-coated silica nanoparticles to improve the oil recovery from 2.6% to 5.2% by reducing the interfacial tension.31 In addition, some studies have found that silica nanofluids can change the core surface from oil-wet to water-wet, thus increasing the number of capillaries and enhancing oil recovery.32 Besides Maurya and Mandal pointed out that nanoparticles can stabilize surfactant emulsions and obtain better rheological properties.33 However, the research objects of the above studies are all inorganic nanoparticles. To the best of our knowledge, the effects of the polyacrylamide nanosphere emulsion on the removal of crude oil from rock pores and the function of polyacrylamide nanospheres and surfactants in emulsion have not been studied yet.
This paper will synthesize polymer nanospheres with different size distributions and investigate the mechanisms of polymer nanospheres in enhanced oil recovery.
Materials and methods
Materials
Acrylamide (AM), 2-acrylamide-2-methylpropane sulfonic acid (AMPS), and methylene-bis-acrylamide (MBA), ammonium persulfate ((NH4)2S2O8), sodium bisulphite (NaHSO3) were provided by Shanghai Aladdin Biochemical Technology Co., Ltd. Sodium dodecyl sulphate (SDS), kerosene, sorbitol fatty acid ester (Span-80) and alkylphenol polyoxyethylene ether (TX-10) were provided by Tianjin Jiangtian Chemical Co., Ltd. Sodium fluorescein was provided by Tianjin Yuanli Chemical Co., Ltd. Crude oil was provided by the Institute of Oil & Gas Technology Research of PetroChina Changqing Oilfield Company and had a density of 0.853 g cm−3 and a viscosity of 53 mPa s at 50 °C. The T-shaped microchannel, made of an acrylic material with a 200 ± 10 μm inner diameter, was provided by Tianjin Shuangtuo Technology Co., Ltd. The simulated oil used in the flooding experiment was prepared with kerosene and crude oil at a ratio of 5![[thin space (1/6-em)]](https://www.rsc.org/images/entities/char_2009.gif) :
:![[thin space (1/6-em)]](https://www.rsc.org/images/entities/char_2009.gif) 1.
1.
Synthesis and purification
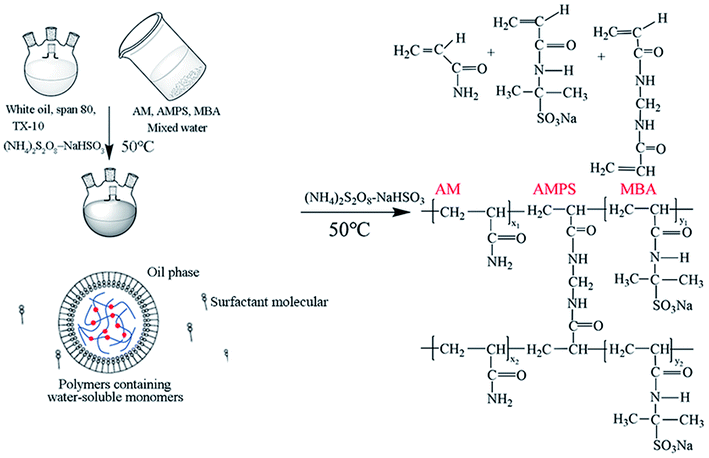
Fig. 1 shows the preparation flow chart and structural formula of polymer nanospheres. Span-80 and TX-10 were dissolved at a known ratio in white oil. Monomer AM, AMPS, MBA, and NaOH were dissolved in water. Then, the oil phase was stirred at 350 rpm, and the water phase was slowly added dropwise to form a water-in-oil system. In this experiment, polymerization was initiated by an (NH4)2S2O8–NaHSO3 redox system. The temperature of the water bath was set to 50 °C for 3 h. Finally, a polyacrylamide nanosphere emulsion was obtained.The emulsion was added to ethanol at a volume ratio of 1![[thin space (1/6-em)]](https://www.rsc.org/images/entities/char_2009.gif) :
:![[thin space (1/6-em)]](https://www.rsc.org/images/entities/char_2009.gif) 14 and mixed well to remove any remaining surfactant and other substances to obtain the polyacrylamide nanosphere powder. After stirring for 30 min, a white nanosphere cake was obtained via suction filtration. Then, the obtained filter cake was washed twice with ethanol. Finally, the wet filter cake was fully dried to obtain the solid powder of polyacrylamide nanospheres.
14 and mixed well to remove any remaining surfactant and other substances to obtain the polyacrylamide nanosphere powder. After stirring for 30 min, a white nanosphere cake was obtained via suction filtration. Then, the obtained filter cake was washed twice with ethanol. Finally, the wet filter cake was fully dried to obtain the solid powder of polyacrylamide nanospheres.
Preparation of nanofluids
A polyacrylamide nanosphere emulsion (0.5 g) was dispersed in distilled water (100 g). Mechanical stirring and ultrasonic dispersion were used to disperse the nanoparticles evenly. Then, the dispersion was placed at 50 °C for 5 days to obtain a swelled nanoparticle dispersion.Observation with TEM
The solid powder of polyacrylamide nanospheres was ultrasonically dispersed in ethanol for 5 min, and 0.5 μL ethanol dispersed system of the solid powder was dropped on copper meshes. After the sample was dried, it was observed using a TEM Jem-2100f manufactured by Japan Electronics.Laser particle size analysis
The polyacrylamide nanosphere emulsion was dispersed into n-hexane to get the initial particle size. Also, the nanofluid was diluted in distilled water to obtain the swelling particle size. The size distribution of the nanospheres was investigated using a Nano-ZS90 analyzer produced by the Malvern company (UK) based on laser diffraction. This analysis was performed under a constant temperature (25 °C) with He–Ne lasers at 630 nm.Interfacial tension tests
The interfacial tensions of nanofluids and kerosene were measured with an OCA15EC interfacial tension metre produced by the Dataphysics company (GER).Rheological properties
The shear rate was set at 0.01–100 s−1 and increased in a logarithmic mode. The data points were obtained in a stable state. The rheological properties of the samples were tested using an MCR302 rheometer made by Anton Paar company.Sand packed tube displacement experiment
The sand packed tube displacement experiments were carried out as described in ref. 33. The experiments were carried out at approximately 50 °C and the flow was 0.50 mL min−1 when the oil-, water- and nanosphere-flooding occurred. The tubes used were 60 cm long. The crude oil with a viscosity of 53 mPa s at 50 °C and the water at pH 7.5 were used in the experiment. Throughout the experiment, the sand packed tubes were first saturated with crude oil and water was injected until the water-cut was 98%; then, the known injection volume of nanofluid was injected, and finally, only water was injected.Microchannel oil displacement experiment
A T-shaped microchannel model was used in the experiment. After filling it with simulated oil, the water inlet and outlet of the main channel were opened, and the branch channel was blocked. Then, the injected nanofluid, placed on a 50 °C thermo-stated water bath was put in the left side of the main pipe via a peristaltic pump and flowed out on the right side of the main pipe. As the time increased, the water-oil suspension flew out through the main channel outlet. During the experiment, the oil displacement process was observed and recorded using a microscope. The flow rate of water in the peristaltic pump was set at 1 mL h−1.Crude oil removal experiment
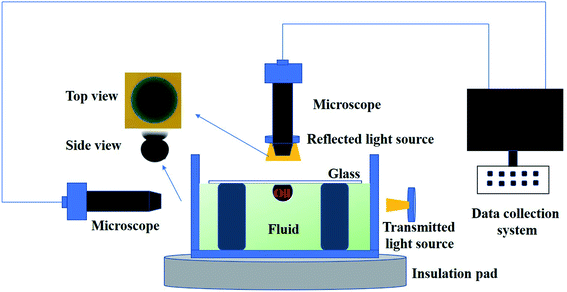
The same experiments were carried out with two experimental groups: one experimental group contained 6 mmol L−1 SDS (below the critical micelle concentration), and the other group contained 6 mmol L−1 SDS and 1 wt‰ polyacrylamide nanosphere solid powder. To more effectively observe the oil drop removal (in top view), a little amount of sodium fluorescein was added into the water dispersion.The crude oil removal experiment device is shown in Fig. 2. The crude oil removal experiment device was built by following the procedure in ref. 27. In this experiment, crude oil was deposited on a glass plate and placed upside down in the polyacrylamide nanosphere water dispersion. The temperature was maintained at approximately 50 °C by placing a heating device below the fluid. Top and side views of the crude oil were obtained through a microscope placed above and to the left of the oil drops to monitor the process of the crude oil removal from the surface. The image analysis software (Imageview) was utilized to analyse the obtained images, changes in the position of the contact line and the shape of the crude oil with time were also obtained. A pixel/length calibration was performed using a known length. A plot of the position of the contact line over time was plotted. Each experiment was repeated three times.
Results and discussion
Conformation and size of the polyacrylamide nanospheres
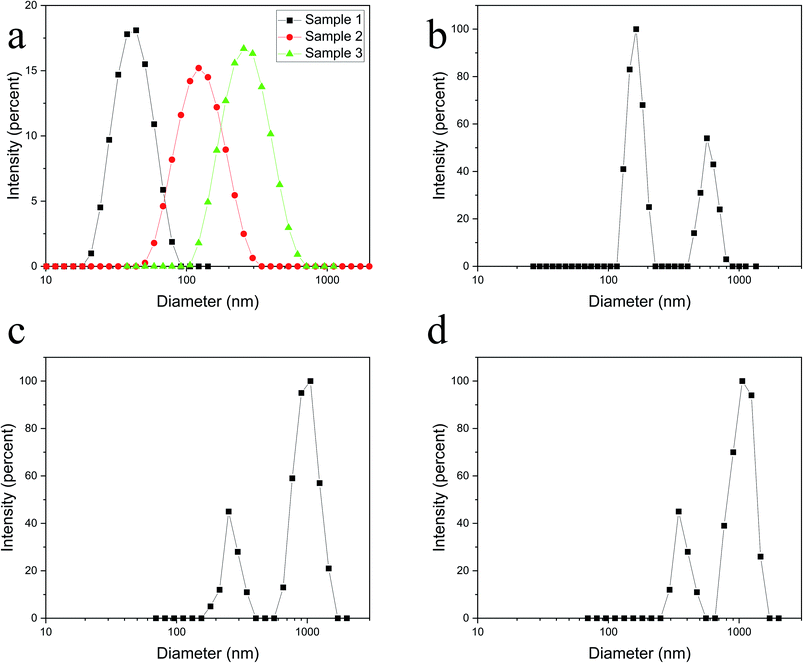
Fig. 3 shows the morphology of the polymer nanospheres under TEM and illustrates that nanospheres had a heterogeneous size distribution. Spherical shapes were observed in the nanosphere solid powder. Adhesion and agglomeration of the nanospheres were observed due to the surface effect of nanoparticles and Brownian motion. Fig. 4a shows the initial particle size distribution of the three samples dispersed in n-hexane. The particle sizes of the three samples were different. The average particle diameters of the three samples were 54, 93, and 295 nm, respectively.Fig. 4b–d show the particle size distributions of polyacrylamide nanospheres swelled in water for 5 days. There are two peaks in each particle size distribution graph, which indicate that the particle size of the swelled polyacrylamide nanospheres is classified. As the nanospheres hydrated and expanded, some adjacent nanospheres gradually fused to form multiple agglomerated polymer microsphere particles at the micrometre level.
Oil displacement effect of polymer nanospheres
To investigate the displacement effects of the polymer nanospheres, a heterogeneous double-tube sand pack model was used in the oil displacement experiments. Table 1 provides the key parameters of sand pack models. Because the injected water preferentially flowed along the high permeability path, the oil recovery of the high permeability path was much higher than the low permeability path. This result shows that a large amount of crude oil still remained in the low permeability tube, which could not be driven out. Simultaneously, remaining crude oil in the high permeability tube still adhered to the rock surface. For the oil displacement experiment of sample 1, the oil recovery was 68.46% for the high permeability model and 58.38% for the low permeability model after injecting 3.5 PV water. When 0.5 PV of polymer nanospheres at 5000 mg L−1 was injected, the oil recovery of the high permeability tube was enhanced by 24.38%, while the oil recovery of the low permeability tube was enhanced by 23.09%. This indicated that the polymer nanospheres could plug the high permeability tube, reduce its permeability, and change the direction of the injected water during the water flooding stage after injecting polymer nanospheres. Simultaneously, the residual oil of the high permeability tube was further driven out, which showed that the polymer nanosphere emulsion could also improve the displacement efficiency. As shown in Fig. 5 and Table 1, the displacement effect of polymer nanospheres was also different for different particle sizes. Sample 1 had the highest EOR for the high permeability tube. However, for the low permeability tube, sample 2 had a better displacement effect, which may be related to the plugging performance.| Sample no. | Sank pack type | Porosity (%) | Permeability (μm2) | Initial oil saturation (%) | RW (%) | RT (%) | EOR (%) |
|---|---|---|---|---|---|---|---|
| 1 | High-permeability tube | 38.96 | 2.82 | 80.15 | 51.97 | 76.35 | 24.38 |
| 1 | Low-permeability tube | 40.31 | 0.29 | 79.05 | 28.35 | 51.44 | 23.09 |
| 2 | High-permeability tube | 39.45 | 2.95 | 81.32 | 54.29 | 70.07 | 15.78 |
| 2 | Low-permeability tube | 41.90 | 0.33 | 78.56 | 22.94 | 50.80 | 27.86 |
| 3 | High-permeability tube | 37.95 | 2.89 | 82.13 | 50.19 | 67.36 | 17.17 |
| 3 | Low-permeability tube | 42.30 | 0.31 | 80.42 | 29.05 | 51.23 | 22.18 |
Mechanism
When the shear rate was low, the network structure moved as a whole. Therefore, the viscosity of the system decreased steadily. When the shear rate was increased above the CSR (Critical Shear Rate; above the rate, the rheological properties of the dispersed system changed from shear-thinning to shear thickening), the network structure was destroyed, the flow resistance was reduced; however, the fluid still showed shear-thinning behavior. Therefore, when the shear rate was 0.1–1 s−1, the apparent viscosity fluctuated sharply. With further increase in the shear rate, the nanospheres in the dispersion system showed two behaviours: first, the nanospheres overcame the Brownian motion to be oriented, and second, the microspheres aggregated. Finally, when these two behaviours were balanced, the apparent viscosity stabilized at 1 mPa s or exhibited the shear-thickening behaviour when the nanospheres aggregated further.34
It can be found that the rheological behaviour was different among the nanospheres with varying particle sizes. Sample 2 had the highest viscosity at a low shear rate, followed by sample 1, and sample 3 having the lowest viscosity. This phenomenon was determined by two factors: the volume and surface characteristics of the polymer nanospheres. From the perspective of the volume of polymer nanospheres, the dispersion system with larger particle size had good deformability and was easier to form a three-dimensional network structure, which leads to an increase in the viscosity.34 Therefore, the viscosity of the dispersion of sample 2 was the largest. However, from the perspective of the surface characteristics of nanospheres, when the particle size reaches the nanometer scale, particularly when it is much smaller than 100 nm, the fluid viscosity increases significantly. This phenomenon can be explained as follows: the viscosity of the liquid is mainly caused by the interaction force between the micelles. According to the calculation by Keblinski et al.,35 at the same concentration, as the particle size decreases, the particle spacing is greatly reduced. Simultaneously, the surface force between the particles increases sharply, and the entire suspension system forms a grid-like structure due to the mutual restraint of the forces between the particles, which leads to an increase in the viscosity in the system. This structure is more obvious at high concentrations. Therefore, for sample 1 and sample 2, as the particle concentration increases, the viscosity of the system becomes significantly larger. As shown in Fig. 7, this rheological property could expand the swept volume and improve the oil displacement effects of the low permeability tube.
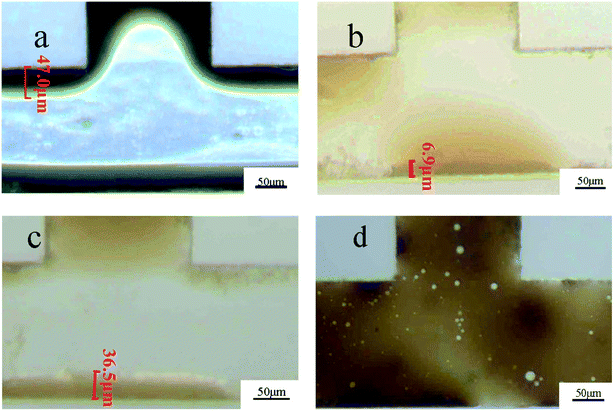 | ||
| Fig. 8 The residual oil displacement phenomenon of polymer nanospheres in the microchannels ((a) water, (b) sample 1, (c) sample 2, (d) sample 3). | ||
| Sample | Interfacial tension (mN m−1) | Density (g cm−3) | Oil film thickness (μm) |
|---|---|---|---|
| Water | 25.47 ± 0.036 | 0.9982 ± 0.00008 | 47.0 ± 0.14 |
| Sample 1 | 13.42 ± 0.036 | 0.9984 ± 0.00008 | 6.9 ± 0.08 |
| Sample 2 | 12.11 ± 0.029 | 0.9983 ± 0.00014 | 36.5 ± 0.08 |
| Sample 3 | 10.89 ± 0.029 | 0.9981 ± 0.00008 | Too thin to be measured |
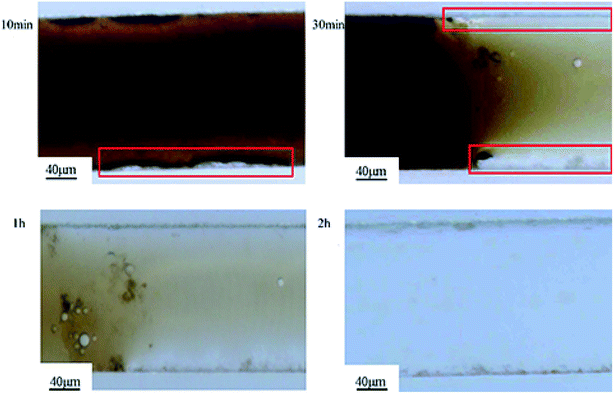
Fig. 9 shows the deposition and agglomeration of polymer nanospheres on the surface of the microchannel in the flooding process of sample 1. The phenomena of the other two samples were similar. The microchannel was made of an oleophobic organic glass. However, in the process of oil displacement, a layer of polyacrylamide nanospheres was reunited and attached to the wall surface, which made the oil no longer adhere to the wall by capillary force. The change in wettability further improved the oil displacement efficiency. Combined with the experimental results of sand pack model oil displacement tests, it could be found that the addition of polymer nanosphere emulsion could enhance oil recovery by reducing interfacial tensions and changing the wettability.
The synergy between polymer nanospheres and surfactants for EOR
Fig. 10 shows the processes of crude oil removal experiment experiments.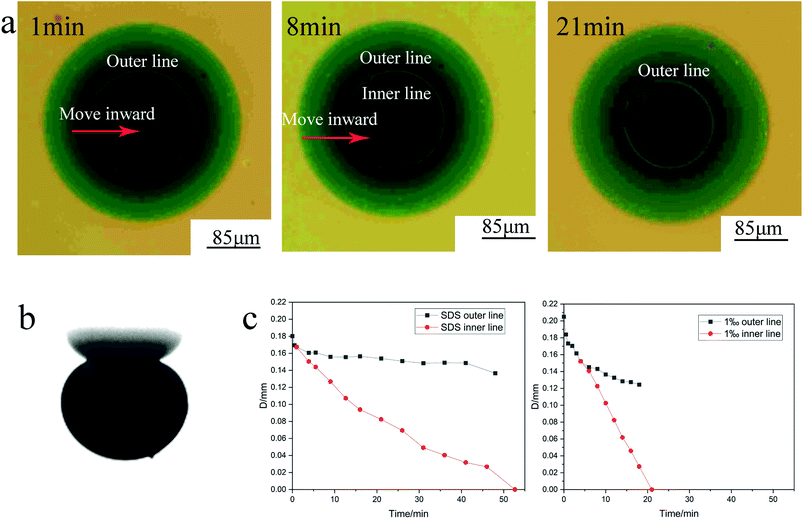 | ||
| Fig. 10 The processes of crude oil removal experiments ((a) top view of optical microscope, (b) side view of optical microscope, (c) graph depicting the position of contact line with time). | ||
As observed in the side view, the formation of oil drop occurred quickly due to the low interfacial tension caused by the surfactant, as shown in Fig. 10b. Fig. 10a shows that outer and inner contact lines appeared between the oil drops and the glass plate. A water film emerged between the outer contact line and the inner contact line, which could not be observed from the side view. Simultaneously, there was a white ring inside the inner contact line. Direct contact of the crude oil with the glass plate contact occurred in the innermost black area. With the increase in time, both the outer contact line and the inner contact line gradually moved inward; the inner contact line moved faster than the outer contact line, which gradually increased the water film area, and finally, the oil drop was separated from the glass plate by a layer of water. Therefore, the polyacrylamide nanosphere emulsion promoted the removal of crude oil through the formation of a water film between the oil drops and the glass plate.
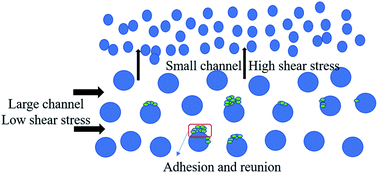
For comparison, one group containing only 6 mmol L−1 SDS (below the critical micelle concentration), and other group containing 6 mmol L−1 SDS and 1 wt% polyacrylamide nanosphere solid powder were set. In this experiment, the inner and outer contact lines between the oil drop and the glass plate both appeared in the two experimental groups. Fig. 10c illustrates the change in the contact line with time for the two experimental groups. The 6 mmol L−1 SDS solution required 52.65 min to remove the oil drop, while the 6 mmol L−1 SDS solution with 1 wt% polyacrylamide nanosphere solid powder was able to remove the oil drop after 21 min. Polyacrylamide nanospheres, therefore, had a significant acceleration effect on the oil drop removal. The acceleration mechanism of the oil drop removal by polyacrylamide nanospheres is related to the rate at which the water film is formed. As shown in Fig. 11, the inner contact line of the crude oil drop in the 1 wt% polyacrylamide nanosphere water dispersion moved significantly faster than the inner contact line of the 6 mmol L−1 SDS solution. The SDS concentrations of the two groups were the same, and the rate at which the water film advanced was solely related to the polyacrylamide nanospheres. This indicated that polyacrylamide nanospheres played an important role in the internal contact line, which was the three-phase contact line of water, oil, and solid. This acceleration may depend on the structural disjoining pressure of the polyacrylamide nanoparticles.
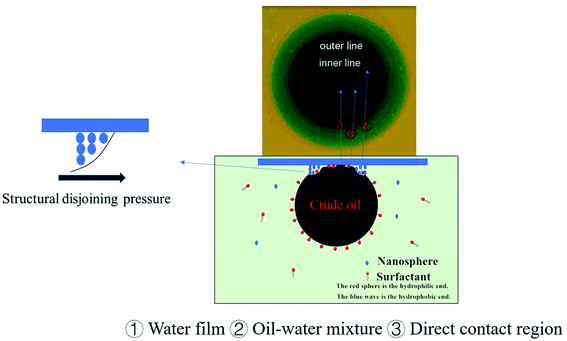 | ||
| Fig. 11 Schematic of the residual oil displacement mechanism of crude oil detachment from glass plates. | ||
Conclusions
The addition of polymer nanosphere emulsion can enhance the oil recovery in the heterogeneous packed tube, and the effect is related to the particle size. The oil displacement mechanisms of polymer nanospheres include the following aspects: first, the shear viscosity of polymer nanospheres changes significantly with the shear rate, which could adjust the water inflow in the hypertonic tube and the hypotonic tube, and sample 2 with an average particle size of 93 nm worked best. Second, polymer nanospheres can change the wettability of the channel surface through deposition and adsorption to improve the oil displacement efficiency. Finally, the polymer nanospheres with a particle size of about 54 nm and surfactants had a synergistic effect, which accelerated the removal of crude oil from the solid surface.Conflicts of interest
There are no conflicts to declare.Acknowledgements
This work was financially funded by China Oilfield Services Limited (G1917B-1120T046).References
- Z. K. Xiao, W. L. Ding, S. Y. Hao, A. D. Taleghani, X. Y. Wang, X. H. Zhou, Y. X. Sun, J. S. Liu and Y. Gu, J. Pet. Sci. Eng., 2019, 182, 11 CrossRef.
- C. L. Zhang, G. D. Qu and G. L. Song, Int. J. Anal. Chem., 2017, 2017, 9 Search PubMed.
- X. C. Chen, Q. H. Feng, W. Liu and K. Sepehrnoori, Fuel, 2017, 194, 42–49 CrossRef CAS.
- Y. F. Liu, C. L. Dai, K. Wang, M. W. Zhao, M. W. Gao, Z. Yang, J. C. Fang and Y. N. Wu, Ind. Eng. Chem. Res., 2016, 55, 6284–6292 CrossRef CAS.
- G. Zhao, C. L. Dai and M. W. Zhao, PLoS One, 2014, 9, 10 Search PubMed.
- H. L. Chang, X. Sui, L. Xiao, Z. Guo, Y. Yao, Y. Xiao, G. Chen, K. Song and J. C. Mack, SPE Reservoir Eval. Eng., 2006, 9, 664–673 CrossRef CAS.
- W. U. Ruikun, K. Wanli, M. Lingwei, W. U. Xiaoyan and C. A. I. Xiaojun, J. Northeast Norm. Univ., 2011, 43, 97–100 Search PubMed.
- A. Haugen, M. A. Ferno, A. Graue and H. J. Bertin, SPE Reservoir Eval. Eng., 2012, 15, 218–228 CrossRef.
- Z. Shousong, G. U. O. Jianjun, L. I. U. Qingwang and Z. Bai, J. Oil Gas Technol., 2011, 33, 124–128 Search PubMed.
- X. Luo, H. Gong, Z. He, P. Zhang and L. He, J. Hazard. Mater., 2020, 399 DOI:10.1016/j.jhazmat.2020.123137.
- M. Bao, T. Liu, Z. Chen, L. Guo, G. Jiang, Y. Li and X. Li, Energy Sources, Part A, 2013, 35, 2141–2148 CrossRef CAS.
- C. Yao, D. Wang, J. Wang, J. Hou, G. Lei and T. Steenhuis, Ind. Eng. Chem. Res., 2017, 56, 8158–8168 CrossRef CAS.
- Z. Wang, M. Lin, S. Jin, Z. Yang, Z. Dong and J. Zhang, J. Dispersion Sci. Technol., 2020, 41, 267–276 CrossRef CAS.
- H. Yang, W. Kang, X. Tang, Y. Gao, Z. Zhu, P. Wang and X. Zhang, J. Dispersion Sci. Technol., 2018, 39, 1808–1819 CrossRef CAS.
- H. Frampton, J. C. Morgan, S. K. Cheung, L. Munson, K. T. Chang and D. Williams, Presented in part at the SPE/DOE Symposium on Improved Oil Recovery, Tulsa, Oklahoma, 2004/1/1, 2004 Search PubMed.
- K. Bybee, J. Pet. Technol., 2005, 57, 71–72 Search PubMed.
- A. Zaitoun, R. Tabary, D. Rousseau, T. R. Pichery, S. Nouyoux, P. Mallo and O. Braun, Presented in part at the International Symposium on Oilfield Chemistry, Houston, Texas, U.S.A., 2007/1/1, 2007 Search PubMed.
- H. Wang, M. Lin, D. Chen, Z. Dong, Z. Yang and J. Zhang, Powder Technol., 2018, 331, 310–321 CrossRef CAS.
- X. Nie, J. Chen, Y. Cao, J. Zhang, W. Zhao, Y. He, Y. Hou and S. Yuan, Polymers, 2019, 11, 1993 CrossRef CAS.
- X. Shi and X. a. Yue, J. Pet. Sci. Eng., 2020, 184, 106458 CrossRef CAS.
- B. Wang, M. Lin, J. Guo, D. Wang, F. Xu and M. Li, J. Appl. Polym. Sci., 2016, 133(30) DOI:10.1002/app.43666.
- Z. Yu, Y. Li, O. Sha, Z. Su and W. Zhou, J. Appl. Polym. Sci., 2016, 133 DOI:10.1002/app.43366.
- Z. Hua, M. Lin, Z. Dong, M. Li, G. Zhang and J. Yang, J. Colloid Interface Sci., 2014, 424, 67–74 CrossRef CAS.
- S. Liang, X. R. Deng, Y. Chang, C. Q. Sun, S. Shao, Z. X. Xie, X. Xiao, P. A. Ma, H. Y. Zhang, Z. Y. Cheng and J. Lin, Nano Lett., 2019, 19, 4134–4145 CrossRef CAS.
- P. S. Liu, L. Y. Niu, X. H. Tao, X. H. Li, Z. J. Zhang and L. G. Yu, Appl. Surf. Sci., 2018, 447, 656–663 CrossRef CAS.
- K. Kondiparty, A. D. Nikolov, D. Wasan and K.-L. Liu, Langmuir, 2012, 28, 14618–14623 CrossRef CAS.
- K.-L. Liu, K. Kondiparty, A. D. Nikolov and D. Wasan, Langmuir, 2012, 28, 16274–16284 CrossRef CAS.
- A. Nikolov, K. Kondiparty and D. Wasan, Langmuir, 2010, 26, 7665–7670 CrossRef CAS.
- D. T. Wasan and A. D. Nikolov, Nature, 2003, 423, 156–159 CrossRef CAS.
- P. Jiang, N. Li, J. Ge, G. Zhang, Y. Wang, L. Chen and L. Zhang, Colloids Surf., A, 2014, 443, 141–148 CrossRef CAS.
- A. Bila, J. Å. Stensen and O. Torsæter, Nanomaterials, 2019, 9(6), 822 CrossRef CAS.
- H. Zhou, Q. Zhang, C. Dai, Y. Li, W. Lv, Y. Wu, R. Cheng and M. Zhao, Chem. Eng. Sci., 2019, 201, 212–221 CrossRef CAS.
- N. K. Maurya and A. Mandal, Chem. Eng. Res. Des., 2018, 132, 370–384 CrossRef CAS.
- H. Y. Wang, M. Q. Lin, D. N. Chen, Z. X. Dong, Z. H. Yang and J. Zhang, Powder Technol., 2018, 331, 310–321 CrossRef CAS.
- P. Keblinski, S. R. Phillpot, S. U. S. Choi and J. A. Eastman, Int. J. Heat Mass Transfer, 2002, 45, 855–863 CrossRef CAS.
| This journal is © The Royal Society of Chemistry 2021 |

