 Open Access Article
First principle studies of ammonium chloride under high pressure
Mengya Lua,
Fubo Tian *a,
Qiang Zhoua and
Tian Cui
 *ab
*ab
aState Key Laboratory of Superhard Materials, College of Physics, Jilin University, Changchun 130012, People's Republic of China. E-mail: tianfb@jlu.edu.cn
bInstitute of High Pressure Physics, School of Physical Science and Technology, Ningbo University, Ningbo 315211, China. E-mail: cuitian@nbu.edu.cn
First published on 28th January 2021
Abstract
We performed a thorough high-pressure structural exploration of ammonium chloride up to 300 GPa by ab initio calculations. Two new phases, namely, P21/m and Cmma, were predicted to be stable within the pressure ranges of 71–107 and 107–300 GPa, respectively. Like the known phase IV and V, the two new phases preserve alternate ammonium and chloride ions layer structures. The Bader charge analysis indicated that the numbers of electrons that N atoms get abruptly increased in the P21/m phase. We also calculated the band gap and the variations in interatomic distances with pressure, and found the band gaps of two new phases decrease with increasing pressure and do not close up to 300 GPa.
Introduction
The high-pressure behavior of hydrogen-rich compounds is of great importance because of its role in high-temperature superconductors, such as H3S,1,2 CaH6,3 YH10,4 and LaH10.5 The high superconducting transition temperatures (Tc) of H3S (ref. 6) (200 K) and LaH10±x (ref. 7) (260 K) were confirmed experimentally. In this regard, scholars have focused on searching for other hydrogen-rich compounds. Ammonium halides, a vital family of hydrogen-rich compounds and potential candidate for high-temperature superconductors, have gained increasing attention because of their abundant transitions caused by relative orientations of ammonium ions.8 Moreover, research on structure has been a hot topic because it is essentially related to superconducting properties.Extensive theoretical and experimental efforts have been made to clarify the crystal structures of ammonium halides. The pressure–temperature phase diagrams of ammonium halides was determined at low pressure levels.9–11 Thus far, NH4Cl exists in four phases, namely, phase I (a disordered NaCl structure), phase II (a disordered CsCl structure), phase IV (an ordered CsCl structure), and phase V (a slightly distorted tetragonal CsCl structure). An ordered phase III only exists in NH4Br12,13 and NH4I.9,11,14 Moreover, we determined the structures of NH4I and the related phase transitions at high pressure levels by using ab initio calculations,15 and found that phase V is stable up to 74 GPa, at which ammonium iodine dissociates into NH3, H2, and I2. Our group12 also discovered that the phase V of NH4Br transforms into monoclinic phase P21/m at 71 GPa and to orthorhombic structure Cmma at 130 GPa. Although a large number of experiments for NH4Cl were conducted, few studies have focused on its structure at high pressure levels.
In 1922, Simon16 discovered the abnormal behavior of ammonium chloride, wherein it has a sharp transition in specific heat at −30 °C and ambient pressure. This phenomenon is called λ-type phase transition17–20 or first-order transition. In addition, tricritical phase transition (TC = 257 K) and second-order phase transition (TC = 267 K) exist at 1.6 kbar (ref. 21–23) and 2.8 kbar, respectively.24 We focused more on λ-type phase transition because it occurs not only in simple ammonium salts but also in some antiferromagnetic materials25,26 and solid hydrogen.27 Furthermore, many physical properties, such as coefficient of thermal expansion,28,29 piezoelectric effect,30,31 and dielectric constant,32 vary sharply at the critical point. To investigate the nature of phase transition, scholars have made a great deal of effort experimentally33–43 and theoretically.44,45 The mechanism of order–disorder phase transition has been attributed to two possible orientations of ammonium tetrahedrons.46
At room temperature and low pressure, NH4Cl adopts a CsCl-type structure (phase II), in which NH4+ ions are randomly distributed between two energetically equivalent orientations. When pressure is applied at room temperature, NH4Cl transforms to phase IV,42 which is referred to as ferro-ordered phase analogous to a ferro-magnet with parallel spin orientation of NH4+ between 9 and 10 kbar; this phase then transitions into phase V,47 which has been proven in preliminary Raman measurements to exist in NH4Cl at pressure levels higher than 110 kbar. To our knowledge, structures at high pressure or electronic properties have remained unexplored and are of great interest in research on NH4Cl.
Computational methods
To search potential stable structures within the pressure range of 0–300 GPa, we used evolutionary algorithm methodology48–53 implemented in the USPEX code, which has been applied successfully to a wide range of crystalline systems. The simulation cell comprised of 1 to 4 formula units. The first generation consisting of 100 structures was generated randomly, and 60% of its low-energy structures were passed on to the next generation. The process was terminated after 40 generations. We then optimized the structures by using density-functional theory (DFT) with projector augmented wave (PAW) method54 in the Vienna ab initio simulation package (VASP) code.55 Local density approximation was used to describe the exchange–correlation function. To ensure that the total energy is well-converged to higher than 1 meV per atom, we chose a cut-off energy of 900 eV and Monkhorst–Pack k-points meshes56 with a reciprocal space resolution of 2π × 0.03 Å−1. Phonon dispersion calculations were performed with the PHONOPY code,57 which is based on a supercell approach58 with force constant matrices. The supercell consisting of 144 atoms of 2 × 2 × 3 for P4/nmm and Cmma, 3 × 2 × 2 for P21/m were used for the calculations.Results and discussion
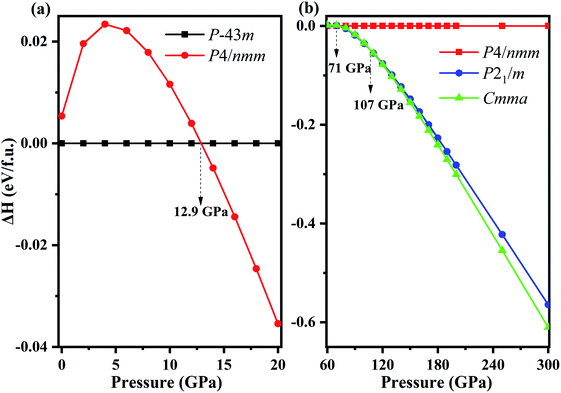
Fixed-composition structure prediction simulations were performed using the USPEX code considering unit cell sizes from 1 to 4 formula units for NH4Cl up to 300 GPa. We discovered two novel structures with space groups P21/m and Cmma for the first time. We calculated the enthalpy difference of phase V (P4/nmm) from 0 to 20 GPa with respect to phase IV (P![[4 with combining macron]](https://www.rsc.org/images/entities/char_0034_0304.gif) 3m) as a function of pressure (Fig. 1a). Fig. 1b shows the enthalpy difference of the two new phases relative to phase V within the pressure range of 60–300 GPa. Phase IV and V were repeatedly confirmed experimentally.42,47,59,60 As shown in Fig. 1a, phase IV is stable thermodynamically below 12.9 GPa. Preliminary Raman measurements47 indicated the transition pressure of phase IV to phase V (higher than 110 kbar), which is almost identical to our calculated results, thereby confirming the reliability of our calculation. In addition, phase V remains stable until 71 GPa, and new phase P21/m emerges within 71–107 GPa. When the pressure reaches 107 GPa, the P21/m phase transforms into the Cmma phase. The lattice parameters and atomic positions of new phases are listed in Table 1. The Cmma remains stable up to 300 GPa.
3m) as a function of pressure (Fig. 1a). Fig. 1b shows the enthalpy difference of the two new phases relative to phase V within the pressure range of 60–300 GPa. Phase IV and V were repeatedly confirmed experimentally.42,47,59,60 As shown in Fig. 1a, phase IV is stable thermodynamically below 12.9 GPa. Preliminary Raman measurements47 indicated the transition pressure of phase IV to phase V (higher than 110 kbar), which is almost identical to our calculated results, thereby confirming the reliability of our calculation. In addition, phase V remains stable until 71 GPa, and new phase P21/m emerges within 71–107 GPa. When the pressure reaches 107 GPa, the P21/m phase transforms into the Cmma phase. The lattice parameters and atomic positions of new phases are listed in Table 1. The Cmma remains stable up to 300 GPa.
| Space group | Pressure/GPa | Lattice parameters | Atomic coordinates (fractional) |
|---|---|---|---|
| P21/m | 80 | a = 2.8292 Å, b = 4.3915 Å, c = 4.4496 Å, α = γ = 90°, β = 90.1756° | H1 0.71576 0.44039 0.21126 |
| H2 0.71855 0.75000 0.97815 | |||
| H3 0.70044 0.75000 0.60091 | |||
| N1 0.50244 0.25000 0.20585 | |||
| Cl1 0.08653 0.75000 0.29497 | |||
| Cmma | 120 | a = 5.2907 Å, b = 7.0193 Å, c = 2.6471 Å, α = β = γ = 90° | H1 0.35533 0.58784 0.77272 |
| N1 0.25000 0.50000 −0.00000 | |||
| Cl1 0.00000 0.25000 0.39036 |
Fig. 2 shows that all structures consist of well-separated ammonium and Cl ions. In particular, P![[4 with combining macron]](https://www.rsc.org/images/entities/char_0034_0304.gif) 3m phase has a cubic structure, where eight ammonium ions are located in the vertices and chloride ions are situated in the body center. P4/nmm, P21/m, and Cmma structures have analogous configuration, where a chloride ion is surrounded by eight ammonium ions and each ammonium ion of the three phases forms a slightly distorted tetrahedron. In phase IV, ammonium ions have the same orientation (Fig. 2a). The four nearest N–H⋯I bonds are distributed on the diagonal lines due to fully ordered arrangement of ammonium ions in the P
3m phase has a cubic structure, where eight ammonium ions are located in the vertices and chloride ions are situated in the body center. P4/nmm, P21/m, and Cmma structures have analogous configuration, where a chloride ion is surrounded by eight ammonium ions and each ammonium ion of the three phases forms a slightly distorted tetrahedron. In phase IV, ammonium ions have the same orientation (Fig. 2a). The four nearest N–H⋯I bonds are distributed on the diagonal lines due to fully ordered arrangement of ammonium ions in the P![[4 with combining macron]](https://www.rsc.org/images/entities/char_0034_0304.gif) 3m structure. In P4/nmm (b), P21/m (c), and Cmma (d) structures, the orientation of ammonium ions on the diagonal lines remains consistent; as such, the four nearest N–H⋯I bonds are distributed on the same side. The antiparallel orientations lead to a dense structural packing, which is inevitable with enhanced pressure. This packing manner is also found in Pnma and Cmcm structures of CH4.61 Eventually, we found another intriguing phenomenon, that is, the four phases have layer structures, where Cl and ammonium ions are arranged alternately.
3m structure. In P4/nmm (b), P21/m (c), and Cmma (d) structures, the orientation of ammonium ions on the diagonal lines remains consistent; as such, the four nearest N–H⋯I bonds are distributed on the same side. The antiparallel orientations lead to a dense structural packing, which is inevitable with enhanced pressure. This packing manner is also found in Pnma and Cmcm structures of CH4.61 Eventually, we found another intriguing phenomenon, that is, the four phases have layer structures, where Cl and ammonium ions are arranged alternately.
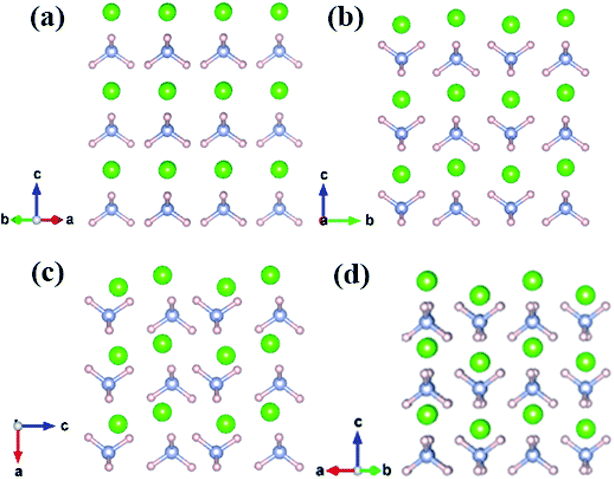 | ||
| Fig. 2 The crystal structure of NH4Cl for (a) phase IV, (b) phase V, (c) P21/m phase and (d) Cmma phase. Green, pink and grey spheres represent Cl, H and N atom, respectively. | ||
We also compared energy-dispersive X-ray diffraction data62 at ambient temperature with the results at 0 K. We also determined the equation of state by fitting the pressure as a function of volume to the third-order Birch–Murnaghan EOS63 as follows:
 | (1) |
The experimental data slightly differ from our calculated results within LDA possibly due to temperature. After all, temperature has great influence on volume (Fig. 3).
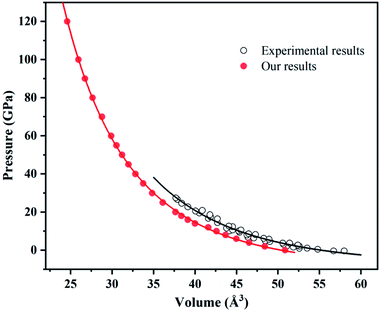 | ||
| Fig. 3 Equation of states for ammonium chloride. Red solid circles and black open circles are from this work and experimental data,62 respectively. Red solid line and black solid line illustrate the best fit of third-order BM EOS. | ||
To understand the bonding nature, we calculated the electron localization function of the P21/m phase at 80 GPa (Fig. 4a) and the Cmma phase at 120 GPa (Fig. 4b). We adopted Bader charge analysis to help elucidate the bonding nature. High ELF values indicate covalent bonds (>0.75), and values around 0.5 indicate uniform electron gas. We also calculated the ELF of phases IV and V, which are nearly identical to that of P21/m. Fig. 4a shows that Cl− and NH4+ form zigzag chains. The highest ELF values are found between the N and H atoms of NH4+, indicating a strong covalent feature, which remains unchanged up to the highest pressure applied. Nevertheless, we found that only H atoms lose electrons, which are obtained by N and Cl atoms. As shown in Table 2, the numbers of electrons that H atoms transferred and Cl atoms obtained decrease with enhanced pressure. The numbers of electrons that N atoms obtained increase with pressure in general.
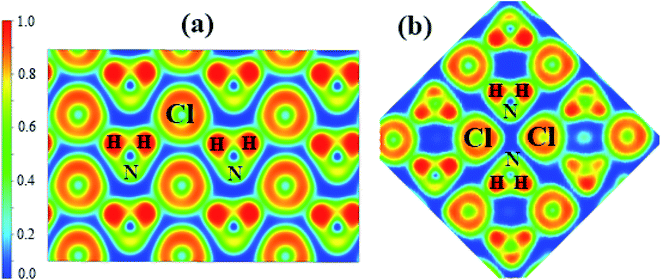 | ||
| Fig. 4 The calculated electron localization function (ELF) maps of (a) phase P21/m at 80 GPa, (b) phase Cmma at 120 GPa. | ||
P![[4 with combining macron]](https://www.rsc.org/images/entities/char_0034_0304.gif) 3m (6 GPa) 3m (6 GPa) |
H1 | H2 | H3 | H4 | N1 | Cl1 |
| Charge | 0.5215 | 0.5215 | 0.5215 | 0.5215 | 6.2259 | 7.6881 |
| P4/nmm (20 GPa) | H1 | H2 | H3 | H4 | H5 | H6 |
| Charge | 0.5290 | 0.5290 | 0.5290 | 0.5290 | 0.5290 | 0.5290 |
| H7 | H8 | N1 | N2 | Cl1 | Cl2 | |
| 0.5290 | 0.5290 | 6.2233 | 6.2233 | 7.6608 | 7.6608 | |
| P21/m (80 GPa) | H1 | H2 | H3 | H4 | H5 | H6 |
| Charge | 0.5418 | 0.5418 | 0.5418 | 0.5418 | 0.5461 | 0.5461 |
| H7 | H8 | N1 | N2 | Cl1 | Cl2 | |
| 0.5337 | 0.5337 | 6.2409 | 6.2409 | 7.5955 | 7.5955 | |
| Cmma (120 GPa) | H1 | H2 | H3 | H4 | H5 | H6 |
| Charge | 0.5457 | 0.5457 | 0.5457 | 0.5457 | 0.5457 | 0.5457 |
| H7 | H8 | H9 | H10 | H11 | H12 | |
| 0.5457 | 0.5457 | 0.5457 | 0.5457 | 0.5457 | 0.5457 | |
| H13 | H14 | H15 | H16 | N1 | N2 | |
| 0.5457 | 0.5457 | 0.5457 | 0.5457 | 6.2374 | 6.2374 | |
| N3 | N4 | Cl1 | Cl2 | Cl3 | Cl4 | |
| 6.2374 | 6.2374 | 7.5797 | 7.5797 | 7.5797 | 7.5797 |
To verify the dynamic stability of several phases, we present the phonon dispersion curves of NH4Cl along high-symmetry directions for the P4/nmm phase at 70 GPa, the P21/m phase at 100 GPa, and the Cmma phase at 120 GPa (Fig. 5). In the three diagrams, no imaginary frequency is observed in the whole Brillouin zone. We can conclude that phase V (P4/nmm) is stable up to 71 GPa. Moreover, no imaginary frequency appears in the phonon spectrum of the two new phases. Thus, the P21/m phase and the Cmma phase remain stable within 71–107 and up to 300 GPa, respectively.
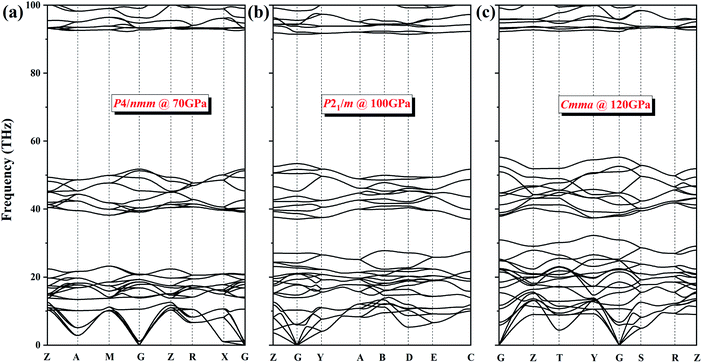 | ||
| Fig. 5 The phonon dispersion curves of NH4Cl for (a) P4/nmm phase at 70 GPa, (b) P21/m phase at 100 GPa and (c) Cmma phase at 120 GPa. | ||
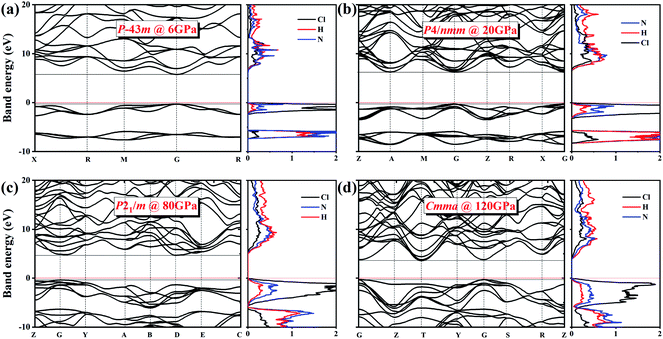
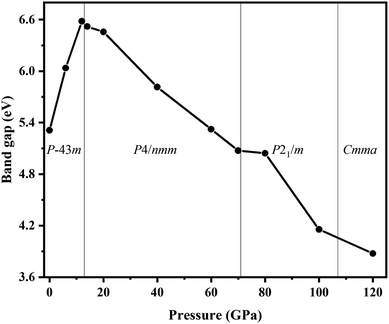
We also explored the electronic band structures of the four stable structures at selected pressure levels (Fig. 6). Broad band gaps exist in the four phases. The density of states of conduction bands are mainly associated with H atoms. Below the Fermi, the bands can be separated into two parts: from the contribution of Cl atoms and from that of N atoms. With increasing pressure, the band dispersion becomes stronger below the Fermi level because of the decrease in the distance between N and Cl atoms. The plot of changes in band gap versus pressure is shown in Fig. 7. The band gap value increases first and then decreases when the P![[4 with combining macron]](https://www.rsc.org/images/entities/char_0034_0304.gif) 3m phase transforms into the P4/nmm phase, which is identical to that found in NH4I.15 In the pressure range of phase IV, the band gap increases with increasing pressure, which also occurs in most metallic oxides,64,65 some zinc-blended semiconductors,66,67 and metal hydrides.68 Meanwhile, the band gap values of phase V and two new phases decrease with pressure, the situation is similar to most hydrides.69–72
3m phase transforms into the P4/nmm phase, which is identical to that found in NH4I.15 In the pressure range of phase IV, the band gap increases with increasing pressure, which also occurs in most metallic oxides,64,65 some zinc-blended semiconductors,66,67 and metal hydrides.68 Meanwhile, the band gap values of phase V and two new phases decrease with pressure, the situation is similar to most hydrides.69–72
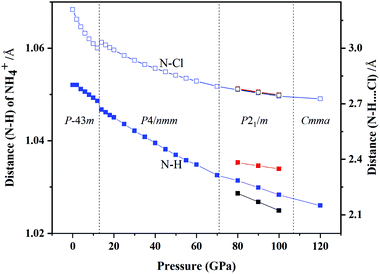
We also studied the variations in interatomic distance with increasing pressure. We determined changes in the distance between N and H atom in NH4+ and between N and Cl atom in N–H⋯Cl (Fig. 8). The distance between N and H atoms decreases with increasing pressure, presenting a discontinuous jump at the transition point of phase IV into phase V and three different bond lengths of N–H exist in the P21/m phase. The bond length of N–Cl increases abruptly at the phase transition pressure and then decrease with continuous increase in pressure.
Conclusions
In summary, the crystal structures, stability, and electronic properties of NH4Cl at high pressure levels were investigated by ab initio calculations. We uncovered two new phases at high pressure, which are exactly the same as that of NH4Br. The P21/m phase exists within 71–107 GPa, and the Cmma phase is stable above 107 GPa up to at least 300 GPa. We also verified that the mechanism of IV–V phase transition is the 90° rotation of the NH4+ ions around the c-axis. In addition, the two new phases contain alternating layers of Cl and ammonium ions. NH4Cl has not been metallized within the studied pressure range.Conflicts of interest
There are no conflicts to declare.Acknowledgements
This work was supported by the National Natural Science Foundation of China (No. 11574109, 51632002, 51572108, 91745203, 11574112), National Key Research and Development Program of China (No. 2016YFB0201204 and 2018YFA0305900). Program for Changjiang Scholars and Innovative Research Team in University (No. IRT_15R23), National Found for Fostering Talents of Basic Science (No. J1103202), Parts of calculations were performed in the High Performance Computing Center (HPCC) of Jilin University.References
- D. Duan, X. Huang, F. Tian, D. Li, H. Yu, Y. Liu, Y. Ma, B. Liu and T. Cui, Phys. Rev. B, 2015, 91, 180502 CrossRef.
- Y. Li, J. Hao, H. Liu, Y. Li and Y. Ma, J. Chem. Phys., 2014, 140, 174712 CrossRef PubMed.
- H. Wang, S. T. John, K. Tanaka, T. Iitaka and Y. Ma, Proc. Natl. Acad. Sci. U. S. A., 2012, 109, 6463–6466 CrossRef CAS PubMed.
- F. Peng, Y. Sun, C. J. Pickard, R. J. Needs, Q. Wu and Y. Ma, Phys. Rev. Lett., 2017, 119, 107001 CrossRef PubMed.
- H. Liu, I. I. Naumov, R. Hoffmann, N. Ashcroft and R. J. Hemley, Proc. Natl. Acad. Sci. U. S. A., 2017, 114, 6990–6995 CrossRef CAS PubMed.
- A. Drozdov, M. Eremets, I. Troyan, V. Ksenofontov and S. I. Shylin, Nature, 2015, 525, 73–76 CrossRef CAS PubMed.
- M. Somayazulu, M. Ahart, A. K. Mishra, Z. M. Geballe, M. Baldini, Y. Meng, V. V. Struzhkin and R. J. Hemley, Phys. Rev. Lett., 2019, 122, 027001 CrossRef CAS.
- C. W. Pistorius, Prog. Solid State Chem., 1976, 11, 1–151 CrossRef.
- H. Hochheimer, E. Spanner and D. Strauch, J. Chem. Phys., 1976, 64, 1583–1585 CrossRef CAS.
- W. Press, J. Eckert, D. Cox, C. Rotter and W. Kamitakahara, Phys. Rev. B, 1976, 14, 1983–1988 CrossRef CAS.
- P. Andersson and R. G. Ross, J. Phys. C: Solid State Phys., 1987, 20, 4737–4743 CrossRef CAS.
- F. Tian, D. Li, D. Duan, C. Chen, Z. He, X. Sha, Z. Zhao, B. Liu and T. Cui, Chin. Sci. Bull., 2014, 59, 5272–5277 CrossRef CAS.
- H. A. Levy and S. Peterson, J. Am. Chem. Soc., 1953, 75, 1536–1542 CrossRef CAS.
- Y. Huang, X. Huang, L. Wang, G. Wu, D. Duan, K. Bao, Q. Zhou, B. Liu and T. Cui, RSC Adv., 2015, 5, 40336–40340 RSC.
- M. Lu, Y. Huang, F. Tian, D. Li, D. Duan, Q. Zhou and T. Cui, Chin. Phys. B, 2020, 29, 053104 CrossRef CAS.
- F. Simon, Ann. Phys., 1922, 68, 241–280 CrossRef CAS.
- A. W. Lawson, Phys. Rev., 1940, 57, 417–426 CrossRef CAS.
- N. Trappeniers, Ber. Bunsenges. Phys. Chem., 1966, 70, 1080–1084 CAS.
- C. W. Garland and B. B. Weiner, Phys. Rev. B, 1971, 3, 1634–1637 CrossRef.
- H. Yurtseven and W. Sherman, Phase Transitions, 1995, 54, 1–13 CrossRef CAS.
- B. B. Weiner and C. W. Garland, J. Chem. Phys., 1972, 56, 155–165 CrossRef CAS.
- H. Yurtseven and M. Baş, J. Mol. Struct., 2000, 525, 87–96 CrossRef CAS.
- H. Yurtseven, Ö. Tari and M. Baş, J. Mol. Struct., 2001, 598, 109–116 CrossRef CAS.
- M. Bas and H. Yurtseven, ARI, 1998, 51, 136–140 CrossRef CAS.
- W. Robinson and S. Friedberg, Phys. Rev., 1960, 117, 402–408 CrossRef CAS.
- G. S. Dixon and J. E. Rives, Phys. Rev., 1969, 177, 871–877 CrossRef CAS.
- R. Hill and B. Ricketson, London, Edinburgh Dublin Philos. Mag. J. Sci., 1954, 45, 277–282 CrossRef.
- A. Smits and C. Mac Gillavry, Z. Phys. Chem., 1933, 166, 97–112 CrossRef.
- R. G. Ross and P. Andersson, J. Phys. C: Solid State Phys., 1987, 20, 4745–4762 CrossRef CAS.
- S. Bahrs and J. Engl, Z. Phys., 1937, 105, 470–477 CrossRef CAS.
- E. Mohler and R. Pitka, Solid State Commun., 1974, 14, 791–794 CrossRef CAS.
- A. C. Menzies and H. R. Mills, Proc. R. Soc. London, Ser. A, 1935, 148, 407–422 CAS.
- Y. Ebisuzaki and M. Nicol, Chem. Phys. Lett., 1969, 3, 480–483 CrossRef CAS.
- C. H. Wang and R. B. Wright, J. Chem. Phys., 1974, 60, 849–854 CrossRef CAS.
- C. H. Wang and R. B. Wright, J. Chem. Phys., 1972, 56, 2124–2129 CrossRef CAS.
- M. L. Shand, H. D. Hochheimer and C. T. Walker, Solid State Commun., 1976, 20, 1043–1047 CrossRef CAS.
- R. S. Krishnan, Proc. Ind. Acad. Sci., 1947, A26,, 432–449 CrossRef.
- G. Goldschmidt and D. Hurst, Phys. Rev., 1951, 83, 88–94 CrossRef CAS.
- H. Yamashita, J. Phys. Soc. Jpn., 1970, 29, 1391 CrossRef CAS.
- A. Heyns, J. Phys. Chem. Solids, 1980, 41, 769–776 CrossRef CAS.
- A. Balagurov, D. Kozlenko, B. Savenko, V. Glazkov, V. Somenkov and S. Hull, Phys. B, 1999, 265, 92–96 CrossRef CAS.
- A. Balagurov, B. Savenko, A. Borman, V. Glazkov, I. Goncharenko, V. Somenkov and G. Syrykh, Inter. J. High Press. Res., 1995, 14, 55–60 CrossRef.
- V. Glazkov, D. Kozlenko, B. Savenko, V. Somenkov, G. Syrykh and A. Telepnev, J. Exp. Theor. Phys., 2002, 94, 1134–1139 CrossRef CAS.
- V. G. Vaks and V. Schneider, Phys. Status Solidi A, 1976, 35, 61–72 CrossRef CAS.
- S. Salihoğlu, H. Yurtseven and H. KaraÇali, Mol. Phys., 2007, 87, 2371–2387 Search PubMed.
- H. A. Levy and S. Peterson, Phys. Rev., 1952, 86, 766–770 CrossRef CAS.
- S. J. Jeon, R. F. Porter and A. L. Ruoff, J. Raman Spectrosc., 1988, 19, 179–182 CrossRef CAS.
- A. R. Oganov and C. W. Glass, J. Chem. Phys., 2006, 124, 244704 CrossRef PubMed.
- C. W. Glass, A. R. Oganov and N. Hansen, Comput. Phys. Commun., 2006, 175, 713–720 CrossRef CAS.
- A. R. Oganov, C. W. Glass and S. Ono, Earth Planet. Sci. Lett., 2006, 241, 95–103 CrossRef CAS.
- A. O. Lyakhov, A. R. Oganov and M. Valle, Comput. Phys. Commun., 2010, 181, 1623–1632 CrossRef CAS.
- A. R. Oganov, A. O. Lyakhov and M. Valle, Acc. Chem. Res., 2011, 44, 227–237 CrossRef CAS PubMed.
- A. O. Lyakhov, A. R. Oganov, H. T. Stokes and Q. Zhu, Comput. Phys. Commun., 2013, 184, 1172–1182 CrossRef CAS.
- G. Kresse and D. Joubert, Phys. Rev. B, 1999, 59, 1758–1775 CrossRef CAS.
- G. Kresse and J. Furthmüller, Phys. Rev. B, 1996, 54, 11169 CrossRef CAS PubMed.
- H. J. Monkhorst and J. D. Pack, Phys. Rev. B, 1976, 13, 5188–5192 CrossRef.
- A. Togo, F. Oba and I. Tanaka, Phys. Rev. B, 2008, 78, 134106 CrossRef.
- K. Parlinski, Z. Li and Y. Kawazoe, Phys. Rev. Lett., 1997, 78, 4063–4066 CrossRef CAS.
- Y. Ebisuzaki, J. Chem. Phys., 1974, 61, 3170–3180 CrossRef CAS.
- G. Venkataraman, K. U. Deniz, P. Iyengar, A. Roy and P. Vijayaraghavan, J. Phys. Chem. Solids, 1966, 27, 1103–1123 CrossRef CAS.
- G. Gao, A. R. Oganov, Y. Ma, H. Wang and G. Zou, J. Chem. Phys., 2010, 133, 144508 CrossRef PubMed.
- O. Schulte and W. Holzapfel, High. Pres Sci. Technol., 1990, 4, 321–323 CrossRef.
- F. Birch, J. Geophys. Res.: Solid Earth, 1978, 83, 1257–1268 CrossRef CAS.
- S. A. Gramsch, R. E. Cohen and S. Y. Savrasov, Am. Mineral., 2003, 88, 257–261 CrossRef CAS.
- Y. Wang, F. Tian, D. Li, D. Duan, H. Xie, B. Liu, Q. Zhou and T. Cui, J. Alloys Compd., 2019, 788, 905–911 CrossRef CAS.
- S. H. Wei and A. Zunger, Phys. Rev. B, 1999, 60, 5404–5411 CrossRef CAS.
- O. Arbouche, B. Belgoumène, B. Soudini and M. Driz, Comput. Mater. Sci., 2009, 47, 432–438 CrossRef CAS.
- S. Zhang, J. Lin, Y. Wang, G. Yang, A. Bergara and Y. Ma, J. Phys. Chem. C, 2018, 122, 12022–12028 CrossRef CAS.
- Y. Wang, R. Ahuja and B. Johansson, Phys. Status Solidi B, 2003, 235, 470–473 CrossRef CAS.
- D. Meng, M. Sakata, K. Shimizu, Y. Iijima, H. Saitoh, T. Sato, S. Takagi and S.-i. Orimo, Phys. Rev. B, 2019, 99, 024508 CrossRef CAS.
- D. Duan, Y. Liu, F. Tian, D. Li, X. Huang, Z. Zhao, H. Yu, B. Liu, W. Tian and T. Cui, Sci. Rep., 2014, 4, 6968 CrossRef CAS PubMed.
- L. Hao, Z. Yuan, X. Guo, Y. Zhang, K. Luo, Y. Gao, F. Ling, X. Chen, Z. Zhao and D. Yu, Phys. Lett. A, 2020, 126525 CrossRef CAS.
| This journal is © The Royal Society of Chemistry 2021 |

