DOI:
10.1039/D0RA09837J
(Paper)
RSC Adv., 2021,
11, 5479-5486
Insights into the estimation of capacitance for carbon-based supercapacitors†
Received
19th November 2020
, Accepted 18th December 2020
First published on 29th January 2021
Abstract
Carbon-based materials are broadly used as the active component of electric double layer capacitors (EDLCs) in energy storage systems with a high power density. Most of the reported computational studies have investigated the electrochemical properties under equilibrium conditions, limiting the direct and practical use of the results to design electrochemical energy systems. In the present study, for the first time, the experimental data from more than 300 published papers have been extracted and then analyzed through an optimized support vector machine (SVM) by a grey wolf optimization (GWO) algorithm to obtain a correlation between carbon-based structural features and EDLC performance. Several structural features, including calculated pore size, specific surface area, N-doping level, ID/IG ratio, and applied potential window were selected as the input variables to determine their impact on the respective capacitances. Sensitivity analysis, which has only been performed in this study for approximating the EDLC capacitance, indicated that the specific surface area of the carbon-based supercapacitors is of the greatest effect on the corresponding capacitance. The proposed SVM-GWO, with an R2 value of 0.92, showed more accuracy than all the other proposed machine learning (ML) models employed for this purpose.
1. Introduction
Electronic devices are becoming popular equipment in our daily life because they reduce fossil energy utilization and don't cause any environment pollution.1–4 Electric (electrochemical) double layer capacitors (EDLCs), as promising and environmentally friendly energy storage devices, have drawn great attention because of their fast charge–discharge capability, long cyclability, and high power density.5,6 Although EDLCs benefit from quite high power density, i.e., fast delivery of stored charge as compared to ion batteries, low energy density has yet been their limiting feature. Indeed, in contrast to batteries, such devices directly store the charge at the electrode/electrolyte interface via reversible adsorption of electrolyte ions on the electrode surface.7
According to the crucial role of the electrode active materials for the supercapacitor performance, various novel or modified materials have been extensively studied. Namely, carbon materials, including activated carbons, graphene, carbide-derived carbons, and carbon nanotubes, have been employed due to their high conductivity, large specific surface area, low density, and good chemical stability.8–11 In particular, the surface area is of great importance in the charge storage of the electrical double layer (EDL). A large surface area provides more available active sites for ions to interact, and consequently, the capacitance can be improved. In addition, experimental studies have proved that the capacitance of the porous carbon-based material is affected by their pore structure including pore shape, pore size (and pore size distribution) together with electrolyte ions size.12,13
In addition, different capacitive behavior is determined by the corresponding pore characteristics. Electrosorption in micropores (<2 nm) is more efficient than that in mesopores (2–50 nm) since the mesopores are extremely large compared to the size of the ions. Such process in carbon-based materials is accompanied by further complexity such as overlapping potential profiles of the EDLs and (partially) peeling off the solvation shell of the ions while entering the pores. This is due to the fact that the carbon-based materials provide quite small micropores (pores smaller than the Debye length).14,15 Additionally, having only micropores makes it difficult to access the smaller pores due to a sieving effect. It also prevents the easy transfer of electrolyte ions into the deeper zone in the electrodes, despite the mesopores which are useful for providing gateways for ions to enter the micropores. Probably, fabrication of 3D porous carbon materials, which combine micropores, mesoporous walls, and macroporous cores, might be a practical approach to improve the surface area and the capacitance performance simultaneously.16 Such complex structure causes several issues including reporting one average pore size for non-ideal (broad) pore size distribution of microporous carbon materials and inaccurate measurement methods for representing pore structure, leading to conflicting experimental results.17–20 Thus, there is no clear and direct relationship between the surface area/pore structure of the electrode materials and the corresponding capacitance in the experimental studies. This is due to the various mass transfer mechanisms and the EDL formation efficiency of different pore structures.13,21,22 As a result, in order to improve the performance of EDLCs in terms of energy and power density, a quantitative relation between the carbon-based materials' structural features and obtained capacitance is necessary to adjust the carbon materials features efficiently.
Molecular simulation methods have been applied to investigate the relation between the microscopic structures and the macroscopic performances for capacitance prediction of carbon-based supercapacitors. Equivalent circuit models (ECMs) are usually used to examine the kinetics of charging and discharging for energy storage devices due to their simplicity and effectiveness to correlate the experimental data. However, such models could not provide insights on the microscopic details of ion transport and energy storage.23 Besides, molecular dynamics simulations (MDs) as the most accurate method can predict the capacitance where they efficiently describe microscopic phenomena of the electrode/electrolyte interface.20,24 However, one of the issues related to MDs is attributed to the accurate atomistic models for complicated carbon structures, which comes with a less straightforward characterization and an excessive computational cost compared with the slit pore models. Another challenge with MDs is ascribed to the feasible simulation scales of time and length (in nanoseconds and nanometers), which are usually far different from the experimental values (in milliseconds and micrometers).25 Hence, developing novel soft models like machine learning (ML) technique to bridge the gap between molecular simulations and macroscopic measurements seems necessary. ML technique is a data-based approach and a suitable alternative method to solve several practical complications. ML is regarded as a computer science branch where computer systems learn from the given data and predict or decide based on their programmed analysis.26,27 Recently, several chemical engineering problems have been widely studied by ML methods.28–34 In 2018, the influence of several parameters (specific surface area, ID/IG ratio, calculated pore size, doping element, and voltage window) on the capacitance was studied via an artificial neutron network (ANN) method.35 Recently Su et al. investigated the effect of porous carbon-based materials and working potential ranges on EDL capacitance by using various ML models. The multi-layer perception (MLP) model exhibited the best performance and determined the relative impact of the influencing parameters on the capacitance of EDLC.36 In spite of developed correlations, it is still unclear how ML methods would better understand the relation between the EDLCs performance and the structural properties of carbon-based materials. In this work, the capacitance of carbon-based EDCLs is accurately predicted as a function of specific surface area, calculated pore size, ID/IG ratio (ratio of the D-band (at 1360 cm−1, which reflects the amorphous carbon and the defects) and G-band (at 1570 cm−1, which indicates the existence of the sp2 hybridized carbon) in Raman spectroscopy results), N-doping level, and voltage window using optimized support vector machine by the grey wolf optimization algorithm.
2. Methodology
2.1. Support vector machine
The support vector machine (SVM) is a machine learning technique that, unlike other ML methods, works on the basis of minimizing the structural risk principle of statistical theory.37 It was initially presented for classification problems by Vapnik in 1992 (ref. 38) which was further developed to the version used today by Cortes and Vapnik in 1995,39 and in 1997 it was adapted to regression problems by Vapnik et al.40 While SVM was introduced for linear problems, benefiting from its working principle, it can be modified for nonlinear problems using kernel functions.
The SVM method equations are presented below.41 Eqn (1) is a simple data set for training by the SVM regression model, where xi, yi, R, and d are input, output, output space, and the dimension of the input space, respectively.
| | |
{xi,yi|x ∈ Rd, y ∈ R, i = 1, 2, …, n}
| (1) |
Eqn (2) is used to map the input data from Rd space to high dimensional space Rk (k > d).
| | |
ψ(x) = (ϕ(x1), ϕ(x2), …, ϕ(xn))
| (2) |
The prediction model for SVM is given in eqn (3):
| | |
f(x) = ωTϕ(x) + b, ω ∈ Rk, b ∈ R
| (3) |
where
b,
ω, and
ϕ(
x) indicate bias constant, weight, and a nonlinear mapping function, respectively.
The ω and b can be determined according to the principle of structural risk minimization by eqn (4)
| |
 | (4) |
where ‖
ω‖
2 controls the model difficulty,
c is the regularization coefficient, and
Remp is a function to control the error. For the optimization objective, the
Remp of standard SVM is the linear term of the error. Using the relaxation factors of
ξi and

and the insensitivity loss function of
ε,
eqn (4) can be transformed into
eqn (5):
| |
 | (5) |
To solve the SVM, the Lagrange function is used as in eqn (6).
| |
 | (6) |
where

indicate Lagrange factors.
Considering the Karush–Kuhn–Tucker optimization conditions (eqn (7)) and the symmetric kernel function (eqn (8)), the optimization problem is developed as eqn (9).
| |
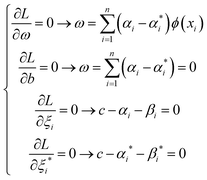 | (7) |
| | |
K(xi,xj) = ϕ(xi)Tϕ(xj)
| (8) |
| |
 | (9) |
Thus, the SVM regression model can be written as in eqn (10).
| |
 | (10) |
Various kernel functions are used for the SVM method. In this study, the radial basis kernel function is selected (eqn (11)), where σ is the width parameter of the function.
| |
 | (11) |
2.2. Grey wolf optimization
In 2014, Mirjalili et al. introduced the Grey wolf optimization (GWO) as a new meta-heuristic algorithm.42 It is inspired by the social hunting of grey wolves. In general, the social hierarchy of grey wolves is divided into four categories: (1) alpha (α), which is the leader and responsible for making decisions about everything, (2) beta (β), which supports or consults the alpha wolves, (3) delta (δ), which is the third class of grey wolves, (4). They should surrender to alpha and beta wolves, and the rest of the wolves are the omega (ω), which must follow the order of the alpha and beta. They also have to help other wolves whenever needed.43,44 Therefore, the power level decrease from α to ω (see Fig. 1(a)). The GWO splits the solutions to a specific optimization issue into four categories. The top three solutions are the best (α, β, and δ) and other solutions are considered as ω wolves. According to the three best solutions, the hierarchy is updated in each iteration. The description of the relocation is presented in Fig. 1(b). The GWO process includes the main principle of searching, surrounding, hunting, and attacking the prey. The surrounding of grey wolves is represented by eqn (12)| | |
X(t + 1) = Xp(t) − A × D
| (12) |
where; X(t + 1), Xp(t), t, A, and D indicate the next location of a grey wolf, the position vector of any wolf, the current iteration, matrix coefficient, and the distance between the grey wolf and the prey, which can be calculated by eqn (13)–(15)| | |
D = |C × Xp(t) − X(t)|
| (13) |
where; r1, r2 are random vectors from (0 to 1).
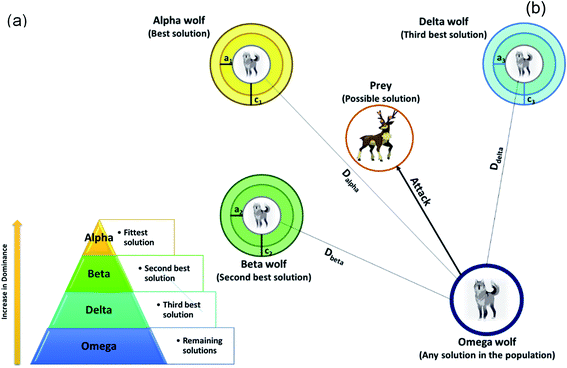 |
| | Fig. 1 (a) The social hierarchy of grey wolves, (b) reposition mechanism of ω wolves according to positions of α, β and δ wolves. | |
These equations allow the solution to reposition around the prey in a hypersphere form (Fig. 1(b)). Accordingly, the ω wolves update their positions by the following eqn (16):
| |
 | (16) |
where;
X1,
X2, and
X3 are obtained by the following equations:
| | |
X1 = X∝(t) − A1 × D∝
| (17) |
| | |
X2 = Xβ(t) − A2 × Dβ
| (18) |
| | |
X3 = Xδ(t) − A3 × Dδ
| (19) |
| | |
D∝ = |C1 × X∝(t) − X(t)|
| (20) |
| | |
Dβ = |C2 × Xβ(t) − X(t)|
| (21) |
| | |
Dδ = |C3 × Xδ(t) − X(t)|
| (22) |
3. Data collection and feature selection
In the present work, 681 sets of carbon-based supercapacitors with different variables of the test system (i.e. test voltage range, electrolyte, and the obtained specific capacity) and physicochemical properties of the carbon materials (i.e. pore volume, specific surface area, the ratio of ID/IG, micropore volume, and doping elements) were obtained from more than 300 published papers for ML methods. All these data are available in the ESI.† Five parameters of specific surface area, ID/IG ratio, calculated pore size, voltage window, and N-doping level, have been selected as inputs for the SVM method because they are quite effective on the corresponding capacitance. It is notable from C = εε0A/d (where C, ε, ε0, A, and d indicate the capacitance, the dielectric constant of the electrolyte, the vacuum permittivity, the specific surface area, and the distance between the carbon surface and the center of ion, respectively) the specific surface area has a significant influence on the capacitance of supercapacitors.45,46 Therefore, increasing the surface area is necessary for enhancing the capacitance. Besides, the pore size of the electrode influences the accessibility of the electrolyte ions. Different detection molecules and various mathematical methods have been used to analyze the pore size of carbon materials, which result in incompatibility among many studies. Therefore, the Wheeling equation (eqn (23))35 has been selected to calculate the average pore size:| |
 | (23) |
The electrical conductivity of the carbon materials is influenced by their crystallinity. The crystallization degree of carbon materials can be investigated by the intensity ratio between the D-band (at 1360 cm−1, which reflects the amorphous carbon and the defects) and G-band (at 1570 cm−1, which indicates the existence of the sp2 hybridized carbon) (ID/IG) in Raman spectroscopy results.35,36 In addition to the structural features, the constitute components significantly affect capacitive performance. Nitrogen is the most doped hetero atom in carbonous materials because the nitrogen-containing functional groups could induce additional pseudocapacitance and quantum capacitance and consequently enhance the capacitance.47
The materials of the experimental system, especially the electrolyte, are also important for the performance of the capacitor.46 Different electrolytes adjust the voltage window (V), which could change the energy density (E) of the supercapacitor, according to E = CV2.45
4. Results and discussion
4.1. Sensitivity analysis
Sensitivity analysis (SA) is a mathematical method used to investigate the influence of input parameters' on the output. It is also useful to recognize vital regions, find methodological errors, and determine research priorities.48,49 Sensitivity analysis can be applied in two forms: local and global. Local SA evaluates one effect of input on the result while all the other inputs are fixed.50 Besides, the usual method of global SA investigates the impact of the inputs on the outcome when all of them are changed.
As shown in Fig. 2, specific surface area has the strongest influence on supercapacitance performance with the relevancy factor of 0.32. This is mainly since the specific surface area directly affects the electrosorption ability of the electrode material. The high surface area can cause more adsorption of electrolyte ions and increases the capacitance. The relative factor of pore volume, micropore volume, N-doping, micropores surface area, and O-doping are not large, and their importance scores are 0.19, 0.16, 0.16, 0.14, and 0.17, respectively. It is also has been reported modification with non-carbon elements (e.g. O, N, S, B) and defects allows providing additional capacity.51,52 Accordingly, in the design of carbon-based electrodes for EDLCs, the specific surface area is crucial factor to be considered.
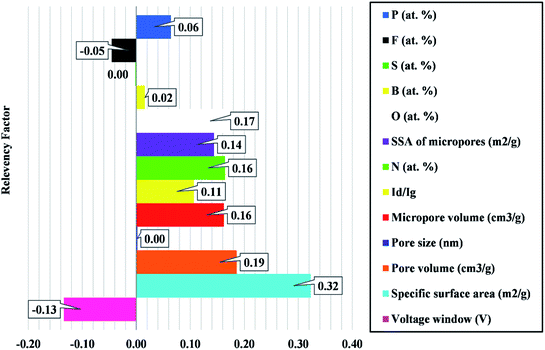 |
| | Fig. 2 Sensitivity analysis for determining effective variables on the capacitance of the carbon-based EDCLs. | |
4.2. Designing GWO-SVM model
As discussed before, C, ε, and γ control the SVM algorithm performance. For that reason, the GWO has been used to optimize these factors.
The scheme and the detail of the GWO-SVM algorithm are described in Fig. 3 and Table 1. As mentioned, in the GWO, alpha, beta, and delta are the top three solutions to examine the prey location. The GWO will stop when the final criterion is determined.
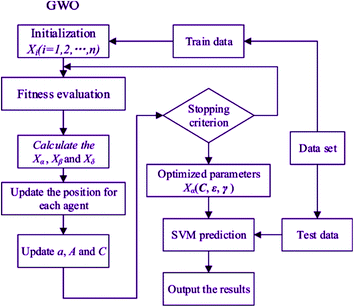 |
| | Fig. 3 Flowchart of optimized SVM with GWO algorithm. | |
Table 1 Details of the employed GWO-SVM algorithm
| Parameter |
Value/comment |
| Kernel function |
Gaussian |
| No. of train data |
511 |
| No. of test data |
170 |
| Optimization technique |
GWO |
| C |
185![[thin space (1/6-em)]](https://www.rsc.org/images/entities/char_2009.gif) 366.985 366.985 |
| ε |
0.108846 |
| Γ |
0.056684 |
4.3. Outlier analysis
Outlier diagnosis, as one of the fundamental statistical methods, is applied to distinguish sets of data behaving differently from the whole dataset. A useful technique of leverage statistics is used to detect the outliers with the parameters of the Hat indices (H), the critical Leverage limit (H*), and the standardized (R).53 H and H* are introduced below:| |
 | (25) |
where t and X in eqn (24) are the transpose matrix and the two-dimensional (n × k) matrix, respectively. In eqn (23), n and p indicate the training points and the number of input parameters, respectively. In this study, the possible Hat solutions are along the main diagonal of H. The outlying candidates are recognized by the representation of the Williams plot (standardized residuals (R) against Hat index (H)).49 The feasible data region is defined as a squared area restricted to the cut-off value (which is ±3 usually) and the warning leverage value on the vertical and horizontal axis, respectively. The data (R and H), which are placed out of the valid zone ([−3, 3] and [0, H*], respectively) are categorized as the outliers. The Williams plot related to the outputs of GWO-SVM is represented in Fig. 4. It can be clearly seen the most of the capacitance values studied in this work, located in the valid domain other than 31 points situated higher than H* value, demonstrating that in addition to being useful in statistics, the GWO-SVM algorithm could also reveal the inherent relationships between the input parameters and capacitance value in a much more acceptable approach.
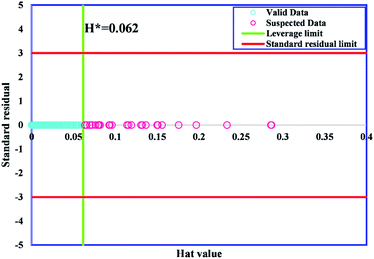 |
| | Fig. 4 William's plot of the proposed GWO-SVM to find outliers. | |
4.4. Model evaluation
In Fig. 5, the capacitance values obtained from the proposed model are described versus the data index, showing the training and testing results. It demonstrates that the suggested model is considerably capable of predicting the capacitance of carbon-based supercapacitors.
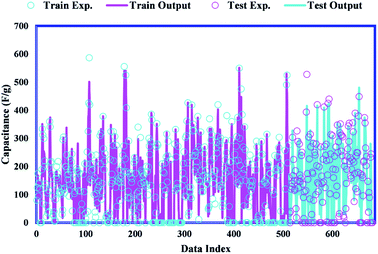 |
| | Fig. 5 Experimental versus predicted capacitances of the carbon-based EDLCs from the GWO-SVM. | |
In order to evaluate the proximity of obtained values to real values, the coefficient of determination (R2) is defined. It varies from 0 to 1, which closeness to unity signifies more accuracy of the model prediction. Fig. 6 represents the cross diagram of actual and simulated values. The major part of capacitance values is along the bisector line and the obtained R2 values for training and testing data sets of the GWO-SVM model are 0.9281 and 0.8958, respectively; thus, confirming the high capability of the GWO-SVM model towards precise prediction. The deviation percentage for the GWO-SVM model is shown in Fig. 7. The determined deviation is not more than 100% band, demonstrating the incredible precision of the model. Moreover, statistical analyses of the proposed SVM-GWO model has been presented in Table 2. As can be seen, the proposed model is satisfactorily accurate for estimating the capacitance of carbon-based supercapacitors.
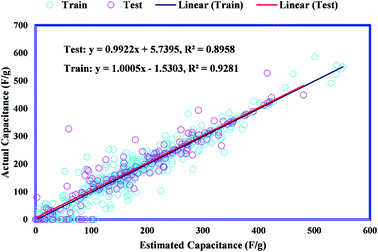 |
| | Fig. 6 Regression plot of the train and test dataset of the capacitances of carbon-based EDCLs. | |
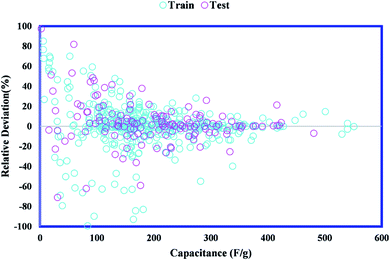 |
| | Fig. 7 Relative deviation plot of GWO-SVM for the capacitance of carbon-based EDCLs. | |
Table 2 Statistical analyses of the proposed SVM-GWO model
| Set |
R2 |
RMSE |
STD |
| Train |
0.928 |
31.6207 |
23.7707 |
| Test |
0.896 |
39.2215 |
31.5096 |
| Total |
0.920 |
39.2215 |
25.9192 |
4.5. Comparison with literature
In order to compare the results obtained from the proposed GWO-SVM model, a statistical comparison was carried out in Table 3 between the current model and previously developed models by Su et al.36, Zhu et al.35 and Zhou et al.54 for estimating the capacitance of carbon-based supercapacitors. Su et al. proposed four models, including linear regression (LR), support vector regression (SVR), regression trees (RT), and MLP, of which MLP and RT performed better with RMSE of 67.62 and 68.45, respectively. They introduced MLP as the best model because, unlike RT, it could obtain all the relative contribution of the input variables to the EDL capacitance. Furthermore, it shows only a negeligible lower accuracy as compared to RT. They used the CVParameterSelection module in the open source package of WEKA. The number of nodes and the learning rate in the hidden layer were 0.2 and 20, respectively. Zu et al. reported ANN achieved more accurate results than LR and Lasso. They combined three layers and applied the “tanh” function as an activation function to build the ANN model. In a very recent study, Zhou et al. found out among the four different ML models, the ANN algorithm exhibits the best performance. They chose Bayesian regularization backpropagation function to train the ANN model. They also claimed the proposed ANN algorithm could capture the dependence of the EDL capacitance on micropore and mesopore surface areas in a wide range of the scan rate. As presented in Table 3, the proposed GWO-SVM model, with a minimum RMSE and maximum value of R2, is the most accurate model to estimate the EDL capacitance carbon-based materials.
Table 3 Comparison of the proposed model with the other previously developed models to predict the corresponding capacitance
| Model |
R2 |
RMSE |
Reference |
| LR |
0.2809 |
97.1 |
Su et al.36 |
| SVR |
0.4489 |
81.97 |
|
| RT |
0.5776 |
67.62 |
|
| MLP |
0.5625 |
68.45 |
|
| ANN |
0.91 |
— |
Zhu et al.35 |
| GLR |
0.3555 |
54.9068 |
Zhou et al.54 |
| SVM |
0.6552 |
40.1598 |
|
| RF |
0.6891 |
38.1331 |
|
| ANN |
0.7167 |
36.4013 |
|
| GWO-SVM |
0.92 |
39.2215 |
Current model |
5. Conclusions
In summary, this work applied SVM-GWO to investigate the impact of the structural features on electrical double-layer capacitors performance. Pore size, specific surface area, N-doping level, ID/IG ratio, and voltage window were selected as the input physico/chemical properties. The experimental data were extracted from more than 300 published papers. The proposed SVM-GWO model showed the best accuracy as compared to the other proposed ML models in the literature, showing its great potential for assisting to objectively design the corresponding EDL materials. Moreover, the sensitivity analysis showed that the specific surface area of carbon-based supercapacitors followed by pore volume have the greatest effect on supercapacitance. Moreover, from a model selection perspective, the proposed GWO-SVM model in this study with a minimum RMSE and a maximum value of coefficient of determination is the most accurate model to estimate the EDL capacitance of most carbon-based materials.
Conflicts of interest
There are no conflicts to declare.
References
- K. Wang, W. Wang, L. Wang and L. Li, Energies, 2020, 13, 5297 CrossRef CAS.
- F. Xiao, R. Jun, C. Duan and L. Liwei, Int. J. Electrochem. Sci., 2020, 15, 9499–9516 Search PubMed.
- G. Xia, Y. Huang, F. Li, L. Wang, J. Pang, L. Li and K. Wang, Front. Chem. Sci. Eng., 2020, 14, 1039–1051 CrossRef.
- Y. Z. Xiao Feng, L. Kang, L. Wang, C. Duan, K. Yin, J. Pang and K. Wang, Front. Chem. Sci. Eng., 2020, 1–13 Search PubMed.
- G. Piłatowicz, A. Marongiu, J. Drillkens, P. Sinhuber and D. U. Sauer, J. Power Sources, 2015, 296, 365–376 CrossRef.
- X. Song, X. Ma, Y. Li, L. Ding and R. Jiang, Appl. Surf. Sci., 2019, 487, 189–197 CrossRef CAS.
- Z. Lin, P.-L. Taberna and P. Simon, Curr. Opin. Electrochem., 2017, 6, 115–119 CrossRef CAS.
- X. Su, J. Ye and Y. Zhu, J. Energy Chem., 2021, 54, 242–253 CrossRef.
- Q. Shao, P. Lu, L. Xu, D. Guo, J. Gao, Z. S. Wu and J. Chen, J. Energy Chem., 2020, 53, 262–271 CrossRef.
- K. Wang, L. Liwei, X. Wen, Z. Shengzhe, L. Yong, Z. Hongwei and S. Zongqiang, Int. J. Electrochem. Sci, 2017, 12, 8306–8314 CAS.
- K. Wang, L. Li, T. Zhang and Z. Liu, Energy, 2014, 70, 612–617 CrossRef CAS.
- Y. Liang, F. Liang, Z. Li, D. Wu, F. Yan, S. Li and R. Fu, Phys. Chem. Chem. Phys., 2010, 12, 10842–10845 RSC.
- X. Yang, C. Li and R. Fu, J. Power Sources, 2016, 319, 66–72 CrossRef CAS.
- P. B. Peters, R. van Roij, M. Z. Bazant and P. M. Biesheuvel, Phys. Rev. E, 2016, 93, 053108 CrossRef CAS PubMed.
- P. R. Bandaru, H. Yamada, R. Narayanan and M. Hoefer, Mater. Sci. Eng., R, 2015, 96, 1–69 CrossRef.
- A. Ghosh and Y. Lee, ChemSusChem, 2012, 5, 480–499 CrossRef CAS PubMed.
- T. A. Centeno, O. Sereda and F. Stoeckli, Phys. Chem. Chem. Phys., 2011, 13, 12403–12406 RSC.
- A. García-Gómez, G. Moreno-Fernández, B. Lobato and T. A. Centeno, Phys. Chem. Chem. Phys., 2015, 17, 15687–15690 RSC.
- D.-e. Jiang, Z. Jin and J. Wu, Nano Lett., 2011, 11, 5373–5377 CrossRef CAS PubMed.
- G. Feng and P. T. Cummings, J. Phys. Chem. Lett., 2011, 2, 2859–2864 CrossRef CAS.
- C. O. Ania, J. Pernak, F. Stefaniak, E. Raymundo-Piñero and F. Béguin, Carbon, 2009, 47, 3158–3166 CrossRef CAS.
- J. Chmiola, G. Yushin, Y. Gogotsi, C. Portet, P. Simon and P. L. Taberna, Science, 2006, 313, 1760 CrossRef CAS PubMed.
- K. Breitsprecher, C. Holm and S. Kondrat, ACS Nano, 2018, 12, 9733–9741 CrossRef CAS PubMed.
- C. Merlet, B. Rotenberg, P. A. Madden, P.-L. Taberna, P. Simon, Y. Gogotsi and M. Salanne, Nat. Mater., 2012, 11, 306–310 CrossRef CAS PubMed.
- A. Belhboub, E. H. Lahrar, P. Simon and C. Merlet, Electrochim. Acta, 2019, 327, 135022 CrossRef CAS.
- S. Chong, S. Lee, B. Kim and J. Kim, Coord. Chem. Rev., 2020, 423, 213487 CrossRef CAS.
- H. Su, C. Lian, J. Liu and H. Liu, Chem. Eng. Sci., 2019, 202, 186–193 CrossRef CAS.
- S. Chakraborty, B. S. Das, M. Nasim Ali, B. Li, M. C. Sarathjith, K. Majumdar and D. P. Ray, Waste Manage., 2014, 34, 623–631 CrossRef CAS PubMed.
- H. Sui, L. Li, X. Zhu, D. Chen and G. Wu, Chemosphere, 2016, 144, 1950–1959 CrossRef CAS PubMed.
- N. G. Turan, B. Mesci and O. Ozgonenel, Chem. Eng. J., 2011, 173, 98–105 CrossRef CAS.
- G. Wu, C. Kechavarzi, X. Li, S. Wu, S. J. T. Pollard, H. Sui and F. Coulon, Chem. Eng. J., 2013, 223, 747–754 CrossRef CAS.
- A. Baghban, A. Jalali, M. Shafiee and M. Ahmadi, Engineering Applications of Computational Fluid Mechanics, 2018, vol. 13 Search PubMed.
- R. Razavi, A. Bemani, A. Baghban, A. H. Mohammadi and S. Habibzadeh, Fuel, 2019, 243, 133–141 CrossRef CAS.
- A. Baghban, S. Habibzadeh and F. Zokaee Ashtiani, RSC Adv., 2020, 10, 22929–22938 RSC.
- S. Zhu, J. Li, L. Ma, C. He, E. Liu, F. He, C. Shi and N. Zhao, Mater. Lett., 2018, 233, 294–297 CrossRef CAS.
- H. Su, S. Lin, S. Deng, C. Lian, Y. Shang and H. Liu, Nanoscale Adv., 2019, 1, 2162–2166 RSC.
- İ. Güven and F. Şimşir, Comput. Ind. Eng., 2020, 147, 106678 CrossRef.
- V. Vapnik, Principles of risk minimization for learning theory, in Advances in neural information processing systems, 1992, pp. 831–838 Search PubMed.
- C. Cortes and V. Vapnik, Machine Learning, 1995, 20(3), 273–297 Search PubMed.
- V. Vapnik, S. E. Golowich and A. Smola, Support vector method for function approximation, regression estimation, and signal processing, Advances in Neural Information Processing Systems, 1997, vol. 2, pp. 281–287 Search PubMed.
- S. Dai, D. Niu and Y. Han, Appl. Sci., 2018, 8, 636 CrossRef.
- S. Mirjalili, S. M. Mirjalili and A. Lewis, Adv. Eng. Softw., 2014, 69, 46–61 CrossRef.
- S. Mirjalili, S. Saremi, S. M. Mirjalili and L. d. S. Coelho, Expert Syst. Appl., 2016, 47, 106–119 CrossRef.
- A. Naserbegi, M. Aghaie and A. Zolfaghari, Ann. Nucl. Energy, 2020, 148, 107703 CrossRef.
- P. Simon and Y. Gogotsi, Nat. Mater., 2008, 7, 845–854 CrossRef CAS PubMed.
- L. L. Zhang and X. S. Zhao, Chem. Soc. Rev., 2009, 38, 2520–2531 RSC.
- A. Chen, Y. Yu, T. Xing, R. Wang, Y. Li and Y. Li, Mater. Lett., 2015, 157, 30–33 CrossRef CAS.
- A. Baghban, M. Kahani, M. A. Nazari, M. H. Ahmadi and W.-M. Yan, Int. J. Heat Mass Transfer, 2019, 128, 825–835 CrossRef CAS.
- A. Baghban, M. N. Kardani and A. H. Mohammadi, Fuel, 2018, 232, 620–631 CrossRef CAS.
- A. Baghban, A. H. Mohammadi and M. S. Taleghani, Int. J. Greenhouse Gas Control, 2017, 58, 19–41 CrossRef CAS.
- M. Liu, Z. Zhang, M. Dou, Z. Li and F. Wang, Carbon, 2019, 151, 28–35 CrossRef CAS.
- K. Shi, J. Liu and R. Chen, J. Energy Storage, 2020, 31, 101609 CrossRef.
- A. Baghban and M. Adelizadeh, Fuel, 2018, 230, 344–354 CrossRef CAS.
- M. Zhou, A. Gallegos, K. Liu, S. Dai and J. Wu, Carbon, 2020, 157, 147–152 CrossRef CAS.
Footnote |
| † Electronic supplementary information (ESI) available. See DOI: 10.1039/d0ra09837j |
|
| This journal is © The Royal Society of Chemistry 2021 |
Click here to see how this site uses Cookies. View our privacy policy here.  Open Access Article
 *b,
Sajjad Habibzadeh
 *ac,
Ahmad Mohaddespourd and
Otman Abida
 d
d

 and the insensitivity loss function of ε, eqn (4) can be transformed into eqn (5):

 indicate Lagrange factors.


![[thin space (1/6-em)]](https://www.rsc.org/images/entities/char_2009.gif) 366.985
366.985


