 Open Access Article
Exploring the electrochemical performance of copper-doped cobalt–manganese phosphates for potential supercapattery applications†
Meshal Alzaid*a,
Muhammad Zahir Iqbal *b,
Saman Siddiqueb and
N. M. A. Hadiaa
aPhysics Department College of Science, Jouf University, P. O. Box 2014, Sakaka, Al Jouf, Saudi Arabia
bNanotechnology Research Laboratory, Faculty of Engineering Sciences, GIK Institute of Engineering Sciences and Technology, Topi 23640, Khyber Pakhtunkhwa, Pakistan. E-mail: zahir.upc@gmail.com; mmalzaid@ju.edu.sa
First published on 19th August 2021
Abstract
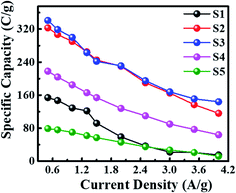
The significant electrochemical performance in terms of both specific energy and power delivered via hybrid energy storage devices (supercapattery) has raised their versatile worth but electrodes with flashing electrochemical conduct are still craved for better performance. In this work, binary and ternary metal phosphates based on copper, cobalt, and manganese were synthesized by a sonochemical method. Then, the compositions of copper and cobalt were optimized in ternary metal phosphates. The structural studies and morphological aspects of synthesized materials were scrutinized by X-ray diffraction and scanning electron microscopy. Furthermore, the electrochemical characterizations were performed in three- and two-cell configurations. The sample with equal compositions of copper and cobalt (50/50) demonstrates the highest specific capacity of 340 C g−1 at a current density of 0.5 A g−1 among all. This optimized composition was utilized as a positive electrode material in a supercapattery device that reveals a high specific capacity of 247 C g−1. The real device exhibits an excellent energy density of 55 W h kg−1 while delivering a power density of 800 W kg−1. Furthermore, the device was able to provide an outstanding specific power of 6400 W kg−1 while still exhibiting a specific energy of 19 W h kg−1. The stability potential of the device was tested for 2500 continuous charge and discharge cycles at 8 A g−1. Excellent capacitive retention of 90% was obtained, which expresses outstanding cyclic stability of the real device. A theoretical study was performed to investigate the capacitance and diffusion-controlled contribution in the device performance using Dunn's model. The maximum diffusion-controlled contribution of 85% was found at 3 mV s−1 scan rate. The study demonstrates the utilization of ternary metal phosphates as self-supported electrode materials for potential energy storage applications.
1. Introduction
The high rate exhaustion of fossil fuels and increasing energy consumption necessitate the search for renewable energy resources. To maintain a balance between energy demand and supply, progression toward advanced energy storage systems is equally required.1,2 Presently, electrochemical supercapacitors (SCs) are the emerging energy devices because of their properties such as rapid charge–discharge and enhanced power density with a long lifespan. The charge storage mechanism categorized them into two types, i.e. EDLCs in which charge stores due to physical adsorption and pseudocapacitors in which surface redox reactions within a finite potential range are involved. The low energy density of SCs as compared to other energy storage devices such as batteries limits their broader commercial applications. To address the mentioned limitation, it is necessary to design an efficient and high-performance energy storage device with increased energy density (to compete with the requirement) while retaining the high power density.3,4 This was accomplished via another class of SCs that are called hybrid supercapacitors, also termed supercapattery. In these devices, battery as well as capacitive grade electrode materials are constraints in a single device.5 This results in enhanced energy density due to the faradaic reaction (due to battery-grade material) and outstanding power density due to the non-faradaic charge storage phenomena (via insertion of capacitive material).6,7 For these superstitious merits, charge storage has gained vital interest of researchers at present.Different types of capacitive (negative electrode) and battery-grade (positive electrode) materials have been extensively utilized for hybrid SCs. Among EDLCs, carbon-enriched materials such as activated carbon,8,9 graphene,10,11 and its composites12 have been mostly utilized as active materials in the negative electrode. The most commonly used positive electrode materials are transition metal oxides,13–16 metal hydroxides,17,18 mixed metal sulfides,19–22 and phosphates.23–28 Among these materials, metal phosphates and phosphides have been explored as suitable candidates.29 Their low cost, chemical stability, redox-active nature, and excellent electrochemical properties make them more feasible for efficient SC devices.30 Among various phosphates and phosphides, manganese and cobalt phosphates are intensively studied for SC applications due to high capacitance, thermal and electrochemical stability, and excellent electrochemical activities.28,31–34 For example, Mirghni et al. synthesized MnPO4 nanorods via utilizing the hydrothermal process and investigated the behavior of MnPO4 by different mass loadings on graphene foam.31 The highest capacitance was found to be 270 F g−1 at 0.5 A g−1 using an operating voltage window of 1.4 V in 6 M KOH electrolyte. The material also demonstrates maximum capacity preservation of 96% after 10![[thin space (1/6-em)]](https://www.rsc.org/images/entities/char_2009.gif) 000 continuous cycles at 2 A g−1. Similarly, cobalt phosphates and phosphides were analyzed due to high electronic, magnetic and catalytic properties. Cobalt phosphates are excessively used for electrode materials in high-performance SC devices. Chen et al. reported the nano-flower-shaped CoP exhibiting a capacitance of 418 F g−1 at 1 A g−1.35 The energy and power densities were observed to be 8.8 W h kg−1 and 6 W kg−1, respectively, with good cyclic durability of 97% for 6000 cycles. Furthermore, along with other transition metals, copper phosphide also holds sound electrocatalytic properties. Chen et al. have synthesized copper phosphide nanotubes via an electro-oxidation route and investigated the electrochemical characteristics.36 The asymmetric device was designed by using the copper phosphide electrode as the anode, which delivers a significant specific energy of 44.6 W h kg−1 and a specific power of 17 kW kg−1 with cyclic stability of 81.9% after 5000 charge/discharge cycles. Inspired by the attractive properties of these metal phosphates, a drive toward mixed metal phosphate composite could result in an electrode material with flashing electrochemical performance and durability.
000 continuous cycles at 2 A g−1. Similarly, cobalt phosphates and phosphides were analyzed due to high electronic, magnetic and catalytic properties. Cobalt phosphates are excessively used for electrode materials in high-performance SC devices. Chen et al. reported the nano-flower-shaped CoP exhibiting a capacitance of 418 F g−1 at 1 A g−1.35 The energy and power densities were observed to be 8.8 W h kg−1 and 6 W kg−1, respectively, with good cyclic durability of 97% for 6000 cycles. Furthermore, along with other transition metals, copper phosphide also holds sound electrocatalytic properties. Chen et al. have synthesized copper phosphide nanotubes via an electro-oxidation route and investigated the electrochemical characteristics.36 The asymmetric device was designed by using the copper phosphide electrode as the anode, which delivers a significant specific energy of 44.6 W h kg−1 and a specific power of 17 kW kg−1 with cyclic stability of 81.9% after 5000 charge/discharge cycles. Inspired by the attractive properties of these metal phosphates, a drive toward mixed metal phosphate composite could result in an electrode material with flashing electrochemical performance and durability.
Herein, we present the synthesis of binary and ternary metal phosphates at different aspects ratios by the sonochemical technique. The structural and morphological studies were investigated by X-ray diffraction and scanning electron microscopy (SEM). Electrochemical characterizations were performed in a three-cell configuration to scrutinize the performance optimization of the synthesized materials. The electrode material with the finest electrochemical conduct was further utilized for supercapattery applications along with activated carbon. The fabricated device was electrochemically tested in a two-electrode assembly by different characterizations. The stability and durability of the device were also analyzed. Furthermore, theoretical studies based on Dunn's model were also performed to investigate the capacitance-controlled contribution. The study paves a new way to explore ternary metal phosphates for high-performance supercapattery applications.
2. Experimental methods
2.1. Materials
Copper(II) chloride (CuCl2), cobalt chloride (CoCl2. 6H2O), and manganese(II) chloride (MnCl2) were bought from MERCK. Potassium hydroxide (KOH), disodium hydrogen phosphate (Na2HPO4), hydrochloric acid (HCl), ethanol, N-methyl-2-pyrrolidone (NMP), N-poly-vinylidene fluoride (PVDF), acetone, activated carbon (AC), and carbon black were purchased from Sigma Aldrich. Nickel foam was procured from Urich Technology, Malaysia. Deionized (DI) water was purchased from a scientific store for the preparation of precursor solutions and electrolytes.The electrochemical performance of the as-prepared samples was evaluated in a three-electrode configuration, where a Pt wire and a Hg/HgO electrode purchased from ALS Co., Ltd, Japan were utilized as the counter and reference electrodes respectively.
2.2. Synthesis of binary metal phosphates
Initially, binary metal phosphates (CuMnPO4) and (CoMnPO4) were synthesized by adopting the sonochemical technique. To synthesize CuMnPO4, a 0.3 M solution of Na2HPO4 was made in 50 ml DI water. Two separate precursor solutions of 0.5 M CuCl2 and 0.5 M MnCl2 were prepared and mixed in an ultrasonic bath. The precursor solution was then placed in a probe sonicator and a Na2HPO4 solution was added dropwise. The process goes on for 45 minutes with an ultrasonic wave amplitude of 30%. A colloidal solution was obtained, which was centrifuged to collect the synthesized material. After washing several times with DI water and acetone to remove residue, the material was obtained and dried in a muffle furnace at 60 °C.37 The dried material was calcined at 400 °C for 3 hours and named S1. Similarly, CoMnPO4 was also prepared using 0.5 M CoCl2 instead of CuCl2, and the sample was named S5.2.3. Synthesis of ternary metal phosphates
To accomplish the synthesis of copper-doped cobalt–manganese phosphates (ternary phosphate), a solution of MnCl2, CoCl2, and CuCl2 was prepared with a molar ratio of 1![[thin space (1/6-em)]](https://www.rsc.org/images/entities/char_2009.gif) :
:![[thin space (1/6-em)]](https://www.rsc.org/images/entities/char_2009.gif) 0.75
0.75![[thin space (1/6-em)]](https://www.rsc.org/images/entities/char_2009.gif) :
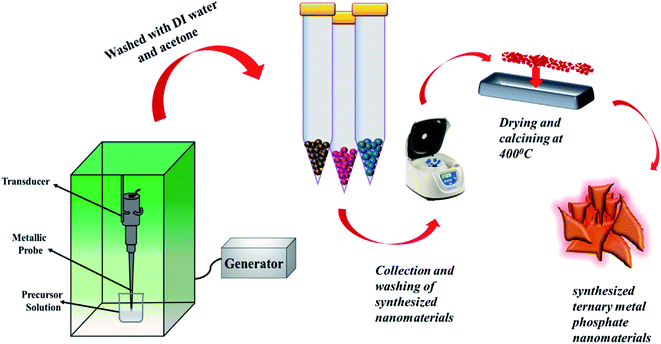
:![[thin space (1/6-em)]](https://www.rsc.org/images/entities/char_2009.gif) 0.25 and mixed to make a 50 ml solution. This precursor solution was subjected to probe sonication and the Na2HPO4 solution was added drop by drop into it. The process was prolonged for 45 minutes. Later on, the material was collected, washed and then dried overnight at 60 °C. The obtained material was further calcined at 400 °C for 3 hours. The synthesized Cu0.50Mn0.50PO4 was named S2. The molar concentration of MnCl2 was kept fixed and the amount of CoCl2 and CuCl2 was varied in the precursor solution. The same strategy was followed for the preparation of S3 and S4 with different compositions of cobalt and copper (Co0.50Cu0.50MnPO4 and Co0.25Cu0.75MnPO4). Table S1† represents the names of different samples along with their concentrations. The synthesis route is schematically illustrated in Fig. 1.
0.25 and mixed to make a 50 ml solution. This precursor solution was subjected to probe sonication and the Na2HPO4 solution was added drop by drop into it. The process was prolonged for 45 minutes. Later on, the material was collected, washed and then dried overnight at 60 °C. The obtained material was further calcined at 400 °C for 3 hours. The synthesized Cu0.50Mn0.50PO4 was named S2. The molar concentration of MnCl2 was kept fixed and the amount of CoCl2 and CuCl2 was varied in the precursor solution. The same strategy was followed for the preparation of S3 and S4 with different compositions of cobalt and copper (Co0.50Cu0.50MnPO4 and Co0.25Cu0.75MnPO4). Table S1† represents the names of different samples along with their concentrations. The synthesis route is schematically illustrated in Fig. 1.
2.4. Electrode preparation
The working electrode was prepared by making a slurry containing 75 wt% as-synthesized material, 15 wt% acetylene black (carbon black), and 10 wt% PVDF as a binder. The homogeneous slurry after continuous stirring for 9 hours was deposited on 1 × 1 cm2 of Ni foam and placed in a muffle furnace at 90 °C for 8 hours. All electrochemical measurements were conducted in 1 M KOH electrolyte.3. Results and discussion
The characterization techniques were conducted to investigate the surface morphology, structure, and electrochemical behavior of the synthesized material which are as follows:3.1. Structural characterization
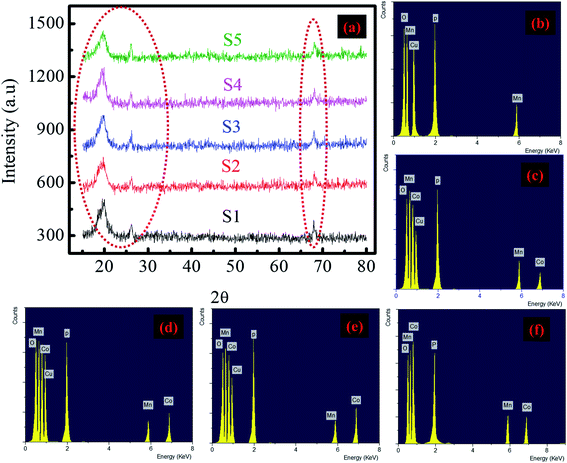
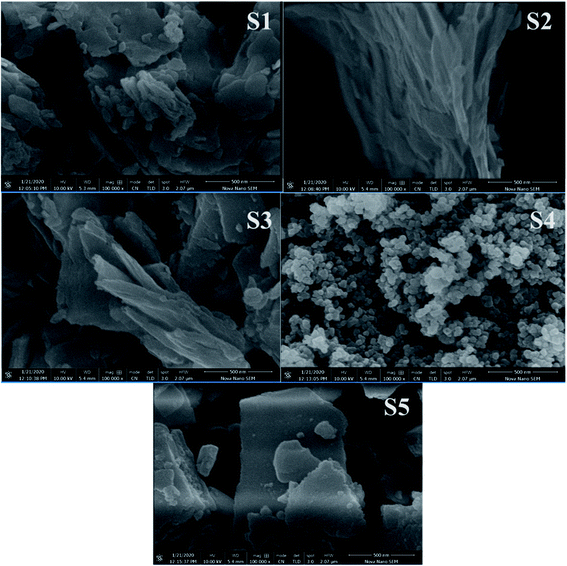
Morphological and structural characterizations were performed to investigate the phase and crystallinity of the synthesized material by scanning electron microscopy (FESEM) (JEOL JSM-7600F) and X-ray diffraction (XRD) (Bruker axis D8 Advance diffractometer, Germany) with a wavelength of 1.5406 Å at 40 kV.3.2. Electrochemical characterization
To evaluate the electrochemical behavior of the synthesized material for practical applications of SCs, electrochemical measurements were conducted using a potentiostat/galvanostat (Gamry Reference 3000). For the evaluation of electrochemical measurements, two types of electrode configurations were used: two-electrode assembly and three-electrode assembly.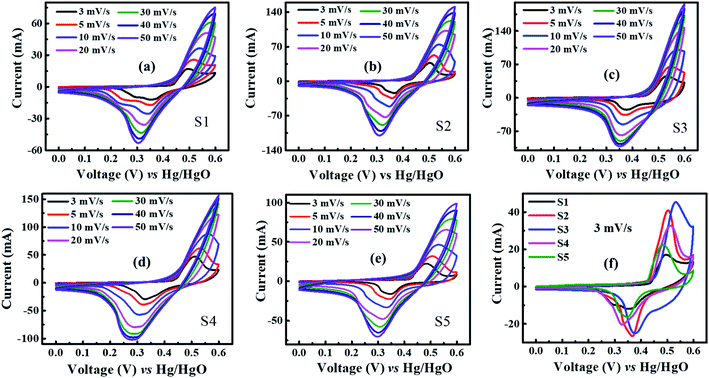 | ||
| Fig. 4 CV plots of (a) S1, (b) S2, (c) S3, (d) S4, (e) S5, and (f) comparison cyclic voltammogram of all samples at 3 mV s−1. | ||
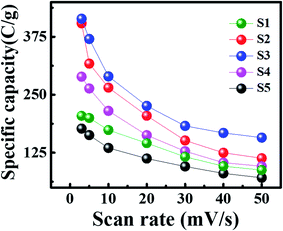
The specific capacity is extracted from CV curves using the following formula:
 | (1) |
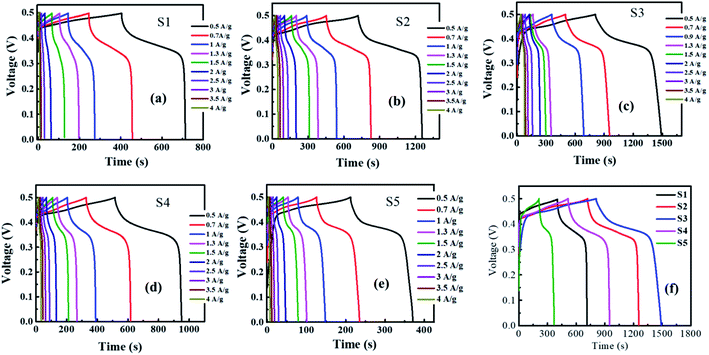 | ||
| Fig. 6 GCD graphs of (a) S1, (b) S2, (c) S3, (d) S4, (e) S5, and (f) comparison of GCD curves of all samples. | ||
The specific capacity was calculated from GCD plots using the following equation:27
 | (2) |
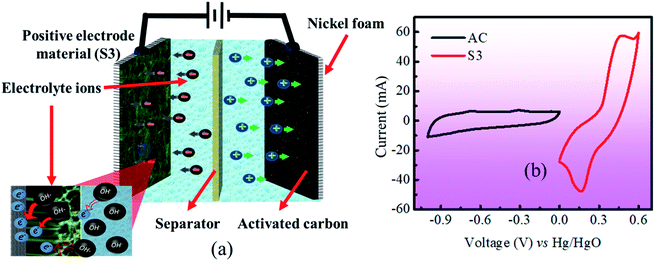 | ||
| Fig. 9 (a) Schematic of asymmetric supercapattery device and (b) CV plots of activated carbon and mixed metal phosphates. | ||
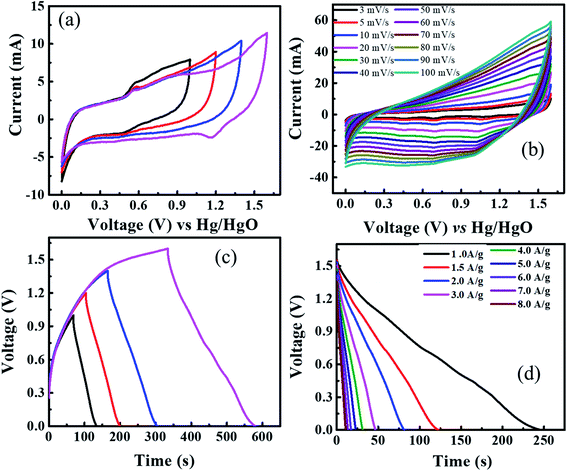
Fig. 10(a) shows the cyclic voltammogram of supercapattery device at different voltage windows to optimize the maximum operating voltage range. The CV graphs of supercapattery devices using different operating voltages range up to 0–1.6 V. The CV spectrum contains both EDLC and battery grade behavior due to asymmetric device architecture. Moreover, no distortion in CV shape evinces the reliability of this broad potential window of 0–1.6 V. The CV measurements of the real device are performed at different sweep rates from 3 to 100 mV s−1, and cyclic voltammogram is presented in Fig. 10(b). It can be seen that the real device maintains its CV shape even up to higher sweep rates. This suggests good rate capability and electrochemical stability of the supercapattery device.
Similarly, GCD measurements for the supercapattery device, performed at different potential windows, are represented in Fig. 10(c). This again affirms that the reliable voltage range for GCD measurements is 0–1.6 V. The GCD measurements within a voltage window of 0–1.6 V are performed at multiple values of current densities from 1 to 8 A g−1. The discharge curves are shown in Fig. 10(d). The nonlinear nature of discharge curves due to the presence of little humps in the curve confirms the incorporation of both faradaic and non-faradaic reactions due to asymmetric device architecture. The specific capacity of the device was evaluated using the GCD outcomes at different. The specific capacity of the supercapattery device was found to be 247 C g−1 at 1 A g−1 current density.
Specific energy and power of the device were calculated using the following equations:26
 | (3) |
 | (4) |
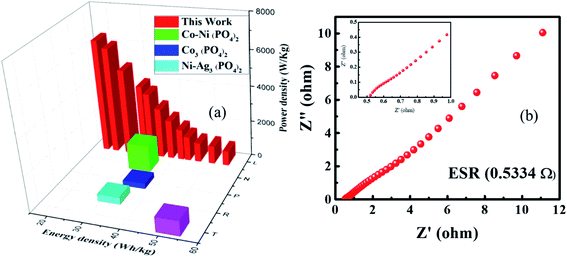 | ||
| Fig. 11 (a) Specific energy and specific power of real device. (b) Nyquist plot of supercapattery device. | ||
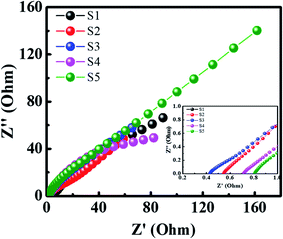
Furthermore, the ESR and conductivity of the supercapattery device were evaluated by EIS measurements in the frequency range of 0.1 Hz to 105 Hz, as illustrated in Fig. 11(b). A low ESR value of 0.533 ohms (shown in inset) was observed, which reveals that the device exhibits excellent conductance properties. Besides, a small semicircle depicts the low Rct value of the device.
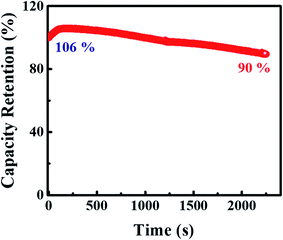
Moreover, the electrochemical stability of the device is tested for continuous cyclic charge and discharge for 2500 cycles at 8 A g−1 (ref. 44) demonstrated in Fig. 12. It is evident that for the first 100 cycles, the device gets fully activated giving total capacitive retention of 106% and after 100 cycles, the device shows a gradual decline giving capacitive retention of 90% after 2500 cycles. Moreover, the b-value fitting of the device is also performed and illustrated in Fig. S3.† The device expresses the b value ranging from 0.59 to 0.64, which braces the supercapattery nature.
Furthermore, charge kinetics in the supercapattery device was explored via a theoretical approach16 using the following equation:
| i(ν) = k1ν + k2ν1/2 | (5) |
The equation indicates the total charge storage capacity of the supercapattery device as the sum of capacitive k1ν and diffusion-controlled k2ν1/2 contributions.
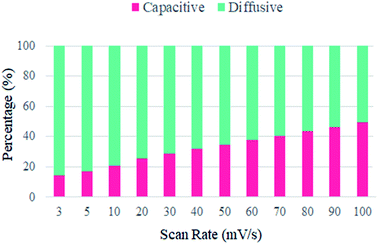
The bar chart in Fig. 13 represents the percentage contribution of capacitance and diffusion-controlled processes at different scan rates. It can be seen that at low scan rates, the diffusion-controlled contribution is dominant because of the excessive redox reaction, whereas, at a higher scan rate, ion could not get enough time to complete the reaction, and hence, the capacitive contribution dominates. The maximum diffusion-controlled contribution is 85% at the lowest scan rate and the overall diffusion-controlled contribution is dominant in the total device capacity, which confirms the major contribution of the synthesized battery-grade material in the fabricated supercapattery device.
4. Conclusion
In summary, Cu–Co–Mn-based binary and ternary phosphates with different concentrations were synthesized via a sonochemical route. Initially, binary metal phosphates were synthesized and then the compositions of copper and cobalt were optimized in ternary metal phosphates. The composition Co0.5Cu0.5Mn(PO4)2 exhibits the significant electrochemical performance in a three-electrode assembly via providing a specific capacity of 340 C g−1 at 0.5 A g−1. The optimized electrode material was then utilized to fabricate a supercapattery device, which illustrates the maximum capacity of 247 C g−1 at 1 A g−1 in a two-electrode assembly. The device also provides a remarkable specific energy and power of 55 W h kg−1 and 800 W kg−1 respectively at 1 A g−1. Furthermore, the device was able to provide an outstanding specific power of 6400 W kg−1 while still exhibiting a specific energy of 19 W h kg−1. This real device also expresses capacity preservation of 90% after 2500 consecutive GCD cycles. Furthermore, the capacitance-controlled study of the supercapattery device was performed theoretically using Dunn's model, which deduced that the device exhibits an 85% diffusion-controlled contribution at 3 mV s−1. Our study provides an effective progression toward the study of mixed metal phosphate-based electrode materials for high-performance supercapattery devices.Author contributions
M. A. and M. Z. I. designed the study. S. S. and M. Z. I. performed the experiment. M. Z. I. and M. A. analyzed the data, wrote the manuscript and critically reviewed the manuscript. N. M. A. H. helped in analysis of data.Conflicts of interest
The authors declare no financial conflict of interest.Acknowledgements
The authors extend their appreciation to the Deanship of Scientific Research at Jouf University for funding this work through research grant no. (DSR-2021-03-0238).References
- A. Noori, M. F. El-Kady, M. S. Rahmanifar, R. B. Kaner and M. F. Mousavi, Chem. Soc. Rev., 2019, 48, 1272–1341 RSC.
- M. Z. Iqbal and S. Siddique, Int. J. Hydrogen Energy, 2018, 43, 21502–21523 CrossRef CAS.
- P. Simon, Y. Gogotsi and B. Dunn, Science, 2014, 343, 1210–1211 CrossRef CAS PubMed.
- D. P. Dubal, O. Ayyad, V. Ruiz and P. Gomez-Romero, Chem. Soc. Rev., 2015, 44, 1777–1790 RSC.
- M. Z. Iqbal, J. Khan, H. T. A. Awan, M. Alzaid, A. M. Afzal and S. Aftab, Dalton Trans., 2020, 49, 16715–16727 RSC.
- B. Akinwolemiwa, C. Peng and G. Z. Chen, J. Electrochem. Soc., 2015, 162, A5054–A5059 CrossRef CAS.
- G. Z. Chen, Prog. Nat. Sci.: Mater. Int., 2013, 23, 245–255 CrossRef.
- S. Yaglikci, Y. Gokce, E. Yagmur and Z. Aktas, Environ. Technol., 2020, 41, 36–48 CrossRef CAS PubMed.
- S.-K. Chang and Z. Zainal, in Synthesis, Technology and Applications of Carbon Nanomaterials, Elsevier, 2019, pp. 309–334 Search PubMed.
- W. K. Chee, H. N. Lim, Z. Zainal, N. M. Huang, I. Harrison and Y. Andou, J. Phys. Chem. C, 2016, 120, 4153–4172 CrossRef CAS.
- P. Luo, X. Guan, Y. Yu, X. Li and F. Yan, Nanomaterials, 2019, 9, 201 CrossRef CAS PubMed.
- Z. Yang, J. Tian, Z. Yin, C. Cui, W. Qian and F. Wei, Carbon, 2019, 141, 467–480 CrossRef CAS.
- L. Wang, X. Xie, K. N. Dinh, Q. Yan and J. Ma, Coord. Chem. Rev., 2019, 397, 138–167 CrossRef CAS.
- Y. Liu, C. Xiang, H. Chu, S. Qiu, J. McLeod, Z. She, F. Xu, L. Sun and Y. Zou, J. Mater. Sci. Technol., 2020, 37, 135–142 CrossRef.
- D.-G. Wang, Z. Liang, S. Gao, C. Qu and R. Zou, Coord. Chem. Rev., 2020, 404, 213093 CrossRef CAS.
- M. Z. Iqbal, S. S. Haider, S. Siddique, M. R. A. Karim, S. Zakar, M. Tayyab, M. M. Faisal, M. Sulman, A. Khan and M. Baghayeri, J. Energy Storage, 2020, 27, 101056 CrossRef.
- H. Liang, T. Lin, S. Wang, H. Jia, C. Li, J. Cao, J. Feng, W. Fei and J. Qi, Dalton Trans., 2020, 49, 196–202 RSC.
- G. Xia and S. Wang, Ceram. Int., 2019, 45, 20810–20817 CrossRef CAS.
- W. Chen, P. Yuan, S. Guo, S. Gao, J. Wang, M. Li, F. Liu, J. Wang and J. Cheng, J. Electroanal. Chem., 2019, 836, 134–142 CrossRef CAS.
- W. Liu, H. Niu, J. Yang, K. Cheng, K. Ye, K. Zhu, G. Wang, D. Cao and J. Yan, Chem. Mater., 2018, 30, 1055–1068 CrossRef CAS.
- X. Y. Yu and X. W. Lou, Adv. Energy Mater., 2018, 8, 1701592 CrossRef.
- M. Z. Iqbal and J. Khan, Electrochim. Acta, 2021, 368, 137529 CrossRef CAS.
- R. Bendi, V. Kumar, V. Bhavanasi, K. Parida and P. S. Lee, Adv. Energy Mater., 2016, 6, 1501833 CrossRef.
- X. Li, A. M. Elshahawy, C. Guan and J. Wang, Small, 2017, 13, 1701530 CrossRef PubMed.
- X. Li, X. Xiao, Q. Li, J. Wei, H. Xue and H. Pang, Inorg. Chem. Front., 2018, 5, 11–28 RSC.
- M. Z. Iqbal, M. M. Faisal, S. R. Ali, A. M. Afzal, M. R. A. Karim, M. A. Kamran and T. Alharbi, Ceram. Int., 2020, 46, 10203–10214 CrossRef CAS.
- M. Z. Iqbal, A. Khan, A. Numan, S. S. Haider and J. Iqbal, Ultrason. Sonochem., 2019, 59, 104736 CrossRef CAS PubMed.
- M. Z. Iqbal, J. Khan, S. Siddique, A. M. Afzal and S. Aftab, Int. J. Hydrogen Energy, 2021, 46, 15807–15819 CrossRef CAS.
- S. Alam, M. Z. Iqbal and J. Khan, Int. J. Energy Res., 2021, 45, 11109–11122 CrossRef CAS.
- M. Pramanik, R. R. Salunkhe, M. Imura and Y. Yamauchi, ACS Appl. Mater. Interfaces, 2016, 8, 9790–9797 CrossRef CAS PubMed.
- A. A. Mirghni, M. J. Madito, T. M. Masikhwa, K. O. Oyedotun, A. Bello and N. Manyala, J. Colloid Interface Sci., 2017, 494, 325–337 CrossRef CAS PubMed.
- K. Raju, H. Han, D. B. Velusamy, Q. Jiang, H. Yang, F. P. Nkosi, N. Palaniyandy, K. Makgopa, Z. Bo and K. I. Ozoemena, ACS Energy Lett., 2019, 5, 23–30 CrossRef.
- H. C. Chen, S. Jiang, B. Xu, C. Huang, Y. Hu, Y. Qin, M. He and H. Cao, J. Mater. Chem. A, 2019, 7, 6241–6249 RSC.
- M. Z. Iqbal, J. Khan, A. M. Afzal and S. Aftab, Electrochim. Acta, 2021, 138358 CrossRef CAS.
- X. Chen, M. Cheng, D. Chen and R. Wang, ACS Appl. Mater. Interfaces, 2016, 8, 3892–3900 CrossRef CAS PubMed.
- Y.-C. Chen, Z.-B. Chen, Y.-G. Lin and Y.-K. Hsu, ACS Sustainable Chem. Eng., 2017, 5, 3863–3870 CrossRef CAS.
- N. Duraisamy, N. Arshid, K. Kandiah, J. Iqbal, P. Arunachalam, G. Dhanaraj, K. Ramesh and S. Ramesh, J. Mater. Sci.: Mater. Electron., 2019, 30, 7435–7446 CrossRef CAS.
- J. Theerthagiri, K. Thiagarajan, B. Senthilkumar, Z. Khan, R. A. Senthil, P. Arunachalam, J. Madhavan and M. Ashokkumar, ChemistrySelect, 2017, 2, 201–210 CrossRef CAS.
- Y. Zhao and C.-a. Wang, J. Alloys Compd., 2016, 677, 281–287 CrossRef CAS.
- Y. Zhao, S. Li and C.-a. Wang, ECS J. Solid State Sci. Technol., 2015, 5, M5 CrossRef.
- Y. Zhao and C.-A. Wang, Mater. Des., 2016, 97, 512–518 CrossRef CAS.
- Y.-H. Dai, L.-B. Kong, K. Yan, M. Shi, Y.-C. Luo and L. Kang, Ionics, 2016, 22, 1461–1469 CrossRef CAS.
- B. Mahmoud, A. Mirghni, K. Oyedotun, D. Momodu, O. Fasakin and N. Manyala, J. Alloys Compd., 2020, 818, 153332 CrossRef CAS.
- X. Peng, H. Chai, Y. Cao, Y. Wang, H. Dong, D. Jia and W. Zhou, Mater. Today Energy, 2018, 7, 129–135 CrossRef.
Footnote |
| † Electronic supplementary information (ESI) available. See DOI: 10.1039/d0ra09952j |
| This journal is © The Royal Society of Chemistry 2021 |

