 Open Access Article
Impact of synthesis route on structural, magnetic, magnetocaloric and critical behavior of Nd0.6Sr0.4MnO3 manganite
M. Jeddi *a,
J. Massoudi
 a,
H. Gharsallahab,
Sameh I. Ahmedc,
E. Dhahri
 a and
E. K. Hlild
aLaboratoire de Physique Appliquée, Faculté des Sciences, Université de Sfax, B. P. 1171, 3000 Sfax, Tunisia. E-mail: marwajeddi@gmail.com
bInstitut Préparatoire aux Études d'Ingénieur de Sfax, Université de Sfax, B. P. 1172, 3018 Sfax, Tunisia
cDepartment of Physics, College of Science, Taif University, P. O. Box 11099, Taif 21944, Saudi Arabia
dInstitut Néel, CNRS, Université J. Fourier, B. P. 166, 38042 Grenoble, France
First published on 11th February 2021
Abstract
Nd0.6Sr0.4MnO3 polycrystalline manganite was synthesized by two different methods: the auto-combustion reaction (NSMO-AC) and the sol–gel method (NSMO-SG). The structural, magnetic, magnetocaloric and critical behavior of the samples were examined. Rietveld refinements of the XRD patterns revealed that both compounds are pure single phase indexed to the orthorhombic system adopting the Pnma space group. The nanometric size estimated using the Williamson–Hall method was confirmed by TEM micrographs. Magnetic measurements as a function of temperature indicated that both samples underwent a second order ferromagnetic (FM)–paramagnetic (PM) phase transition at Curie temperature (TC). The relative cooling power was observed to be around 95.271 J kg−1 for NSMO-AC and 202.054 J kg−1 for NSMO-SG at μ0H = 5 T, indicating that these materials are potential candidates for magnetic refrigeration application close to room temperature. The critical behavior was estimated using diverse techniques based on the isothermal magnetization data recorded around the critical temperature TC. The calculated values are fully satisfactory to the requirements of the scaling theory, implying their reliability. The estimated critical exponents matched well with the values anticipated for the mean-field model and the 3D Ising model for NSMO-AC and NSMO-SG, respectively, showing that the magnetic interactions depended on the process of elaboration.
1. Introduction
The serious environmental problems and daily energy demands are crucial subjects that whetted the interest of the scientific and engineering communities, with a view of creating new nontoxic, inexpensive, stable, and efficient technologies to solve these issues.1 Based on the magnetocaloric effect (MCE), magnetic refrigeration is regarded as the new potential cooling technology that is environmentally friendly and energy efficient.2,3 The MCE is defined as the tendency of the magnetic system to cool down or heat up owing to the variation in the magnetic field.4 This type of refrigeration has drawn a great deal of attention from several researchers for its promising applications near room temperature, its high efficiency, as well as its ecological cleanliness.5 Notably, it significantly competes with the conventional gas-compression refrigeration, which is normally responsible for damaging our living environment.6Nowadays, intensive research activities attempt to explore new magnetic materials presenting optimal magnetocaloric properties near room temperature as the most efficient refrigerant materials in the field of magnetic cooling technologies.7–9 Perovskite-based manganites of compositional formula (RE1−xAx)MnO3, where RE is a trivalent rare earth atom and A is a divalent alkaline earth one,10–12 can be considered as good competitors for other magnetocaloric materials. This interest is due to their powerful ability to be exploited in different fields.13–20 There are several robust arguments that emphasize the fact that this class of compounds will fulfill an impressive contribution in the emerging technologies21 given that their critical temperature can be adjusted by substitution; their preparation is relatively easy and their cost is lower than that of gadolinium, which is considered as a reference.22–24 Among these materials, only lanthanum manganites have been fully characterized with a deeper investigation into the structural and magnetic properties.25–27 Neodymium-based manganites seem to be very promising magnetocaloric candidates28,29 owing to the reason that the magnitude of their magnetic entropy change and the value of their transition temperature can be strongly tuned by controlling their microstructure and their chemical composition following the preparation method.30
As the magnetocaloric properties of manganites were examined only to a limited extent, the exploration of other systems and new elaboration process inducing an improvement in the magnetocaloric effect is still under the initial stage.31,32 Different methods, such as solid state reaction,33–36 chemical co-precipitation,37–39 and sol–gel method40–43 are available for the synthesis of RE manganites with a perovskite-like structure. The methods of synthesis play a significant role in the formation of the required crystal structure, the control of the crystallite size, and the contribution of magnetic interactions.
The sol–gel route is a classic soft chemistry process, mainly explored in the context of nanometric manganites, which lead to convincing results in terms of particle size. However, calcination is an important step to induce the good crystallization of materials and to remove foreign impurities. This step determines the final dimension of objects and generates sintering phenomena.44,45 The auto-combustion reaction cannot be described as a soft chemistry process as the temperatures reached during autoignition are very high. However, the fact that the transition from the liquid state to the solid state is very fast allows access to crystallized and single-phase materials with very small sizes, which eliminate the need for a subsequent annealing step.46,47 Therefore, this phenomenon would constitute a major advantage as far as the sol–gel process is concerned. The synthesis by auto-combustion is a promising technique because it is fast and requires simple equipment and low processing time. It favors high product crystallinity, homogeneous chemical composition, small particle size and narrow particle size dispersion.48 The reagents are inexpensive, the dopants can be easily integrated into the final product, and multiple steps are not involved.
Motivated by these considerations, a detailed investigation of the structural, magnetic, magnetocaloric, and critical behavior of strontium-doped neodymium manganite Nd0.6Sr0.4MnO3 synthesized by the auto-combustion process and the sol–gel method is reported.
2. Experiment
2.1. Synthesis
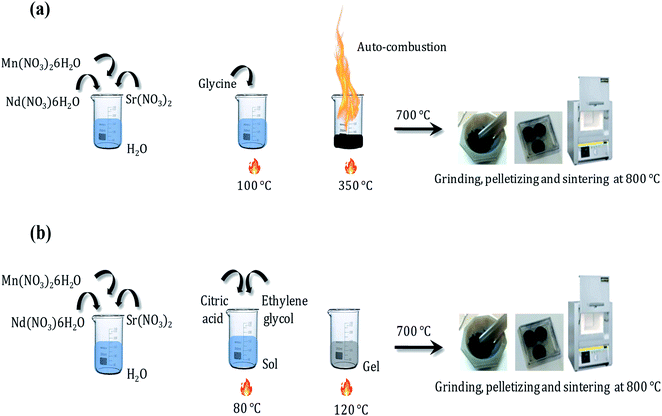
The Nd0.6Sr0.4MnO3 sample was prepared using two different methods: the auto-combustion reaction (NSMO-AC) and the sol–gel method (NSMO-SG).![[thin space (1/6-em)]](https://www.rsc.org/images/entities/char_2009.gif) :
:![[thin space (1/6-em)]](https://www.rsc.org/images/entities/char_2009.gif) 1 (nitrate
1 (nitrate![[thin space (1/6-em)]](https://www.rsc.org/images/entities/char_2009.gif) :
:![[thin space (1/6-em)]](https://www.rsc.org/images/entities/char_2009.gif) glycine).51 During heating, the water gradually vaporized, and a transparent viscous gel was formed. At a critical temperature (≈350 °C), autoignition occurred and the combustion lasted for only a few seconds. Relatively, plenty of foam was produced. Finally, the obtained powder was preheated at 700 °C for about 30 min to eliminate the residual organic matter and sintered at 800 °C for 12 h and pressed into pellets.
glycine).51 During heating, the water gradually vaporized, and a transparent viscous gel was formed. At a critical temperature (≈350 °C), autoignition occurred and the combustion lasted for only a few seconds. Relatively, plenty of foam was produced. Finally, the obtained powder was preheated at 700 °C for about 30 min to eliminate the residual organic matter and sintered at 800 °C for 12 h and pressed into pellets.
2.2. Characterization
The XRD patterns of NSMO-AC and NSMO-SG compounds were recorded at room temperature by using the powder X-ray diffraction technique with CuKα radiation (λ = 1.5406 Å). The data were collected in the range of 20° ≤ 2θ ≤ 80° by a step scanning of 0.015°. The structure and phase purity were examined by using the FullProf program.52 The surface morphology observation and the grain size determination were performed using transmission electron microscopy (TEM). The elemental composition of the elaborated specimens was verified by the energy dispersive X-ray analysis (EDAX). The measurements of magnetization versus temperature M(T) were obtained under an applied magnetic field of 0.05 T at a temperature ranging from 5 to 350 K. The measurements of magnetization versus magnetic field M(μ0H) were carried out at different temperatures with the magnetic fields varying from 0 to 5 T.3. Results and discussion
3.1. Structural and morphological study
Fig. 2a introduces the Rietveld refinements of the XRD patterns of NSMO-AC and NSMO-SG samples synthesized by the auto-combustion reaction and the sol–gel method, respectively. Both compounds are single phase without any detectable foreign impurities. The diffraction peaks are satisfactorily crystallized in the orthorhombic system with Pnma space group. Fig. 2b illustrates the crystal structure of the samples under investigation. The obtained unit cell values of each compound are presented in Table 1.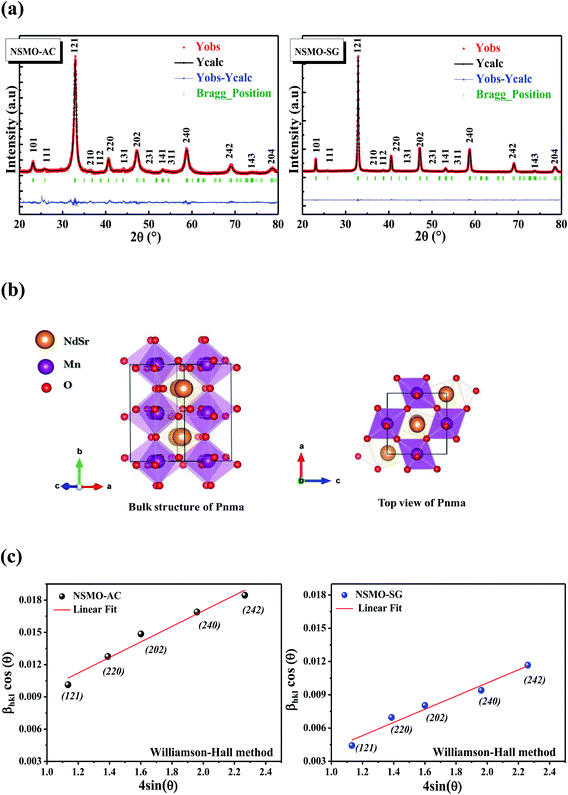 | ||
| Fig. 2 (a) Rietveld refinement of the X-ray diffraction patterns, (b) crystal structure and (c) Williamson–Hall plot of NSMO-AC and NSMO-SG compounds. | ||
| Compound | NSMO-AC | NSMO-SG |
| Space group | Pnma | Pnma |
| a (Å) | 5.44243 | 5.44086 |
| b (Å) | 7.66322 | 7.68139 |
| c (Å) | 546654 | 5.46634 |
| V (Å3) | 227.990 | 228.457 |
| 〈dMn–O〉 (Å) | 1.96 | 1.95 |
| 〈θMn–O–Mn〉 (°) | 160.30 | 161.08 |
| DWS (nm) | 18 | 25 |
| DTEM (nm) | 32 | 61 |
| χ2 (%) | 1.68 | 1.34 |
The average crystallite size was determined according to the Williamson–Hall approach using the following relation:53–55
 | (1) |
Fig. 2c represents the (β![[thin space (1/6-em)]](https://www.rsc.org/images/entities/char_2009.gif) cos
cos![[thin space (1/6-em)]](https://www.rsc.org/images/entities/char_2009.gif) θ) (y-axis) vs. (4
θ) (y-axis) vs. (4![[thin space (1/6-em)]](https://www.rsc.org/images/entities/char_2009.gif) sin
sin![[thin space (1/6-em)]](https://www.rsc.org/images/entities/char_2009.gif) θ) (x-axis) data related to the most intense peaks of NSMO-AC and NSMO-SG samples. The crystallite size DWH was deduced from the y-intercept of the linearly fitted data, and the microstrain ε is deduced from the slope. The DWH and ε values were, respectively, equal to 18 nm and 0.0008 for NSMO-AC and 25 nm and 0.0003 for NSMO-SG.
θ) (x-axis) data related to the most intense peaks of NSMO-AC and NSMO-SG samples. The crystallite size DWH was deduced from the y-intercept of the linearly fitted data, and the microstrain ε is deduced from the slope. The DWH and ε values were, respectively, equal to 18 nm and 0.0008 for NSMO-AC and 25 nm and 0.0003 for NSMO-SG.
The surface TEM micrographs of the aforementioned compounds are exemplified in the inset of Fig. 3a. It is worth noticing that the shape of the particles differed based on the synthesis route. The size distribution of the grains analyzed quantitatively by fitting the histogram according to a Lorentzian function is depicted in Fig. 3a. The mean diameters of NSMO-AC and NSMO-SG compounds were around 32 and 61 nm, respectively. The particle size determined from the TEM image was higher than that estimated by the XRD experiment, which can be elucidated by the fact that each particle analyzed by TEM was composed of numerous different crystallized grains.
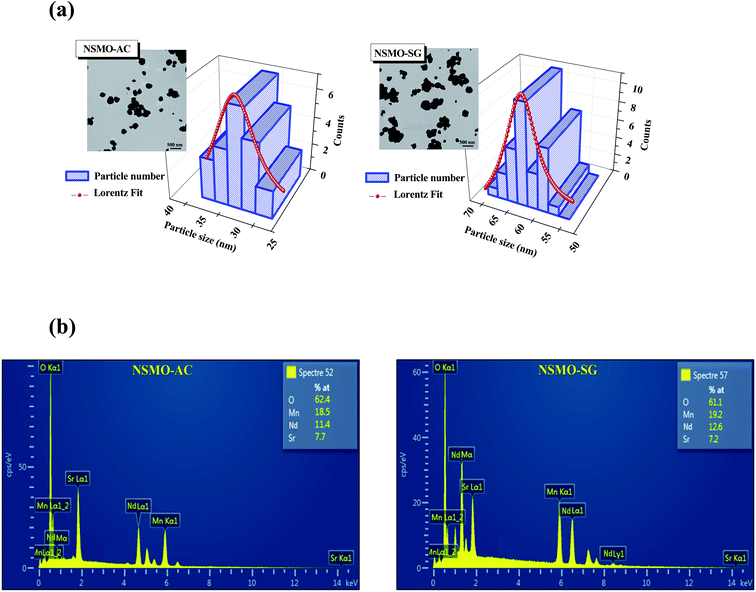 | ||
| Fig. 3 (a) Size distribution histogram of NSMO-AC and NSMO-SG compounds. The inset presents the TEM image, (b) EDAX analysis spectrum. | ||
Fig. 3b exhibits the EDAX spectra of NSMO-AC and NSMO-SG compounds, respectively. The analysis was performed on several zones. All the ingredients incorporated within the synthesis (Nd, Sr, Mn, and O) were present. One can see that there are no impurities. The composition of the compound was identical to the desired one.
3.2. Magnetic study
Fig. 4 displays the temperature dependence of the magnetization data M(T) carried out at μ0H = 0.05 T for NSMO-AC and NSMO-SG specimens. With an increase in the temperature, both the samples underwent a clear ferromagnetic (FM)–paramagnetic (PM) phase transition at Curie temperature (TC). The obtained TC values, equivalent to the minimum of (dM/dT) plot, were 100 and 270 K for NSMO-AC and NSMO-SG samples, respectively. It could be observed that the M(T) curve of the NSMO-AC compound exhibited a drop in the magnetic moment, revealing that the FM order was weaker than that of the NSMO-SG compound.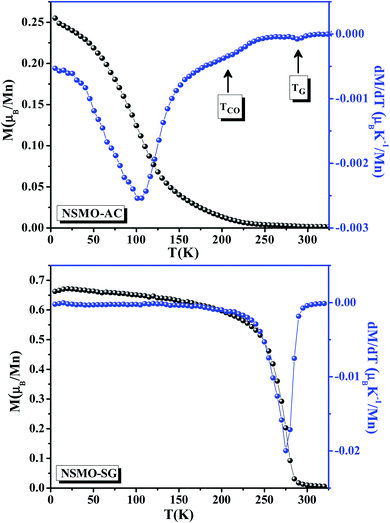 | ||
| Fig. 4 Magnetization (M) vs. temperature and the plot of dM/dT at μ0H = 0.05 T of NSMO-AC and NSMO-SG compounds. | ||
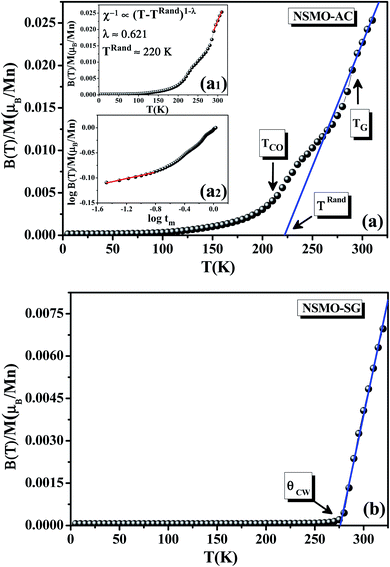
Fig. 5 presents the temperature dependence of the inverse magnetic susceptibility χ−1(T) data. The solid blue line was the best fit of Curie Weiss law in the PM region defined as follow:56,57
 | (2) |
For the NSMO-AC sample (Fig. 5a), the χ−1(T) curve showed a downturn deviation from the Curie Weiss law indicating the existence of a Griffiths phase (GP),58–60 which corresponded to the appearance of the FM clusters within the PM region in the temperature range TRand ≤ T ≤ TGP, thereby defining the Griffiths regime. TGP was the temperature at which the χ−1(T) curve deviated from the Curie Weiss law called the Griffiths temperature.61 This was also illustrated by the dM/dT plot (Fig. 4). TRand was the critical temperature of a random FM state called the random transition temperature.62 TRand was equivalent to the Curie Weiss temperature (θCW).
The GP was characterized by an exponent λ, defined by the following equation:
| χ−1(T) ∝ (T − TRand)1−λ; (0 ≤ λ < 1) | (3) |
The double logarithmic plot of (χ−1) vs. tm, tm = T/TRand − 1, reproduced in Fig. 5a2, shows a linear behavior at low tm values. This result confirms the proposed GP.64
The observed slope change, as marked in Fig. 5a, is ascribed to the presence of a charge ordering state (CO).65,66 As reported in a previous study,67 the CO transition refers basically to the appearance of an antiferromagnetic (AFM) ordering phase which makes the inverse susceptibility curves plotted upward. TCO is the CO transition temperature (Table 2). It could also be determined from the conspicuous kink in the dM/dT plot (Fig. 4).
However, for the NSMO-SG sample (Fig. 5b), there was no obvious observable downturn or upward deviation. The χ−1(T) followed the Curie Weiss law. The obtained θCW value was positive (Table 2), proving the FM behavior of the studied sample.68,69
For the NSMO-SG compound, the disappearance of the GP and the CO state was attributed to the enhancement of FM interactions. Each particle was supposed to be composed of two parts.70 The first one was the core where the double exchange interactions dominated and promoted an FM character. As for the other part, it was a disordered shell where the magnetic interactions were modified by the vacancies, defects as well as broken bonds and disfavored the FM behavior.71 Therefore, the appearance of the GP and the CO state until the reduction of the crystallite size arose from the loss of the FM order, since the surface contribution was larger.
Isothermal magnetizations versus the applied magnetic field M(μ0H,T) for NSMO-AC and NSMO-SG samples performed at several temperatures are plotted in Fig. 6. At low temperature values, the M(μ0H,T) data of NSMO-AC increased rapidly in the low external magnetic field region and were not as yet saturated for an applied magnetic field as great as 5 T. Contrary to the NSMO-SG compound, the M(μ0H,T) data increased sharply in the low magnetic field region and subsequently saturated as the field value increased, which corroborated to the high FM character of the NSMO-SG sample compared to that of the NSMO-AC sample. At high temperature values, the M(μ0H,T) data changed linearly with the applied magnetic field. Both compounds showed a PM behavior.
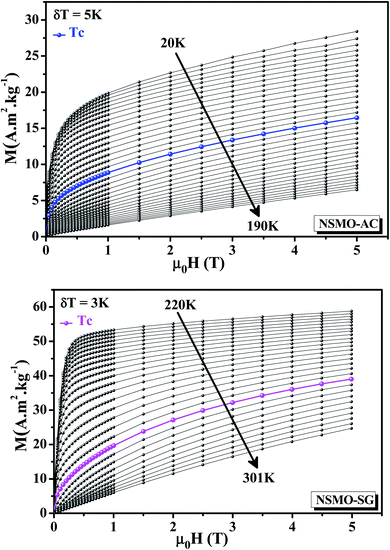 | ||
| Fig. 6 Isothermal magnetization curves recorded at various temperature values around TC for NSMO-AC and NSMO-SG compounds. | ||
3.3. Magnetocaloric study
According to the Maxwell relations,72 the magnetic entropy change (ΔSM), a significant thermodynamic parameter to enquire about the applicability of the studied specimens as magnetic refrigerants, could be calculated indirectly from the isothermal magnetization data using a numerical approximation:
 | (4) |
The temperature dependence of the magnetic entropy change (−ΔSM(T)) of NSMO-AC and NSMO-SG compounds, established at various external magnetic fields, is shown in Fig. 7. It was worth noting that the magnitude of ΔSM increased gradually when the external magnetic field was increased and achieved its maximum around TC, which was indicative of a much considerable magnetic entropy change to be predicted at higher magnetic field values. For μ0H = 2 T, the NSMO-AC sample presented a maximum ΔSmaxM value of 0.247 J kg−1 K−1, and the NSMO-SG sample reached a maximum ΔSmaxM value of 1.689 J kg−1 K−1. For μ0H = 5 T, the maximum ΔSmaxM value was 0.713 J kg−1 K−1 for the NSMO-AC compound and 3.594 J kg−1 K−1 for the NSMO-SG compound. Thus, the NSMO-SG compound achieved an important MCE near room temperature with a considerable ΔSmaxM value making the system potentially beneficial for magnetic refrigeration applications.
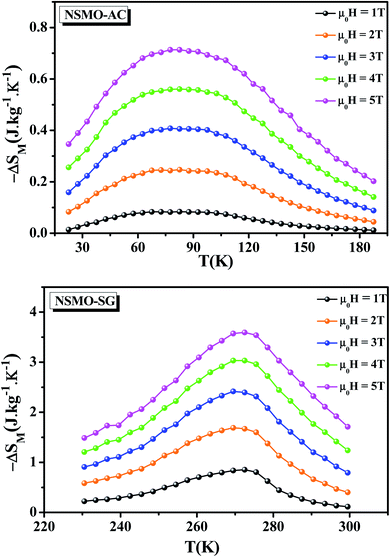 | ||
| Fig. 7 Magnetic entropy change (ΔSM) vs. temperature at several applied magnetic fields for NSMO-AC and NSMO-SG compounds. | ||
As can be seen, the ΔSM peak of the NSMO-AC sample was larger than that of the NSMO-SG sample. Such an enlargement of the ΔSM peak was assigned to the increase in the surface/volume ratio. When the crystallite size reduced, the surface proportion increased, which resulted in a weakness of the FM coupling compared to that of the core. This fact led to a scattering of the Curie temperature values, and thus a broad magnetic transition.73,74
The magnetocaloric effectiveness could be assessed through the relative cooling power (RCP),75 which was defined as the quantity of heat transferred between the hot and the cold sinks in an ideal refrigeration cycle. The latter takes into account the magnitude of (ΔSM) and its FWHM (δTFWHM). It was calculated as follow:
| RCP = (−ΔSmaxM) × δTFWHM | (5) |
The obtained RCP was 95.271 J kg−1 for NSMO-AC and 202.054 J kg−1 for NSMO-SG at μ0H = 5 T, which accounted for about 23% and 50% of that estimated in pure gadolinium (Gd), respectively.
To further estimate the efficacy of our compounds in the magnetic cooling systems, the calculated ΔSmaxM and the RCP values found in the present study are compared with that of other magnetic materials26,29,30,76–79 and tabulated in Table 3.
| Compound | μ0H (T) | TC (K) | −ΔSmaxM (J kg−1 K−1) | RCP (J kg−1) | Ref. |
|---|---|---|---|---|---|
| Nd0.6Sr0.4MnO3 (auto-combustion method) | 1 | 100 | 0.083 | 7.940 | This work |
| 2 | 0.247 | 27.481 | |||
| 3 | 0.408 | 49.929 | |||
| 4 | 0.56 | 70.632 | |||
| 5 | 0.713 | 95.271 | |||
| Nd0.6Sr0.4MnO3 (sol–gel method) | 1 | 275 | 0.853 | 28.322 | This work |
| 2 | 1.689 | 72.105 | |||
| 3 | 2.417 | 116.637 | |||
| 4 | 3.033 | 163.900 | |||
| 5 | 3.594 | 202.054 | |||
| Gd | 2 | — | 5.5 | 164 | 76 |
| 5 | 10.2 | 410 | 77 | ||
| Nd0.6Sr0.4MnO3 (solid-state method) | 2 | 245 | 1.71 | 74.88 | 30 |
| 5 | 3.68 | 216.03 | |||
| La0.6Sr0.4MnO3 | 2 | 365 | 0.97 | 98 | 26 |
| 5 | 2.14 | 264 | |||
| Nd0.50-0.17Sr0.33MnO3 | 1 | 220 | 0.19 | — | 29 |
| Nd0.7Sr0.3MnO3 | 2 | 240 | 5.3 | 80 | 79 |
| Nd0.67Ba0.33MnO3 | 5 | 145 | 3.91 | 265 | 78 |
| Nd0.67Ba0.33Mn0.98Fe0.1O3 | 5 | 134 | 2.97 | 242 | 78 |
3.4. Critical behavior study
Fig. 8a illustrates the so-called Arrott plots of M2 vs. μ0H/M extracted from the magnetization isotherms following the mean-field model (β = 0.5 and γ = 1). In accordance with the assumption of the Banerjee criterion,80,81 the order of the magnetic transition was defined via the sign of the slope of M2 vs. μ0H/M curves. A positive slope was noted for all of the investigated temperatures, which asserted that the FM/PM phase transition was of the second order.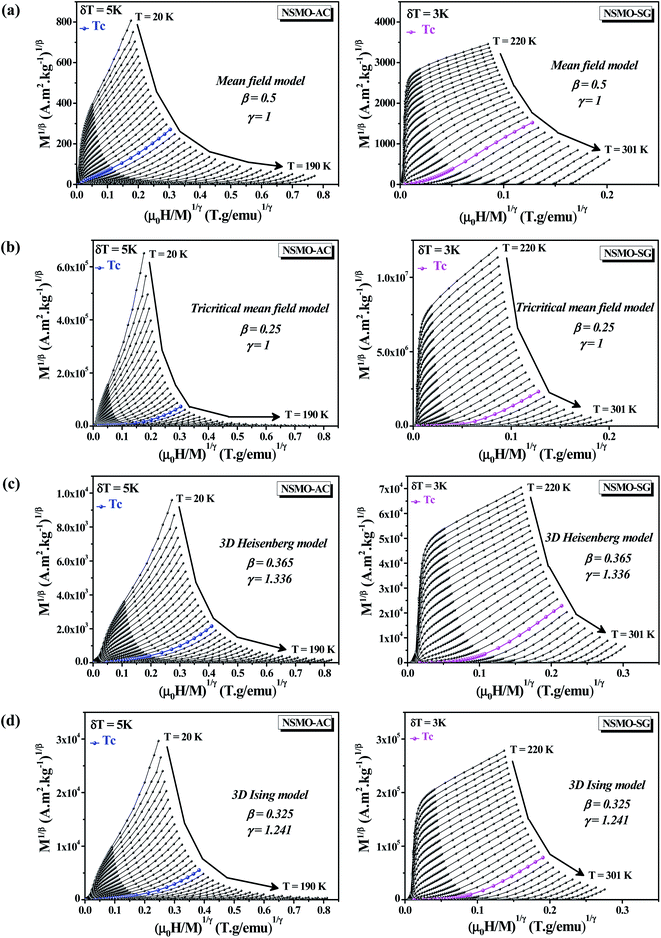 | ||
| Fig. 8 Modified Arrott plots (MAP): M1/β vs. (μ0H/M)1/γ with (a) mean-field model, (b) tri-critical mean-field model, (c) 3D-Heisenberg model and (d) 3D-Ising model for NSMO-AC and NSMO-SG samples. | ||
Based on the universal scaling relations, a second-order magnetic transition near the Curie temperature TC was specified by means of interconnected critical exponents, namely β is the exponent related to the spontaneous magnetization MS under TC, γ is the exponent associated with the magnetic susceptibility χ0−1 beyond TC and δ is the exponent linked to the critical isothermal magnetization at TC. The critical exponent values were mathematically approximated from the magnetization data via the asymptotic formulas as follow:82
| MS(T < TC,μ0H → 0) = M0|ε|β | (6) |
 | (7) |
| M(T = TC,μ0H) = D(μ0H)1/δ | (8) |
 as well as D are critical amplitudes and
  is the reduced temperature.
According to the Arrott–Noakes equation of state,83 the experimental data were examined through the modified Arrott-plot (MAP) formula:
 | (9) |
The appropriate model brought about a set of reasonably good parallel straight lines.
Fig. 8 displays the plot of M1/β vs.  at various temperatures using different theoretical models: (a) the mean-field model (β = 0.5 and γ = 1), (b) the tri-critical mean-field model (β = 0.25 and γ = 1), (c) the 3D-Heisenberg model (β = 0.365 and γ = 1.336) and (d) the 3D-Ising model (β = 0.325 and γ = 1.240). All models presented nearly parallel lines and quasi straight in the region of high field values. It was complicated to identify the most adequate model to characterize our samples.
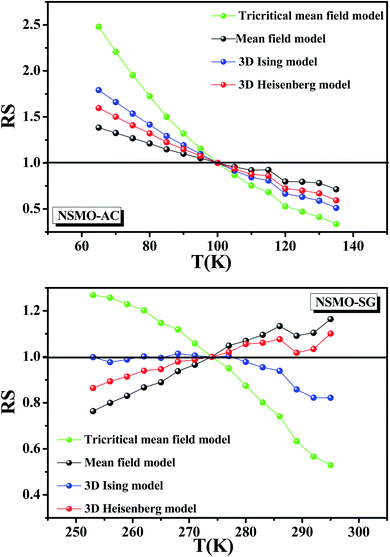
Herein, it was essential to calculate the relative slope (RS), which was considered as a new specific indicator to select the suitable model. The RS was expressed at the critical temperature as follow:
 | (10) |
Fig. 9 presents the RS vs. T data of both the systems for the following four models: the mean-field model, the tri-critical mean-field model, the 3D-Heisenberg model and the 3D-Ising model. The most ideal model was the one that presented an RS value equal to 1.84
It was clear that the mean-field model was the most satisfactory one to define the critical properties of the NSMO-AC compound, whereas the 3D Ising model was the ideal one to specify the critical behavior of the NSMO-SG compound. The change in the universality class could be associated with the change in the elaboration process, which influenced the crystallite size. Similar results were reported in ref. 85 and 86, where the authors suggested that the reduction in the crystallite size presented an intensive impact on the magnetic interactions and strongly influenced the universality class.
Departing from the MAP, the linear extrapolation of the isotherm in the high magnetic field region provided the spontaneous magnetization MS values as well as the inverse susceptibility χ0−1 values as intercepts on the coordinate axes M1/β and  , respectively. The MS(T) and χ0−1(T) data are demonstrated in Fig. 10. Using eqn (6) and (7), the best fit results of MS(T) and χ0−1(T) plots, respectively, provide new values of β, γ, and TC (Table 4).
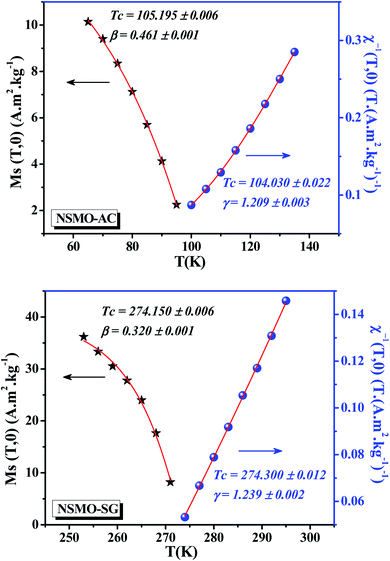 | ||
| Fig. 10 Spontaneous magnetization MS(T) and the inverse initial susceptibility χ0−1(T) data for NSMO-AC and NSMO-SG compounds. Solid lines correspond to the fitting curves. | ||
| Model/compound | Technique | TC (K) | β | γ | δ |
|---|---|---|---|---|---|
| Mean-field model | 0.5 | 1 | 3 | ||
| Tri-critical mean-field model | 0.25 | 1 | 5 | ||
| 3D-Heisenberg model | 0.365 | 1.336 | 4.80 | ||
| 3D-Ising model | 0.325 | 1.240 | 4.82 | ||
| NSMO-AC | MAP | 105.195 ± 0.006 | 0.461 ± 0.001 | 1.209 ± 0.003 | |
| KF | 104.167 ± 0.008 | 0.621 ± 0.002 | 1.123 ± 0.005 | ||
| CIA (exp.) | 2.516 ± 0.038 | ||||
| CIA (cal.) | 2.80 | ||||
| NSMO-SG | MAP | 274.150 ± 0.006 | 0.320 ± 0.001 | 1.239 ± 0.002 | |
| KF | 273.980 ± 0.001 | 0.323 ± 0.002 | 1.235 ± 0.004 | ||
| CIA (exp.) | 4.831 ± 0.016 | ||||
| CIA (cal.) | 4.82 |
From Table 4, it is worth highlighting that the obtained critical exponents of NSMO-SG are self-consistent and in accurate estimates when compared with the theoretical ones. However, the estimated critical exponents of NSMO-AC exhibited a slight deviation from the exponent values predicted for the theoretical interaction models. Generally, for the inhomogeneous FM materials, the values of the critical exponents were incompatible when compared with those of the traditional universality classes. Similar results were reported by Sudakshina et al.87
A further processing of MS(T) and χ0−1(T) was realized using the Kouvel–Fisher (KF) method88 so as to determine accurately the values of β, γ, and TC. The function construction was defined by the following expressions:
 | (11) |
 | (12) |
Under this method, the plots of  and
and  , shown in Fig. 11, appear as straight lines with 1/β and 1/γ slopes, respectively. The intercepts on the T axis of their extrapolation to the ordinate equal to zero corresponding to the TC values. It was noted that the critical exponent as well as the Curie temperature values determined from the KF method (Table 4) go in tandem with those deduced from the MAP. Consequently, we could conclude that the aforementioned methods were feasible and effective to investigate the critical properties.
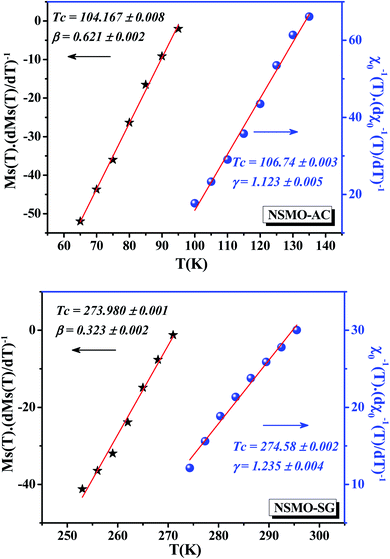 | ||
| Fig. 11 Kouvel–Fisher (KF) curves for the spontaneous magnetization MS(T) and the inverse initial susceptibility χ0−1(T) of NSMO-AC and NSMO-SG compounds. Solid lines correspond to the linear fits. | ||
Fig. 12 presents the critical isotherm (M vs. μ0H) curves at TC = 100 and 275 K for NSMO-AC and NSMO-SG, respectively, plotted on a log–log scale. By fitting the M(μ0H) with eqn (8), the third exponent δ value is achieved. The obtained values, recapitulated in Table 4, are similar to those calculated theoretically through the Widom scaling law:89
 | (13) |
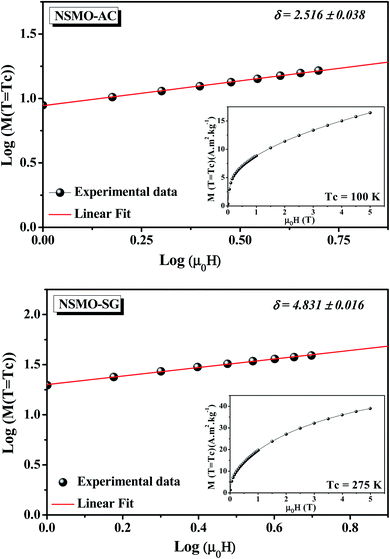 | ||
| Fig. 12 Critical isotherm (M vs. μ0H), plotted on a log–log scale, for NSMO-AC and NSMO-SG compounds. | ||
These findings validated the exactness of the calculated values of β and γ.
For more certainity, the reliability of the acquired critical exponents could be determined through the universal scaling theory around the critical region, which could be described by the equation below:
 | (14) |
Fig. 13 displays the plot of M|ε|−β vs. μ0H|ε|−β−γ by using β, γ, and TC values determined by the KF method. It can be obviously seen that all of the experimental data fell into two independent branches around TC. This observation ensured that eqn (14) is obeyed, which denotes the accuracy of the obtained critical exponents and that of the Curie temperature.
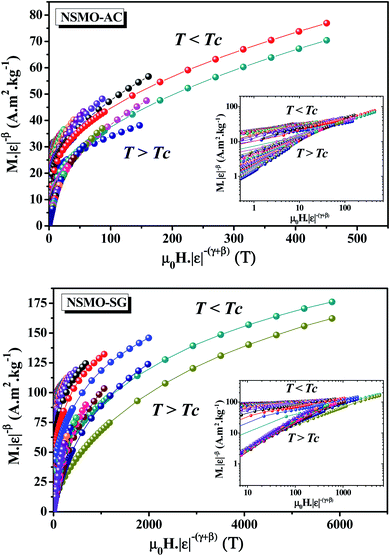 | ||
| Fig. 13 Scaling plots M|ε|−β vs. μ0H|ε|−β−γ around TC for NSMO-AC and NSMO-SG samples. The inset depicts the same plots on the log–log scale. | ||
4. Conclusion
In summary, a detailed study of the structural, magnetic, magnetocaloric, and critical behavior of the Nd0.6Sr0.4MnO3 compound was systematically performed. The sample was synthesized by using two different methods: the auto-combustion method (NSMO-AC) and the sol–gel process (NSMO-SG). Rietveld refinements of the XRD data indicated that the studied samples adopted an orthorhombic structure with Pnma space group. Both compounds exhibited a second-order phase transition from FM to PM state at TC. The appearance of a Griffiths phase (GP), as well as a charge ordering state (CO) in the compound prepared by the auto-combustion reaction, was explained in terms of the core–shell model. The specimen elaborated by the sol–gel method presented a greater magnetic entropy change value than that presented by the sample synthesized by the auto-combustion process, which made it a suitable material for the magnetic refrigeration device. The critical behavior related to the FM/PM phase transition implied that the calculated exponents were in good agreement with the prediction of the mean-field model and the 3D-Ising model for NSMO-AC and NSMO-SG samples, respectively, which proved that the synthesis route played a significant role in changing the universality class.Conflicts of interest
There are no conflicts to declare.Acknowledgements
The authors acknowledge the Taif University Research Supporting Project (TURSP-2020/66), Taif University, Taif, Saudi Arabia.References
- A. Kitanovski, Adv. Energy Mater., 2020, 10, 1903741 CrossRef CAS.
- A. Kitanovski, J. Tušek, U. Tomc, U. Plaznik, M. Ozbolt and A. Poredoš, Magnetocaloric Energy Conversion: From Theory to Applications, Springer, 2014 Search PubMed.
- O. Gutfleisch, M. A. Willard, E. Bruck, C. H. Chen, S. G. Sankar and J. P. Liu, Adv. Mater., 2011, 23, 821 CrossRef CAS.
- E. L. T. França, A. O. dos Santos, A. A. Coelho and L. M. da Silva, J. Magn. Magn. Mater., 2016, 401, 1088 CrossRef.
- C. Romero-Muniz, V. Franco and A. Conde, Phys. Chem. Chem. Phys., 2017, 19, 3582 RSC.
- M. Balli, S. Jandl, P. Fournier, S. Mansouri, A. Mukhin, Y. V. Ivanov and A. M. Balbashov, J. Magn. Magn. Mater., 2015, 374, 252 CrossRef CAS.
- Y. Yi, L. Li, K. Su, Y. Qi and D. Huo, Intermetallics, 2017, 80, 22 CrossRef CAS.
- Y. Yang, Y. Zhang, X. Xu, S. Geng, L. Hou, X. Li, Z. Ren and G. Wilde, J. Alloys Compd., 2017, 692, 665 CrossRef CAS.
- Y. Zhang, L. Hou, Z. Ren, X. Li and G. Wilde, J. Alloys Compd., 2016, 656, 635 CrossRef CAS.
- M. H. Phan and S. C. Yu, J. Magn. Magn. Mater., 2007, 308, 325 CrossRef CAS.
- M. Smari, I. Walha, E. Dhahri and E. K. Hlil, J. Alloys Compd., 2013, 579, 564 CrossRef CAS.
- S. Xi, W. Lu and Y. Sun, J. Appl. Phys., 2012, 111, 063922 CrossRef.
- M. Bejar, R. Dhahri, F. ElHalouani and E. Dhahri, J. Alloys Compd., 2006, 414, 31 CrossRef CAS.
- A. Dhahri, M. Jemmali, E. Dhahri and M. A. Valente, J. Alloys Compd., 2015, 638, 221 CrossRef CAS.
- M. Khlifi, M. Bejar, E. Dhahri, P. Lachkar and E. K. Hlil, J. Appl. Phys., 2012, 111, 103909 CrossRef CAS.
- R. Skini, A. Omri, M. Khlifi, E. Dhahri and E. K. Hlil, J. Magn. Magn. Mater., 2014, 364, 5 CrossRef CAS.
- Y. Tokura, Rep. Prog. Phys., 2006, 69, 797 CrossRef CAS.
- N. Dhahri, A. Dhahri, K. Cherif, J. Dhahri, K. Taibi and E. Dhahri, J. Alloys Compd., 2010, 496, 69 CrossRef CAS.
- A. Tozri, E. Dhahri and E. K. Hlil, J. Mater. Lett., 2010, 64, 2138 CrossRef CAS.
- M. Khlifi, A. Tozri, M. Bejar, E. Dhahri and E. K. Hlil, J. Magn. Magn. Mater., 2012, 324, 2142 CrossRef CAS.
- M. Jeddi, H. Gharsallah, M. Bejar, M. Bekri, E. Dhahri and E. K. Hlil, RSC Adv., 2018, 8, 9430 RSC.
- P. Gupta and P. Poddar, RSC Adv., 2015, 5, 10094 RSC.
- I. A. Abdel-Latif, J. Alloys Compd., 2008, 245, 452 Search PubMed.
- I. A. Abdel-Latif, A. S. Khramov, V. A. Trounov, O. P. Smirnov, S. S. Bashkirov, V. V. Parfenov and S. Z. Ibragimov, Egypt. J. Solids, 2006, 29, 341 Search PubMed.
- H. Gharsallah, M. Bejar, E. Dhahri and E. K. Hlil, Mater. Chem. Phys., 2016, 182, 429 CrossRef CAS.
- M. Jeddi, H. Gharsallah, M. Bekri, E. Dhahri and E. K. Hlil, RSC Adv., 2018, 8, 28649 RSC.
- M. Jeddi, H. Gharsallah, M. Bekri, E. Dhahri and E. K. Hlil, Appl. Phys. A: Mater. Sci. Process., 2020, 126, 6 CrossRef CAS.
- B. Arun, M. V. Suneesh, B. Sudakshina, V. R. Akshay, K. D. Chandrasekhar and M. Vasundhara, J. Phys. Chem. Solids, 2018, 123, 327 CrossRef CAS.
- B. Arun, V. R. Akshay, K. D. Chandrasekhar, G. R. Mutta and M. Vasundhara, J. Magn. Magn. Mater., 2019, 472, 74–85 CrossRef CAS.
- F. Issaoui, E. Dhahri and E. K. Hlil, J. Low Temp. Phys., 2020, 200, 15 CrossRef.
- N. Assoudi, I. Walha, K. Nouri, E. Dhahri and L. Bessais, J. Alloys Compd., 2018, 753, 282 CrossRef CAS.
- K. Riahi, I. Messaoui, W. Cheikhrouhou-Koubaa, S. Mercone, B. Leridon, M. Koubaa and A. Cheikhrouhou, J. Alloys Compd., 2016, 688, 1028 CrossRef CAS.
- K. A. Bouziane, J. Appl. Phys., 2005, 97, 504 CrossRef.
- A. A. Yousif, AIP Conf. Proc., 2011, 1370, 103 CrossRef CAS.
- I. A. Abdel-Latif and S. A. Saleh, J. Alloys Compd., 2012, 530, 116 CrossRef CAS.
- Y. Cui, Ceram. Int., 2012, 38, 4761 CrossRef CAS.
- Z. F. Zi, J. Magn. Magn. Mater., 2009, 321, 2378 CrossRef CAS.
- I. A. Abdel-Latif, AIP Conf. Proc., 2011, 1370, 108 CrossRef CAS.
- M. A. Basith, B. Ahmmad, S. Hossain and K. Molhave, Mater. Res. Express, 2017, 4, 075012 CrossRef.
- P. Žvátora, J. Solid State Chem., 2013, 204, 373 CrossRef.
- K. N. Anuradha, IOP Conf. Ser.: Mater. Sci. Eng., 2015, 73, 012007 Search PubMed.
- Y. Romaguera-Barcelay, J. Electroceram., 2011, 26, 44 CrossRef CAS.
- A. Mleiki, J. Alloys Compd., 2017, 727, 1203 CrossRef CAS.
- M. Verelst, N. Rangavittal, C. N. R. Rao and A. Rousset, J. Solid State Chem., 1993, 104, 74 CrossRef CAS.
- M. Gupta, P. Yadav, W. Khan, A. Azam, A. H. Naqvi and R. K. Kotnala, Adv. Mater. Lett., 2012, 3, 220 CrossRef.
- A. C. F. M. Costa, M. R. Morelli and R. H. G. A. Kiminami, J. Mater. Sci., 2007, 42, 779 CrossRef CAS.
- M. George, A. Mary John and S. S. Nair, J. Magn. Magn. Mater., 2006, 302, 190 CrossRef CAS.
- A. S. Mukasyan, P. Epstein and P. Dinka, Proc. Combust. Inst., 2007, 31, 1789 CrossRef.
- K. Abdouli, W. Cherif, E. Kadri, K. Dhahri, P. R. Prezas, M. P. F. Graça and L. Ktari, J. Alloys Compd., 2018, 739, 1048 CrossRef CAS.
- S. B. Moumen, Y. Gagou, M. Chettab, D. Mezzane, M. Amjoud and S. Fourcade, J. Mater. Sci.: Mater. Electron., 2019, 30, 20459 CrossRef.
- C. Zhu, A. Nobuta, I. Nakatsugawa and T. Akiyama, Int. J. Hydrogen Energy, 2013, 38, 13238 CrossRef CAS.
- J. Rodrigues-Carvajal, FULLPROF: A Rietveld Refinement and Pattern Matching Analysis Program, CEA-CNRS, France, 2000 Search PubMed.
- N. Zaidi, S. Mnefgui, J. Dhahri and E. K. Hlil, J. Magn. Magn. Mater., 2017, 432, 511–518 CrossRef CAS.
- P. Goel and K. L. Yadav, J. Mater. Sci., 2007, 42, 3928 CrossRef CAS.
- Z. Mohamed, M. Abassi, E. Tka, J. Dhahri and E. K. Hlil, J. Alloys Compd., 2015, 646, 23 CrossRef CAS.
- H. Gharsallah, A. Souissi, M. Bejar, E. Dhahri and E. K. Hlil, Mater. Chem. Phys., 2016, 182, 429–438 CrossRef CAS.
- A. Tozri, J. Khelifi, E. Dhahri and E. K. Hlil, Mater. Chem. Phys., 2015, 149, 728 CrossRef.
- A. Karmakar, S. Majumdar, S. Kundu and T. K. Nath, J. Phys.: Condens. Matter, 2012, 24, 126003 CrossRef CAS.
- R. B. Griffiths, Phys. Rev. Lett., 1969, 23, 17 CrossRef.
- H. Baaziz, A. Tozri, E. Dhahri and E. K. Hlil, J. Magn. Magn. Mater., 2016, 403, 181 CrossRef CAS.
- B. Sanjib, B. Nasrin and I. Das, J. Alloys Compd., 2018, 745, 753 CrossRef.
- J. Wanjun, Z. XueZhi, W. Gwyn, Y. Mukovskii and R. Privezentsev, J. Appl. Phys., 2010, 107, 09D701 CrossRef.
- W. J. Jiang, X. Zhou and G. Williams, Europhys. Lett., 2008, 84, 47009 CrossRef.
- X. Zheng, T. Gao, W. Jing, X. Wang, Y. Liu, B. Chen and V. V. Marchenkov, J. Magn. Magn. Mater., 2019, 491, 165611 CrossRef CAS.
- T. F. Hiroyuki, H. Fujishiro and M. Ikebe, J. Phys. Soc. Jpn., 1998, 67, 2582 CrossRef.
- J. G. R. Klingeler, R. Gross, L. Pinsard-Gaudart, A. Revcolevschi, S. Uhlenbruck and B. Büchner, Phys. Rev. B: Condens. Matter Mater. Phys., 2002, 65, 174404 CrossRef.
- S. M. Zhou, Y. Q. Guo, J. Y. Zhao, S. Y. Zhao and L. Shi, Appl. Phys. Lett., 2010, 96, 262507 CrossRef.
- A. Sagdeo, K. Gautam, P. R. Sagdeo, M. N. Singh, S. M. Gupta, A. K. Nigam, R. Rawat, A. K. Sinha, H. Ghosh, T. Ganguli and A. Chakrabarti, Appl. Phys. Lett., 2014, 105, 042906 CrossRef.
- F. Issaoui, M. T. Tlili, M. Bejar, E. Dhahri and E. K. Hlil, J. Supercond. Novel Magn., 2012, 25, 1169 CrossRef CAS.
- H. Baaziz, A. Tozri, E. Dhahri and E. K. Hlil, J. Magn. Magn. Mater., 2016, 403, 181 CrossRef CAS.
- M. Secu, M. Cernea, C. E. Secu and B. S. Vasile, Mater. Chem. Phys., 2015, 151, 81 CrossRef CAS.
- A. Omri, M. Bejar, M. Sajieddine, E. Dhahri, E. K. Hlil and M. Es-Souni, Phys. B, 2012, 407, 2566 CrossRef CAS.
- M. Pekala, V. Drozd, J. F. Fagnard and P. Vanderbemden, J. Alloys Compd., 2010, 507, 350 CrossRef CAS.
- H. Baaziz, A. Tozri, E. Dhahri and E. K. Hlil, Ceram. Int., 2015, 41, 2955 CrossRef CAS.
- V. M. Andrade, R. C. Vivas, S. S. Pedro, J. C. G. Tedesco, A. L. Rossi, A. A. Coelho and M. S. Reis, Acta Mater., 2016, 102, 49 CrossRef CAS.
- S. Y. Dankov, A. M. Tishin, V. K. Pecharsky and K. A. Gschneidner Jr, Phys. Rev. B: Condens. Matter Mater. Phys., 1998, 57, 3478 CrossRef CAS.
- K. A. Gschneidner Jr, V. K. Pecharsky and A. O. Tsokol, Rep. Prog. Phys., 2005, 68, 1479 CrossRef.
- A. M. Ahmed, H. F. Mohamed, A. K. Diab, S. A. Mohamed, S. García-Granda and D. Martínez-Blanco, Solid State Sci., 2016, 57, 1 CrossRef CAS.
- S. Hcini, M. Boudard, S. Zemni and M. Oumezzine, Ceram. Int., 2014, 40, 16041 CrossRef CAS.
- S. K. Banerjee, Phys. Lett., 1964, 12, 16 CrossRef.
- A. Tozri, J. Khelifi, E. Dhahri and E. K. Hlil, Mater. Chem. Phys., 2015, 149, 728 CrossRef.
- K. Huang, Statistical Mechanics, Wiley, New York, 1987 Search PubMed.
- A. Arrott and J. E. Noakes, Phys. Rev. Lett., 1967, 19, 786 CrossRef CAS.
- A. Schwartz, M. Scheffler and S. M. Anlage, Phys. Rev. B: Condens. Matter Mater. Phys., 2000, 61, R870 CrossRef CAS.
- S. Mahjoub, M. Baazaoui, E. K. Hlil and M. Oumezzine, Ceram. Int., 2015, 41, 12407 CrossRef CAS.
- H. Gharsallah, M. Bejar, E. Dhahri and E. K. Hlil, J. Phys. Chem. Solids, 2017, 109, 50 CrossRef CAS.
- B. Sudakshina, J. Phys. D: Appl. Phys., 2017, 50, 065004 CrossRef.
- J. S. Kouvel and M. E. Fisher, Phys. Rev. B: Solid State, 1964, 136, A1626 CrossRef.
- B. Widom, J. Chem. Phys., 1965, 43, 3898 CrossRef.
| This journal is © The Royal Society of Chemistry 2021 |

