 Open Access Article
Mechanism of N,N-dimethylformamide electrochemical oxidation using a Ti/RuO2–IrO2 electrode†
Xuyang Hu,
Hao Dong,
Yinghao Zhang ,
Baihui Fang and
Wenqiang Jiang
 *
*
School of Environmental Science and Engineering, Qilu University of Technology (Shandong Academy of Sciences), Ji'nan 250353, China. E-mail: jwq@qlu.edu.cn
First published on 11th February 2021
Abstract
The compound N,N-dimethylformamide (DMF) is a widely used industrial chemical and a common environmental contaminant that has been found to be harmful to human health. In this study, electrochemical oxidation was adopted for the degradation of DMF. The effects of four kinds of electrodes on the removal rates of DMF and total organic carbon were compared, and based on the result, the Ti/RuO2–IrO2 electrode was selected as the operating electrode. The effects of three independent factors (current density, pH, and NaCl proportion) on the DMF degradation were investigated through single-factor experiments, and the experimental results were optimized by response surface methodology. The optimal experimental conditions were obtained as follows: current density = 47 mA cm−2, pH = 5.5, and NaCl proportion = 15%. The electrochemical oxidation of 50 mg L−1 DMF was performed under the optimal conditions; the degradation rate was 97.2% after 7 h, and the reaction followed the pseudo-first-order kinetic model. The degradation products under optimal conditions and chlorine-free conditions were analyzed, and four degradation pathways were proposed. The DMF degradation was more thorough under optimal conditions.
Introduction
Water pollution by man-made organic chemicals is a critical cause of water shortage.1 In recent years, thousands of tons of consumed complex man-made organic chemicals have been released into water bodies. The raw wastewater containing organic pollutants can cause harm to human health2 and the ecosystem.3 The existence of these contaminants has attracted increasing public concerns, which the EU Water Framework Directive is urged to address.3The water-miscible compound N,N-dimethylformamide (DMF) is commonly used as a versatile organic solvent for industrial production and chemical synthesis.4,5 However, a large amount of DMF-containing industrial wastewater is discharged. The negative impact of this wastewater on human health and the environment cannot be ignored. Moreover, DMF has stable physicochemical properties6 and thus is difficult to degrade when released into the environment.7 The organic compound is mostly absorbed into the human body through skin contact or inhalation, and it can cause liver damage and cancer.8–10 Therefore, there is an urgent need to address the environmental problems caused by DMF.
Some researchers have investigated DMF degradation. For example, Dou et al. proposed a new process combining extraction, distillation, and reverse osmosis. The results demonstrated that over 99.8% of DMF could be recycled with a purity of 99%.11 These physical methods are suitable when the DMF concentration in wastewater is high. When the DMF concentration is low, the physical method is considered inappropriate in terms of removal efficiency and economic benefits. In this case, the chemical or biological degradation treatment is considered reasonable.12 Zhou et al. separated and concentrated the efficient DMF degradation bacteria DMF-3 out of activated sludge. The removal rate of 5000 mg L−1 DMF by DMF-3 could reach 98% in 84 hours.13 At present, some studies on DMF biodegradation have been conducted; however, biological methods still have some drawbacks such as long start-up time and the toxicity of the sludge produced.14,15
Electrochemical oxidation is considered environmentally friendly.16,17 Due to its advantages such as easy controllability and little secondary pollution, many researchers have conducted in-depth studies on electrochemical oxidation.18 The method has been widely used in the treatment of wastewater from the printing, dyeing, smelting, and electroplating industries.19–21 Especially, in the processes of treating some refractory organic pollutants in complex wastewater, electrochemical oxidation has been found to exhibit satisfactory removal effect.22
Electrochemical oxidation is classified into direct and indirect oxidation according to degradation mechanisms.23 In the direct oxidation process, contaminants are first adsorbed on the anode surface and then degraded by electron transfer without the generation of intermediate substances. However, as the reaction proceeds, fouling can easily occur on the anode surface, which reduces the reaction efficiency and anode life.24 In indirect oxidation, the pollutants are oxidized and degraded by strong oxidants produced in electrochemical reactions.25,26 The most representative of these strong oxidants are free radicals. Because of the high-redox potential of the free radicals, organic pollutants are removed effectively by contacting them.27 At present, indirect oxidation is mostly used in the electrochemical oxidation process to avoid some shortcomings of direct oxidation and thus improve the degradation efficiency.28 Thus, to avoid waste of resources and optimize process conditions, investigating the mechanism of the electrochemical oxidation process is essential.
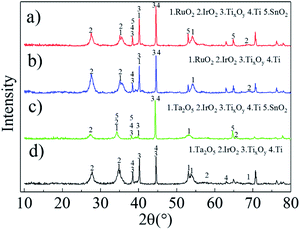
To date, DMF degradation through the electrochemical oxidation process has not received attention for DMF wastewater treatment. The optimal working conditions and the degradation mechanism of this process are still unclear. In the present work, the following were performed: (1) four kinds of IrO2-based electrodes were characterized via X-ray diffraction (XRD), and the electrode with the best DMF degradation effect was selected from four electrode plates with different coating through single-factor experiments. Cyclic voltammetry (CV) and molecular probe experiments were used to study the oxidation mechanism of DMF under the selected electrode system. (2) The influences of pH, current density, and Cl− addition on the degradation performance were optimized via the response surface methodology (RSM).29–31 (3) The DMF degradation mechanism was studied by distinguishing the intermediates in the electrochemical degradation experiments under optimal conditions. The present work can open a new avenue for the industrialization of the electrochemical degradation of DMF and clarify the theoretical mechanism.
Experimental material and methods
Experimental materials
Analytical-grade DMF was used without purification in this experiment. Chromatographic-grade methanol was used to prepare the mobile phase in the high-performance liquid chromatography (HPLC) analysis. Deionized water was used to prepare all aqueous solutions.Four electrodes (50 mm × 100 mm) were used in the experiment: Ti/RuO2–IrO2, Ti/Ta2O5–IrO2, Ti/RuO2–IrO2–SnO2, and Ti/IrO2–Ta2O5–SnO2. A Ti electrode (50 mm × 100 mm) was used as the cathode in the electrochemical oxidation setup.
Electrochemical oxidation experiment
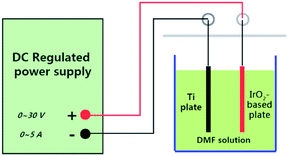
The electrochemical oxidation setup is demonstrated in Fig. 1. Direct-current regulated power supply was used to power the device. The device anode was the IrO2-based electrodes, while the cathode was the Ti electrode of the same size. The experiments were conducted in groups under constant-current conditions at room temperature. A volume of 500 mL DMF aqueous solution with a concentration of 50 mg L−1 was used in each group. To increase the conductivity, 0.1 M Na2SO4 was added to the solution. The reaction time was determined to be 8 h through preliminary experiments.The experiment conditions were as follows: pH: 5.0, 6.0, 7.0, 8.0, and 9.0; current density: 10 mA cm−2, 20 mA cm−2, 30 mA cm−2, 40 mA cm−2, and 50 mA cm2; and NaCl proportion: 20%, 40%, 60%, 80%, and 100%.
During the reaction, 1 mL of solution was taken from the reactor every hour, and the DMF content was estimated via HPLC. A total of 8 mL was sampled throughout the whole process, which had a negligible effect on the reaction (involving 500 mL solution). The experiments were repeated three times for each group, and the results were averaged.
Analytical methods
The CV test of the Ti/RuO2–IrO2 electrode was conducted using an electrochemical workstation (Chenhua, CHI 660C) in combination with a three-electrode cell system. The Ti/RuO2–IrO2 electrode was employed as the working electrode, and the platinum wire electrode and Ag/AgCl electrode were the counter and reference electrodes in the system, respectively.The DMF concentrations were measured by an HPLC system (SHIMADZU, LC-20ATvp). The mobile phase was made of methanol and water at a ratio of 20![[thin space (1/6-em)]](https://www.rsc.org/images/entities/char_2009.gif) :
:![[thin space (1/6-em)]](https://www.rsc.org/images/entities/char_2009.gif) 80 and was sonicated for 30 min to remove the dissolved gas. The injection volume was 20 μL for each measurement, and the flow rate was 1.0 mL min−1. The injected sample is separated on a C18 column and then enters the detector. The detector was an ultraviolet detector with a detection wavelength of 220 nm.
80 and was sonicated for 30 min to remove the dissolved gas. The injection volume was 20 μL for each measurement, and the flow rate was 1.0 mL min−1. The injected sample is separated on a C18 column and then enters the detector. The detector was an ultraviolet detector with a detection wavelength of 220 nm.
A gas chromatography-mass spectrometry (GC-MS) system (SHIMADZU, QP2020) equipped with an electron impact (EI) ion source and an HP-5MS column was used to identify and analyze the intermediate products of DMF degradation. The operation conditions were as follows: the initial temperature was held at 50 °C for 3 min and ramped at 10 °C min−1 to 250 °C, where it was held for 10 min, and then ramped at 10 °C min−1 to 280 °C and held for 1 min. The injection volume was 1 μL, and the column flow was 1 mL. The mass spectrometry (MS) scan range was a mass-to-charge ratio of 25–300. The ion-source temperature was set to 200 °C, and the interface temperature was set to 250 °C.
Results and discussion
Electrode selection
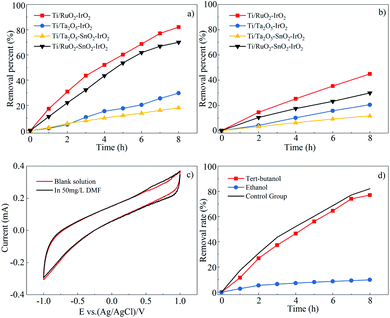
As indicated in Fig. 3(a) and (b), the Ti/RuO2–IrO2 electrode exhibited the best DMF degradation efficiency, and its degradation rate for TOC could reach 44.9%. The DMF degradation rate and mineralization rate by the Ti/RuO2–SnO2–IrO2 electrode were 12.1% and 15.1% lower than those by the Ti/RuO2–IrO2 electrode, respectively. The Ti/Ta2O5–SnO2–IrO2 electrode had the lowest DMF degradation efficiency (18.1%). Even though the relative mineralization rates of the Ti/Ta2O5–IrO2 and Ti/Ta2O5–SnO2–IrO2 electrodes were not low for their degradation rates, they were not considered working electrodes. Finally, the degradation efficiency and mineralization rate were comprehensively considered to select the Ti/RuO2–IrO2 electrode as the working electrode in this experiment.
Based on the experimental results, the addition of SnO2 to the electrode would reduce the DMF degradation efficiency. This may be because SnO2 did not participate in the reaction on the electrode but existed as impurities. It might also be that SnO2 participated in the electrochemical reaction process. Moreover, because SnO2 is an inactive electrode material, ˙OH− was produced, but ˙OH− had a poor degradation effect on DMF. After the addition of SnO2, the removal rate was reduced by 12.1% for the Ti/RuO2–IrO2 electrode and 11.6% for the Ti/Ta2O5–IrO2 electrode. The two values are similar, but the degradation mechanisms for the two electrodes were different. The Ti/RuO2–IrO2 electrode produced mainly SO4˙− as active groups, whereas the other electrode produced ˙OH−. Hence, it is more likely that the SnO2 did not participate in the reaction on the electrode.
In principle, the Ti/RuO2–IrO2 electrode is an active electrode,27 which produces very few hydroxyl radicals, resulting in a low degree of mineralization. However, the mineralization rate for DMF still reached 50%; there are multiple possible reasons for this. The first is that DMF has a lower molecular weight, and some groups will become gaseous and escape or be directly oxidized to carbon dioxide and water when DMF is oxidized. A second possible reason is that the entire degradation process lasted for 8 h, and some intermediate products were oxidized in the process.
To identify the free radicals, molecular probes were used to perform quenching experiments.35 The reaction rates of ethanol in reaction with ˙OH− and SO4˙− are similar, with rate constants of 1.2–2.8 × 10⁹ and 1.6–7.7 × 10⁷ M−1 s−1, respectively. However, tert-butanol has a slower reaction rate with SO4˙−. The reaction rate constant of tert-butanol with hydroxyl radicals is about 3.8–7.6 × 10⁸ M−1 s−1, and it is approximately a thousand times greater than that with the sulfate radical (4–9.1 × 10⁵ M−1 s−1).36 Thus, the hydroxyl radicals can be identified by adding tert-butanol to the electrochemical reactor, and the existence of sulfate radicals can be judged by comparing the effects of adding tert-butanol or ethanol to the electrochemical reactor.
Fig. 3(d) shows the effects of adding sufficient amounts of quencher (9 g L−1) to the reactor on the DMF degradation rate. The figure shows that the addition of tert-butanol had almost no effect on the DMF degradation efficiency, and this also confirms that the electrode did not produce hydroxyl radicals, as mentioned earlier. However, the reaction basically did not proceed after ethanol was added to the reactor. Based on this result, the most important active group that played a role in the DMF degradation process was the sulfate radical.
Effect of current density on the DMF degradation. The ability to produce free radicals is proportional to the current density in the electrochemical oxidation reaction, and the ability to oxidize pollutants is determined by the number of free radicals in the solution.37 However, as the current density increases, not only will more electrical energy be converted into heat, but the reaction voltage will increase, leading to more side reactions. Thus, the appropriate current density should be considered from multiple aspects.
The effect of current density on the DMF degradation is illustrated in Fig. 4(a). The increased current density positively affected the degradation. The five response curves do not show a flattening trend. It can be concluded that the current density does not affect the degradation end-point but only affects the reaction rate. The removal rate reached 82.1% within 8 h under the current density of 40 mA cm−2, which was close to the removal rate under 50 mA cm−2. Thus, through comprehensive consideration of the removal rate, energy consumption, and electronic utilization, 40 mA cm−2 was determined to be the operating current density.
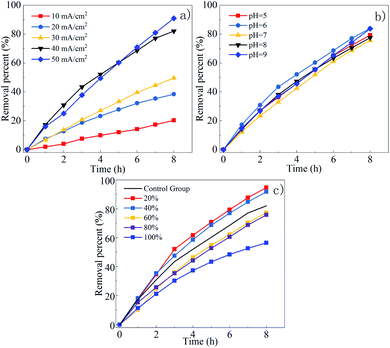 | ||
| Fig. 4 Effect of current density (a), initial pH (b) and proportions of NaCl (c) on DMF degradation. | ||
Effect of initial pH on the DMF degradation. Studies have shown that the activity of free radicals is affected by pH.31 Under acidic environment, ˙OH− exhibits stronger reactivity than that under alkaline conditions, but SO4˙− is the opposite.38 Since DMF is unstable in strong acid–base environment and is easily hydrolyzed at high temperature, the pH of the solution should be controlled within the range of 5–9 in order to avoid affecting the experimental results.
The effects of pH on DMF degradation is shown in Fig. 4(b). The DMF removal rate is not greatly affected by pH within the range of 5–9. The degradation rate of DMF in acid–base environment was higher than that in neutral environment. The degradation rate of DMF was highest at pH 6. The reason might be that SO4˙− is easier to convert to ˙OH− under alkaline conditions (as shown in formula (1) and (2)),39 but the reaction rate of SO4˙− with DMF is better than ˙OH−. Although the removal rate of DMF was similar when pH = 6 and pH = 9, considering that less acidic buffer was used when adjusting pH to 6 to facilitate the operation and the pH of the solution will continue to rise after adding Cl−, the pH = 6 was selected as the optimal pH.
| SO4˙− + OH− → ˙OH− + SO42− | (1) |
| SO4˙− + H2O → ˙OH− + HSO4− | (2) |
Effect of Cl− on the DMF degradation. Chloride ions in water are easily oxidized to produce some highly oxidizing species (Cl2, HOCl, ClO−). The process by which pollutants in water are oxidized by these oxidants is called electrochlorination, which is a kind of electrochemical indirect oxidation.26,30 The presence of these oxidants will not only affect the degradation efficiency of DMF, but also change its mechanism of degradation.
Since the 0.1 M NaCl and Na2SO4 solutions have different conductivity, in order to control the variables, NaCl with twice the Na2SO4 added had the same conductivity as the pure Na2SO4 solution. Different proportions of NaCl and Na2SO4 were used as an electrolyte to prepare mixed solution, for example, a 20% NaCl solution is a mixed solution of 0.08 M Na2SO4 and 0.04 M NaCl. As shown in the Fig. 4(c), the highest degradation rate was obtained at the 20% NaCl solution. The degradation rate at NaCl solution was lower than that in comparison to the control groups. Under the same current density and initial pH, the higher the proportion of NaCl, the lower the degradation rate. The possible reasons would be analyzed below.
Statistical analysis and interpretation by responsible surface method (RSM)
In this paper, DESIGN EXPERT software was used to optimize the experimental parameters of DMF electrochemical oxidation.29 Box-Behnken design was utilized by three factors and three levels, as shown in Table 1, was adopted. The data were fitted to a quadratic model, and the adequacy and significance of the model were tested by analysis of variance (Table 2). The model was significant, as indicated by the F-value of 39.07 and P-value of <0.0500. The adjusted R2 also confirms the high significance and the low coefficient of variation, which was less than 2% for all models, indicating that the experiment had high reliability and precision.| Factor | Variable | Level | ||
|---|---|---|---|---|
| −1 | 0 | 1 | ||
| X1 | Current density (mA cm−2) | 30 | 40 | 50 |
| X2 | Initial pH | 5 | 6 | 7 |
| X3 | Proportion of NaCl (%) | 10 | 20 | 30 |
| Response (Y, %) | Source | SSa | DFb | MSc | F-Value | P-Value |
|---|---|---|---|---|---|---|
| a SS: sum of squares.b DF: degree of freedom.c MS: mean of squares (= SS/DF).d C.V.: coefcient of variance. | ||||||
| Removal rate | Model | 424.28 | 9 | 47.14 | 39.07 | <0.0001 |
| Residual | 8.45 | 7 | 1.21 | |||
| Lack of fit | 5.56 | 3 | 1.85 | 2.57 | 0.1924 | |
| Pure error | 2.89 | 4 | 0.7220 | |||
| Total | 432.72 | 16 | ||||
| R2 = 0.9805 | Adj R2 = 0.9554 | C.V.% = 1.2d | ||||
The 3D surfaces of the independent variables are displayed in Fig. 5. These 3D response-surface plots indicate the separate effects and interactions of the independent variables toward the dependent variable. The diagram shows that the increase in the current density greatly contributed positively to the removal rate. In contrast, the influences of the pH and NaCl proportion on the removal rate were small within this range.
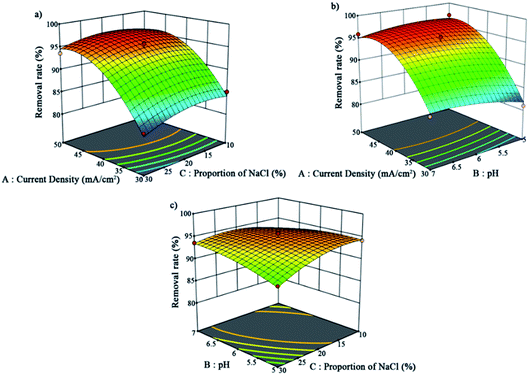 | ||
| Fig. 5 Three-dimensional surfaces of the interaction of the independent variables: (a) for A and C, (b) for A and B, and (c) for B and C. | ||
The final equation in terms of coded factors can be used to predict the results of each factor for a given level. The equation is used in determining the relative impact of the factors by comparing the factor coefficients. The equation of this model is presented in eqn (3). According to the results of this software, the best conditions were obtained as follows: current density = 47 mA cm−2, pH = 5.5, and NaCl proportion = 15%.
| Removal rate = 94.88 + 6.11X1 + 0.4625X2 − 0.8750X3 − 1.12X1X2 + 0.5X1X3 + 1.4X2X3 − 4.48X12 − 0.8275X22 − 1.55X32 | (3) |
Optimization experiment
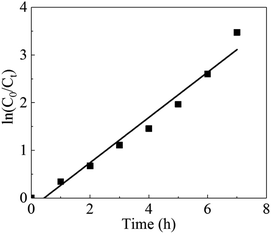
Under the best conditions, the removal rate obtained in the verification test was 97.26%, which was higher than the calculated value of 97.17%. Therefore, the optimal conditions calculated by the software were the optimal operating parameters for this experiment. To clarify the mechanism of the electrochemical oxidation process, the kinetics of DMF degradation were investigated. The pseudo-first-order kinetic model was used to fit the experimental data, and the kinetic equation is shown in eqn (4). Fig. 6 demonstrates the kinetic experiments under the optimal operating condition.
 | (4) |
The presented values of correlation indicate that the DMF degradation followed the pseudo-first-order kinetics model (R2 > 0.95).40,41 A linear relationship existed between the reaction time and ln(C0/Ct); the rate constant was 0.4743 h−1, and R2 was 0.9652.
Differential electrochemical MS experiment on Ti/RuO2–IrO2 electrode
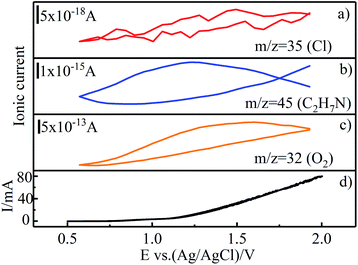
To investigate the DMF degradation mechanism under optimal conditions, differential electrochemical mass spectrometry (DEMS) experiments were performed on Ti/RuO2–IrO2 electrode26,42 in an electrolyte with 0.085 M Na2SO4, 0.03 M NaCl, and 50 mg L−1 DMF. Ti/RuO2–IrO2 electrode (2 cm × 2.5 cm) was used as the working electrode and the platinum electrode (5 mm × 10 mm) was used as the counter electrode. The sweeping range of the potential was from 0.5 V to 2 V vs. Ag/AgCl electrode, and the ionic currents of the substances corresponding to the potential during the scanning process were recorded.As depicted in Fig. 7, the mass spectrometric cyclic voltammogram (MSCV) of O2 increased with the increase in current. This trend was caused by the oxygen precipitation reaction of electrolysis. Due to the low Cl− concentration, the lower MSCV response value of Cl caused the graph to be unstable, but an upward trend still existed. Moreover, chlorine volatiles (Cl2, Cl2O, and ClO2) were also detected by the MS, but their response values were too low (as low as 1 × 10⁻²⁰) to get valid information from the MSCV. Moreover, dimethylamine (C2H7N) was identified, an intermediate product in the DMF oxidation. Compared with the MSCVs of Cl and O2, that of C2H7N poorly corresponded to the elevated potential, and the curve was not closed; thus, it is inferred that C2H7N was not produced at the electrode. This also corroborates the inference that the DMF oxidation was indirect.
The DMF degradation under optimal conditions involved a combination of sulfate radicals (eqn (5)) and chloride oxides (eqn (6)–(8)). According to the results of effect of Cl-on the DMF degradation, the addition of NaCl had a positive effect on the DMF degradation when the NaCl proportion in the solution was 20% and 40%. This may be due to the limited effect of this range of NaCl ratios on the production of sulfate radicals, and the combined effect of chloride oxides and sulfate radicals on the DMF degradation. Farhat et al. showed that the sulfate radical reacted with Cl− to directly form Cl˙ radicals (eqn (9)), which have a great oxidative capacity.43 At NaCl ratios above 60%, Cl− competed with SO4− for the adsorption position on the electrode surface, thus inhibiting the production of sulfate radicals. Under this condition, the addition of NaCl had a reverse effect on DMF degradation.
| SO42− → SO4˙− + e− | (5) |
| 2Cl− → Cl2 + 2e− | (6) |
| Cl− + 2H2O → ClO2 + 4H+ + 5e− | (7) |
| 2Cl− + H2O → Cl2O + 2H+ + 4e− | (8) |
| SO4˙− + Cl− → Cl˙ + SO42− | (9) |
Electrochemical degradation mechanism of DMF
The DMF degradation pathway can be determined through the analysis of intermediate products. Herein, we employed GC-MS to determine the low-molecular-weight substances from DMF degradation. Sample solutions electrolyzed for 7 h under optimal conditions and 8 h under chlorine-free conditions were analyzed and compared.Three peaks were obtained in the unchlorinated group and their retention times were 1.325–1.675 min, 1.958–3.292 min, and 3.875–4.208 min. Two peaks appeared in the other group, and their retention times were 1.308–1.617 min and 2.542–2.708 min.
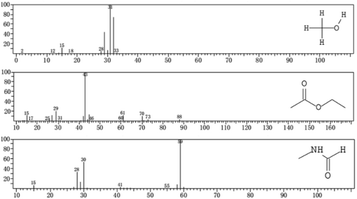
According to the EI analysis and database comparison, there were three substances in the unchlorinated group (Fig. 8). The substance at m/z 31 was judged to be methanol (CH3OH), and that at m/z 43 was judged as ethyl acetate (CH3COOCH2CH3), and that at m/z 59 was judged as methylformamide (C2H5NO).
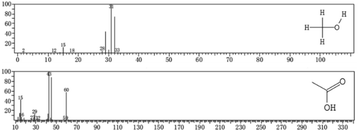
Through the same analysis method, two substances were inferred in the spectra of the optimal-condition group (Fig. 9). The substance at m/z 31 was also judged as methanol (CH3OH). The intermediate product at m/z 43 was identified as acetic acid (CH3COOH).
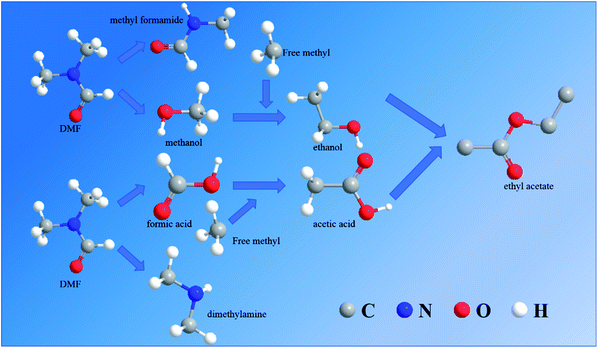
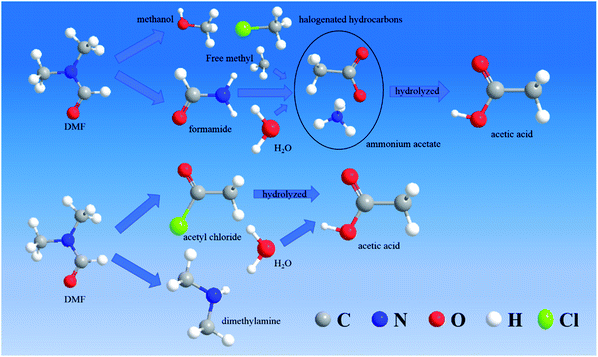
According to the speculated degradation product information and other studies on the DMF degradation mechanism,12,13 the suggested degradation pathways of DMF by electrochemical oxidation were obtained (Fig. 10 and 11). Fig. 10 shows the degradation pathway for the degradation reaction involving no chlorine. In route 1, the C–N bond of the amide was destroyed to generate formic acid and dimethylamine. Part of the dimethylamine became gaseous and escaped, while the other part continued to be oxidized until it became NO2−, NO3−, and N2. Part of the formic acid was mineralized to CO2 and H2O, and the remaining part was converted into acetic acid by the removal of a hydrogen atom and the addition of a free methyl group. In route 2, the methyl group of the amide was removed and connected with the free hydroxyl to form methanol. The remaining methyl formamide remained in the water. In part of the methanol, a hydrogen atom was removed, and a free methyl group was connected to form ethanol. Finally, the acetic acid in route 1 and the ethanol in route 2 reacted to synthesize ethyl acetate. This reaction was not a dehydration condensation reaction but a free radical reaction in solution.
The degradation pathway when chlorine participated in the degradation reaction is displayed in Fig. 11. Route 3 was the C–N bond cleavage of the amide under the action of chlorine to generate dimethylamine and acetyl chloride, and the acetyl chloride was hydrolyzed to form acetic acid. In route 4, all the methyl groups attached to the amide were removed and formed methanol and halogenated hydrocarbons with free hydroxyl or chlorine. Formamide continued to be oxidized to form ammonium acetate, which underwent hydrolysis to form acetic acid and ammonia. Compared with the degradation in the chlorine-free group, the DMF degradation involving chlorine was more thorough.
The DMF degradation process under optimal conditions included these four routes. Due to the increase in the pH value during electrochemical oxidation involving chlorine, ethyl acetate would be hydrolyzed under alkaline conditions to produce acetate, so that the ethyl acetate was not detected in samples containing chlorine. To protect the acidic volatiles in the sample, the sample solution was adjusted to acid after sampling. Thus, a part of acetic acid was not produced directly but by the hydrolysis of intermediate products.
However, the analysis is incomplete due to a few reasons; for example, the molecular weights of the products were too small to be detected, and the EI ionization source may knock out Cl and make it impossible to detect chlorinated substances. Nonetheless, the degradation pathway, deduced based on the GC-MS analysis of the product combined with other studies on DMF degradation mechanism, is still valuable.
Conclusions
In the study on the electrochemical degradation of DMF, the Ti/RuO2–IrO2 electrode was determined to be the experimental electrode. Through CV tests, the oxidation was determined as indirect, and the active group playing a major role was identified as sulfate radical by molecular probe experiments.In this study, the effects of current density, pH, and NaCl proportion on the DMF degradation were investigated, and the experimental conditions were optimized using RSM. The optimum experimental conditions were obtained as follows: current density = 47 mA cm−2, pH = 5.5, and NaCl proportion = 15%. Under the optimal conditions, the removal rate of 50 mg L−1 DMF within 7 h was 97.2%. The DMF degradation mechanism under optimal conditions was investigated through DEMS experiments.
The DMF degradation products under optimal and chlorine-free conditions were analyzed, and based on the results, four possible degradation pathways were proposed. The toxic intermediate methylformamide was found in the products of the chlorine-free group. Thus, the participation of chlorine in the reaction allows for more complete degradation and elimination of toxic intermediates.
Author contributions
Xuyang Hu: conceptualization, methodology, writing – original draft preparation, Hao Dong: resources, data curation, Yinghao Zhang: visualization, investigation, Baihui Fang: validation, project administration, Wenqiang Jiang: supervision, writing – review & editing, conceptualization.Conflicts of interest
There are no conflicts to declare.Acknowledgements
This work was supported by the Natural Science Foundation of Shandong Province, China (ZR2014JL012). We thank LetPub (http://www.letpub.com) for its linguistic assistance during the preparation of this manuscript.Notes and references
- S. Garcia-Segura and E. Brillas, J. Photochem. Photobiol., C, 2017, 31, 1–35 CrossRef CAS.
- P. D. Jepson and R. J. Law, Science, 2016, 352, 1388 CrossRef CAS.
- E. Brillas and C. A. Martínez-Huitle, Appl. Catal., B, 2015, 166–167, 603–643 CrossRef CAS.
- S. Swaroop, P. Sughosh and G. Ramanathan, J. Hazard. Mater., 2009, 171, 268–272 CrossRef CAS.
- G. Sun, A. Xu, Y. He, M. Yang, H. Du and C. Sun, J. Hazard. Mater., 2008, 156, 335–341 CrossRef CAS.
- P. Venkatesu, Fluid Phase Equilib., 2010, 298, 173–191 CrossRef CAS.
- S. S. Kumar, M. S. Kumar, D. Siddavattam and T. B. Karegoudar, J. Hazard. Mater., 2012, 199–200, 58–63 CrossRef.
- T. H. Kim, Y. W. Kim, S. M. Shin, C. W. Kim, I. J. Yu and S. G. Kim, Chem.-Biol. Interact., 2010, 184, 492–501 CrossRef CAS.
- M. J. Twiner, M. Hirst, A. Valenciano, T. R. Zacharewski and S. Jeffrey Dixon, Toxicol. Appl. Pharmacol., 1998, 153, 143–151 CrossRef CAS.
- C. P. Chang, J. N. Chen, M. C. Lu and H. Y. Yang, Chemosphere, 2005, 58, 1071–1078 CrossRef CAS.
- P. Dou, J. Song, S. Zhao, S. Xu, X. Li and T. He, Process Saf. Environ. Prot., 2019, 130, 317–325 CrossRef CAS.
- N. Grosjean, C. Descorme and M. Besson, Appl. Catal., B, 2010, 97, 276–283 CrossRef CAS.
- X. Zhou, W. Jin, C. Sun, S.-H. Gao, C. Chen, Q. Wang, S.-F. Han, R. Tu, M. A. Latif and Q. Wang, Chem. Eng. J., 2018, 343, 324–330 CrossRef CAS.
- N. Yang, X. Chen, F. Lin, Y. Ding, J. Zhao and S. Chen, J. Hazard. Mater., 2014, 264, 278–285 CrossRef CAS.
- Z. Kong, L. Li, R. Kurihara, K. Kubota and Y. Y. Li, Water Res., 2018, 139, 228–239 CrossRef CAS.
- M. A. Oturan and J.-J. Aaron, Crit. Rev. Environ. Sci. Technol., 2014, 44(23), 2577–2641 CrossRef CAS.
- B. Rajasekhar, U. Venkateshwaran, N. Durairaj, G. Divyapriya, I. M. Nambi and A. Joseph, J. Environ. Manage., 2020, 266, 110469 CrossRef CAS.
- H. Särkkä, A. Bhatnagar and M. Sillanpää, J. Electroanal. Chem., 2015, 754, 46–56 CrossRef.
- Ö. Kahraman and İ. Şimşek, J. Cleaner Prod., 2020, 267, 122168 CrossRef.
- Y. Deng, N. Chen, C. Feng, F. Chen, H. Wang, P. Kuang, Z. Feng, T. Liu, Y. Gao and W. Hu, Chem. Eng. J., 2019, 364, 349–360 CrossRef CAS.
- C. Gutiérrez, H. K. Hansen, P. Núñez and E. Valdés, Electrochim. Acta, 2015, 181, 228–232 CrossRef.
- R. Zhao, X. Zhang, F. Chen, X. Man and W. Jiang, Int. J. Environ. Res. Public Health, 2019, 16, 343 CrossRef CAS.
- G. Cerisola and M. Panizza, Chem. Rev., 2009, 109, 6541–6569 CrossRef.
- J. Sun, H. Lu, H. Lin, L. Du, W. Huang, H. Li and T. Cui, Sep. Purif. Technol., 2012, 88, 116–120 CrossRef CAS.
- J. Cai, M. Zhou, Y. Liu, A. Savall and K. Groenen Serrano, Chemosphere, 2018, 204, 163–169 CrossRef CAS.
- E. Mostafa, P. Reinsberg, S. Garcia-Segura and H. Baltruschat, Electrochim. Acta, 2018, 281, 831–840 CrossRef CAS.
- S. Garcia-Segura, J. D. Ocon and M. N. Chong, Process Saf. Environ. Prot., 2018, 113, 48–67 CrossRef CAS.
- Y. He, H. Lin, Z. Guo, W. Zhang, H. Li and W. Huang, Sep. Purif. Technol., 2019, 212, 802–821 CrossRef CAS.
- S. Sharma and H. Simsek, Chemosphere, 2020, 238, 124669 CrossRef CAS.
- D. Rajkumar, J. Guk Kim and K. Palanivelu, Chem. Eng. Technol., 2005, 28, 98–105 CrossRef CAS.
- D. Zhi, J. Zhang, J. Wang, L. Luo, Y. Zhou and Y. Zhou, J. Environ. Manage., 2020, 265, 110571 CrossRef CAS.
- R. A. Herrada, G. Acosta-Santoyo, S. Sepúlveda-Guzmán, E. Brillas, I. Sirés and E. Bustos, Electrochim. Acta, 2018, 263, 353–361 CrossRef CAS.
- O. Cuevas, R. A. Herrada, J. L. Corona, M. G. Olvera, S. Sepúlveda-Guzmán, I. Sirés and E. Bustos, Electrochim. Acta, 2016, 208, 282–287 CrossRef CAS.
- V. Krstić and B. Pešovski, Hydrometallurgy, 2019, 185, 71–75 CrossRef.
- L. Zhou, W. Zheng, Y. Ji, J. Zhang, C. Zeng, Y. Zhang, Q. Wang and X. Yang, J. Hazard. Mater., 2013, 263(Pt 2), 422–430 CrossRef CAS.
- A. J. Stemmler and C. J. Burrows, JBIC, J. Biol. Inorg. Chem., 2001, 6, 100–106 CrossRef CAS.
- J. Wei, G. Furrer and R. Schulin, J. Environ. Qual., 2000, 29, 1481–1487 CrossRef CAS.
- J. Cai, M. Zhou, Y. Pan, X. Du and X. Lu, Appl. Catal., B, 2019, 257, 117902 CrossRef CAS.
- P. Chanikya, P. V. Nidheesh, D. Syam Babu, A. Gopinath and M. Suresh Kumar, Sep. Purif. Technol., 2021, 254, 117570 CrossRef CAS.
- C. Zhou, Y. Wang, J. Chen and J. Niu, Sci. Total Environ., 2019, 688, 75–82 CrossRef CAS.
- S. Ahmadzadeh and M. Dolatabadi, J. Mol. Liq., 2018, 254, 76–82 CrossRef CAS.
- M. Luna-Trujillo, R. Palma-Goyes, J. Vazquez-Arenas and A. Manzo-Robledo, J. Electroanal. Chem., 2020, 878, 114661 CrossRef CAS.
- T. Nath Das, J. Phys. Chem. A, 2017, 105, 9142–9155 Search PubMed.
Footnote |
| † Electronic supplementary information (ESI) available. See DOI: 10.1039/d0ra10181h |
| This journal is © The Royal Society of Chemistry 2021 |

