 Open Access Article
Hydrogen production by electrochemical reaction using ethylene glycol with terephthalic acid†
Se-Hyun Kimad,
Sang-Won Wooa,
Chan-Soo Kimb,
Sung-Eun Lee*c and
Tae-Oh Kim*ad
aDepartment of Environmental Engineering, Kumoh National Institute of Technology, Gumi 39177, Republic of Korea. E-mail: tokim@kumoh.ac.kr
bMarine Energy Convergence & Integration Laboratory, Jeju Global Research Center, Korea Institute of Energy Research, Jeju, Republic of Korea
cDepartment of Applied Biosciences, Kyungpook National University, Daegu 41566, Republic of Korea. E-mail: selpest@knu.ac.kr
dDepartment of Energy Engineering Convergence, Kumoh National Institute of Technology, Gumi 39177, Republic of Korea
First published on 7th January 2021
Abstract
In this study, ethylene glycol (EG) and terephthalic acid (TPA) were used to generate hydrogen using copper electrodes in an alkaline aqueous solution and the corresponding reaction mechanism was experimentally investigated. Both EG and TPA produced hydrogen; however, TPA consumed OH−, inhibiting the production of intermediary compounds of EG and causing EG to actively react with H2O, ultimately leading to enhanced hydrogen production. In addition, the initiation potential of water decomposition of the EG and TPA alkaline aqueous solution was 1.0 V; when 1.8 V (vs. RHE) was applied, the hydrogen production reached 440 mmol L−1, which was substantially greater than the hydrogen production rate of 150 mmol L−1 during water decomposition.
Introduction
Hydrogen does not emit pollutants and can solve the problem of environmental pollution and resource depletion caused by fossil fuels.1 Hydrogen is mainly produced using fossil fuels, biomass, and water; however, among these resources, fossil fuels have been the major raw material used in the production of hydrogen, causing resource depletion and environmental pollution.2 Biomass can be classified as a clean energy source in terms of the carbon cycle, but much research is still needed.3 The electrochemical method of generating hydrogen using water is a simple, environmentally friendly, and highly reliable technology, but it has a disadvantage of being a less efficient process than hydrogen production from fossil fuels.4–6 Numerous researchers have investigated methods to improve the low efficiency by using catalysts6–9 and inserting materials capable of generating hydrogen.10–12In water decomposition, water is decomposed into hydrogen and oxygen via a redox reaction, where an electric current flow between two electrodes in a device containing an electrolyte.13 The electrodes used in the water decomposition reaction are mainly Pt, Ru, and Ir, which are noble metals with excellent efficiency and durability; however, further research is being conducted to replace them because of their high cost. For example, transition metals such as Ni, Co, Cu, Mo, and W have been considered as direct electrode replacements; in addition, bonds between metals, bonds between metals and non-metals (e.g., S, P, Se, and C), and alterations of the morphology (e.g., nanowires, nanoparticles, and core–shell structures) have been suggested as approaches to the development of alternative electrode materials.6–9 Generally, Ni has been used as electrodes in the transition metals. Several studies have noted that Cu electrodes are very inexpensive and stably promote oxidation reactions of alcohols such as methanol and ethanol.14,15 Recently, we demonstrated the usefulness of Cu electrodes as replacements for expensive metals and identified the reaction mode.16 In the previous study, we successfully decomposed ethylene glycol (EG) and terephthalic acid (TPA), which are the main raw materials of polyethylene terephthalate (PET), in an alkaline electrolyte to generate large amounts of hydrogen and methane.17
This study demonstrates the high-efficiency oxidation of EG and TPA by using the result of a highly efficient oxidation reaction mechanism for alcohols such as EG in the aforementioned hydrogen generation study on the Cu electrode. EG has low toxicity and flammability, but high energy density. Therefore, numerous studies involving EG have been conducted in the fuel cell field.18–22 However, to the best of our knowledge, no studies on the electrochemical hydrogen generation reaction using EG and TPA have been reported. This study was conducted to facilitate hydrogen production via the addition of EG and TPA to an alkaline electrochemical system with a Cu electrode and was based on our previous studies on hydrogen production using EG and TPA and on the usefulness of Cu electrodes.16,17 An additional objective of this study was to elucidate the reaction mechanisms and hydrogen production changes when generating hydrogen from EG and TPA by defining the role of EG and TPA in the reaction (Table 1 is the list of acronyms used in the text).
| Acronyms | |
|---|---|
| EG | Ethylene glycol |
| TPA | Terephthalic acid |
| KCl sat'd | KCl saturated |
| CV | Cycle voltammetry |
| LSV | Linear sweep voltammetry |
| FT-IR | Fourier-transform infrared spectroscopy |
| ATR | Attenuated total reflectance |
| 1H-NMR | 1H-Nuclear magnetic resonance |
| DMSO | Dimethyl sulfoxide |
| GC-TCD | Gas chromatography with a thermal conductivity detector |
| K2TP | Dipotassium terephthalate |
| HK3TP | Tripotassium hydrogen terephthalate |
| HKTP | Potassium hydrogen terephthalate |
| XRD | X-ray diffraction |
Experimental data
Electrochemical measurements
Hydrogen generation and amphoteric experiments in this study were conducted using EG (Samchun, 99.5%) and TPA (Junsei, 99%). After a certain amount of EG and TPA were dissolved in ultrapure water (Human Corp.), 0.1 M KOH (Daejung, 85.0%) was added as an electrolyte and tested under continuous stirring at 200 rpm. Experiments conducted with 0.1 M KOH solution but without the addition of EG and TPA are hereafter referred to as “water decomposition (none)”.The experiments were conducted in a three-electrode batch reactor without an ion-exchange membrane; the reactor was a Φ 5.5 cm × 7 cm glass cylinder. The working electrode was Cu (1 cm × 1 cm plate), the counter electrode was Pt (1 cm × 1 cm plate), and the reference electrode was a Ag/AgCl (KCl sat'd) electrode.
Cyclic voltammetry (CV) was conducted using a potentiostat (AMETEK, VersaSTAT3) to confirm the redox reaction of EG and TPA. The measurement conditions were 22 °C and 1 atm, and the voltage range was 0.2 to 1.5 V. The scan rate was 50 mV s−1. The CV results were analyzed using the AMETEK VersaStudio software.
Linear sweep voltammetry (LSV) was conducted to observe the change in current density in the voltage range from 0.8 to 1.8 V and with the scan rate set to 10 mV s−1, when EG and TPA were added.
Characterization
Fourier-transform infrared spectroscopy (FT-IR) (Bruker Korea, VERTEX 80v) analysis was conducted to confirm the oxidation and reduction process of EG and TPA. A ZnSe crystal was used for the attenuated total reflectance (ATR) method, and wavenumbers for EG and TPA were recorded according to the experimental method. A 0.1 M KOH solution was used as a reference sample.In addition, 1H-Nuclear magnetic resonance (1H-NMR; Bruker Korea, AVANCE III 400) analysis was carried out at a frequency of 400 MHz and at room temperature to elucidate the reaction mechanism of TPA. The TPA sample for NMR analysis was dissolved in dimethyl sulfoxide-d6 as a solvent. In addition, in order to confirm the reaction mechanism of TPA in the alkaline electrolyte, dissolving TPA in KOH solution was analyzed, and KOH peaks was excluded at the interpretation process of analytical results.
Hydrogen produced by the oxidation reaction of EG and TPA was qualitatively and quantitatively analyzed using gas chromatography with a thermal conductivity detection (GC-TCD; PerkinElmer, Clarus 680); the column was a ShinCarbon ST (2 M, 1 mm ID, RESTEK). Hydrogen generated in the batch reactor was collected with a gas syringe (SGE syringe, removable-needle-type gas-tight syringe) at regular intervals and subsequently analyzed; data analyses were carried out using the PerkinElmer's TotalChrom Navigator software.
Results and discussions
Cycle voltammetry
Cycle voltammetry (CV) was performed to determine how the redox reaction between EG and TPA proceeds in an alkaline electrolyte. Fig. 1 shows the CV results recorded with a scan rate of 50 mV s−1 using 1.0 M EG and 10 mM TPA in 0.1 M KOH solution, respectively.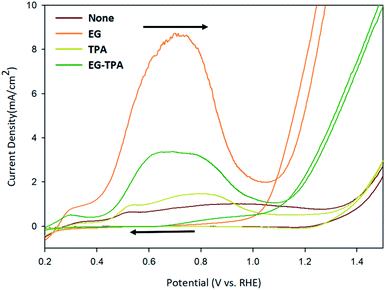 | ||
| Fig. 1 Cyclic voltammograms of EG and TPA in 0.1 M KOH solution, as recorded at a scan rate of 50 mV s−1. | ||
The oxidation reaction of EG (orange line) began at 0.4 V, reached a maximum at 0.7 V, decreased to 1.0 V, and rose again from 1.1 V. The CV results can be explained on the basis of the following previously reported reactions:20–24
(Anode)
| Cu + 2OH− → CuOH2 + 2e− | (1) |
| Cu(OH)2 + OH− → CuOOH + H2O + e− | (2) |
| C2H6O2 + 2CuOOH → C2H4O2 + 2Cu(OH)2 | (3) |
| C2H4O2 + 2CuOOH + OH− → C2H3O3− + 2Cu(OH)2 | (4) |
| C2H3O3− + 2CuOOH → CHOCOO− + 2Cu(OH)2 | (5) |
| CHOCOO− + 2CuOOH + 3OH− + Cu2+ → COOCOO2− + 3Cu(OH)2 | (6) |
| C2H6O2 + 2H2O → 2CO2 + 10H+ + 10e− | (7) |
| 2OH− → H2O + 2e− + 0.5O2 | (8) |
(Cathode)
| 2H2O + 2e− → 2OH− + H2↑ | (9) |
| 4H+ + 4e− → 2H2↑ | (10) |
In the previous study, the initial Cu electrode produced CuOOH by OH adsorption (eqn (1) and (2)) on the anode surface. The CV result of EG can be explained by the reaction of eqn (4)–(10).20,21 The highly oxidative peak of 0.7 V corresponds to the presence of intermediate compounds. EG reacts with CuOOH at the anode to form glycolaldehyde (C2H4O2) (eqn (3)), which has been known to produce intermediates such as glycolate (C2H3O3−), glyoxalate (CHOCOO−), and oxalate (COOCOO2−) (eqn (4)–(6)).23
Deng et al.24 deduced the appearance of hydrogen and carbon dioxide by EG reacting with H2O (eqn (7)). An increase from 1.1 V corresponds to a hydrogen ion generation reaction in which EG and H2O react under alkaline conditions. Specifically, after 1.1 V, OH− is deprived of electrons to generate H2O (eqn (8)), and EG reacts with H2O to generate hydrogen ions (eqn (7)). And the generated hydrogen ions react with electrons in the cathode to become hydrogen gas.
In the cyclic voltammograms for TPA (Fig. 1, dark-yellow line), oxidation started at 0.4 V, decreased at 0.8 V and restarted at 1.3 V. The CV results for TPA were also found to be consistent with the reaction schemes presented in various literature.
| KOH → K+ + OH− | (11) |
| C8H6O4 + 2K+ + 2OH− → C8H4O4K2(K2TP) + 2H2O | (12) |
(Cathode)
| C8H4O4K2 + K+ + e− → C8H5O4K3(HK3TP) + 0.5H2 | (13) |
(Anode)
| C8H5O4K3 → C8H5O4K(HKTP) + 2K+ + 2e− | (14) |
When the reaction starts at the anode, the KOH dissociated into K+ and OH− in water; the K+ and OH− then reacted with TPA to form dipotassium terephthalate (K2TP) through the neutralization reaction shown in eqn (12).24
Wang et al.25 reported a reduction reaction in which a part of water-soluble TPA forms hydrogen and tripotassium hydrogen terephthalate (HK3TP) in the cathode (eqn (13)). The generated HK3TP was transformed to potassium hydrogen terephthalate (HKTP) through oxidation at the anode. Interpreting the TPA CV results in Fig. 1, we speculate that the oxidation reaction starting from 0.4 V was due to the HKTP produced in eqn (14).
The CV analysis of EG-TPA (green line) was conducted by adding EG 1.0 M and TPA 10 mM simultaneously to a 0.1 M KOH solution. The shape of the CV curve of EG-TPA is similar to that of EG; however, EG-TPA has a low current density of 3 mA cm−2 at 0.7 V, whereas the highest current density of EG at 0.7 V is 9 mA cm−2. The low current density of EG-TPA is attributed to TPA reacting with OH− to produce K2TP (eqn (12)). In the redox reaction of EG-TPA, EG is reacted with a Cu electrode and OH−, resulting in a production of a large amount of intermediates such as glycol aldehyde (C2H4O2), glycolate (C2H3O3−), glyoxalate (CHOCOO−), and oxalate (COOCOO2−). In addition, TPA also runs a reaction that consumes OH−. Therefore, unlike the case of the redox reaction of EG alone, the amount of intermediate compounds generated in the EG-TPA reaction decreases, and the current density for the oxidation reaction decreases. When both EG and TPA are present, both EG and TPA generate hydrogen, and TPA particularly consumes OH−, which decreases the amount of formed EG intermediates, and ultimately decreases the current density with allowing EG to react actively with H2O, and finally produces a lot of hydrogen.
FT-IR
Eqn (4)–(6) and (12) were inferred from the CV results, and FT-IR was used to characterize the intermediates shown in the equations. Fig. 2 shows the FT-IR spectrum of products obtained after 3 h electrolysis at 0.7 V in EG (orange line), TPA (dark yellow line) and EG-TPA (green line) in 0.1 M KOH solution. As recorded in the area 1000–2000 cm−1; the peak of the 0.1 M KOH solution was removed as the reference peak.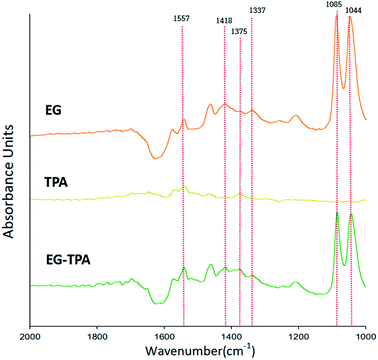 | ||
| Fig. 2 FT-IR spectra in the wavenumber range 1000–2000 cm−1, as obtained after electrochemical reaction of EG and TPA in 0.1 M KOH solution at 0.7 V for 3 h. | ||
In the spectrum of EG (Fig. 2), absorption peaks of glyoxal and glycolate (eqn (4) and (5)) are identified at 1044 and 1085 cm−1, and a peak of oxalate (eqn (6)) is observed at 1337 cm−1. The peak of CO32− (eqn (7)) is observed at 1375 cm−1, and acetate and glycolate absorption bands appear at 1418 cm−1. The presence of the acetate or glycolate absorption band associated with eqn (3) demonstrates that the spectral absorption bands of the intermediate compounds predicted in eqn (4)–(6) coincide with the FT-IR results.26–30 The peaks in the TPA spectrum were less intense than the baseline of the EG and EG-TPA spectra, and absorption bands were identified in the region from 1200 to 1600 cm−1. These results are explained in greater detail in the discussion of Fig. 3.
The spectrum of EG-TPA is similar to that of EG in that both show absorption bands at 1085, 1044, and 1337 cm−1, which are the absorption bands of the intermediate compounds shown in eqn (4)–(6); however, the absorption peaks in the spectrum of EG-TPA are less intense than those in the spectrum of EG. This result is attributed to EG and TPA reacting with OH− in the reactor, which was an important factor for intermediate compound formation (eqn (4)–(6) and (12)); as a result, the peak height of the spectrum was reduced. However, the reaction of EG with OH− has been reported to occur as an electrochemical reaction (eqn (4)–(6)), whereas that of TPA with OH− has been reported to occur through neutralization (eqn (12)); this issue should be clarified.
As shown in Fig. 2, the FT-IR spectra of the product obtained after 3 h of electrochemical reaction of EG, TPA, and EG-TPA are consistent with the reactions in eqn (4)–(6); by contrast, no peaks of products associated with the reaction between TPA and OH− are observed. Thus, determining whether the intermediate compound is formed by the neutralization reaction before the electrochemical reaction occurs requires analysis of the change in TPA before the neutralization reaction, the change in the neutralization reaction before the electrolysis reaction, or the change after the electrochemical reaction.
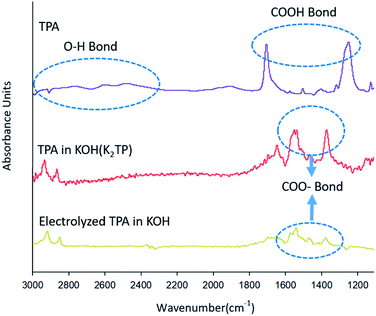
Fig. 3 shows different FT-IR spectra in the wavelength range 1100–3000 cm−1 for TPA (purple line) dissolved in DMSO, TPA (red line) dissolved in 0.1 M KOH solution, and TPA (yellow line) after electrochemical reaction, showing changes in the spectra as a result of various chemical reactions. The TPA intrinsic spectrum (purple line) was recorded with the sample dissolved in DMSO, which is known as a stable solvent,31 and the DMSO peak was removed. The spectrum of TPA was confirmed to show O–H bonds, as indicated by the inherent peaks between 3000 and 2400 cm−1, and COOH bonds, as indicated by the peaks at 1700 and 1250 cm−1.32–34 The spectrum of TPA (red line) dissolved in KOH solution, which leads to a neutralization reaction before the electrochemical reaction, shows peaks of COO− groups at 1500 and 1300 cm−1 but does not show an OH peak, in contrast to the spectrum of TPA (purple line).32–34 These results indicate that the H+ of COOH is substituted by K+, leading to the formation of K2TP, when TPA is dissolved in KOH solution (eqn (12)).
After the electrochemical reaction, the COO− peak in the FT-IR spectrum of the TPA (yellow line) in Fig. 3 is less intense than the absorption band of K2TP produced by the neutralization (red line). Our ability to clearly identify and explain this phenomenon is hampered by a lack of related studies. However, Wang et al.25 calculated the H+/TPA ratio on the basis of the amount of charge consumed to reduce H+ in TPA and by X-ray diffraction (XRD) measurements, which revealed different patterns for TPA and K2TP. These two results indicate that HKTP would be generated after TPA was reduced to HK3TP in the electrochemical reaction.
However, they also noted that the XRD patterns alone cannot discern the presence of HKTP; thus, further investigation is needed to confirm the identity of the product after electrochemical reaction. After 3 h electrolysis at 0.7 V in 0.1 M KOH solution. As recorded in the area 1000–2000 cm−1; the peak of the 0.1 M KOH solution was removed as the reference peak.
H-NMR
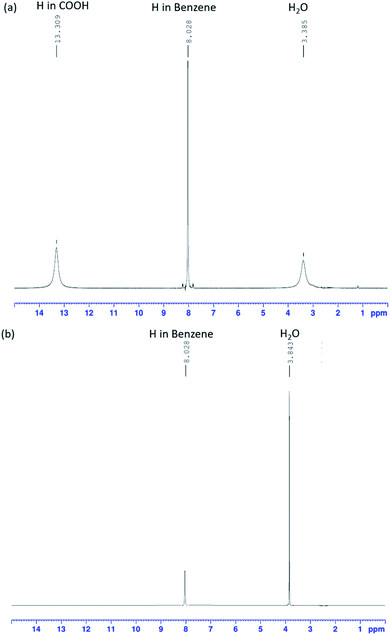
Using FT-IR spectra alone to determine the presence of K2TP produced by a neutralization reaction is difficult. 1H-NMR analysis (Fig. 4), which is commonly used to analyze the structure of organic compounds, was additionally used to resolve this problem. Fig. 4(a) shows the peaks of TPA sample, and Fig. 4(b) shows the peaks of dissolving TPA in KOH solution, and then the KOH peaks were not accounted for interpretation. Fig. 4(a) and (b) shows the 1H-NMR spectra of TPA before and after neutralization in KOH solution. The samples were analyzed under a frequency of 400 MHz and at room temperature. In both spectra, signals of H atoms of H2O and benzene are simultaneously observed.In the spectrum of pre-reaction TPA (Fig. 4(a)), the peak of the H atom of COOH groups is observed, whereas it is not observed in the spectrum of the TPA neutralized in KOH aqueous solution (Fig. 4(b)). The intensity of the H2O peak increased compared with that in the spectrum of TPA. This result is consistent with the FT-IR spectrum of TPA (red line) dissolved in 0.1 M KOH solution, which corresponds to eqn (12). The O–H bonds of COOH dissociated, and the H+ ions were substituted by K+ ions; K2TP and H2O were thus formed.32,33 The FT-IR and 1H-NMR results shows that TPA dissolved in KOH solution, resulting in the formation of K2TP and H2O, thus verifying eqn (12). These results therefore demonstrate that TPA interfered with the intermediate of EG.
Linear sweep voltammetry
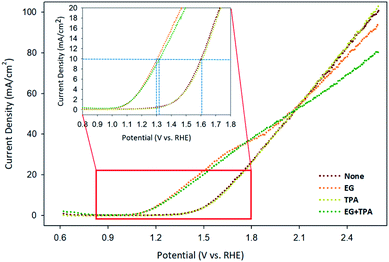
Linear sweep voltammetry (LSV) was analyzed to confirm the oxidation potential of EG, TPA, and EG-TPA. Fig. 5 shows the LSV results obtained when EG (1.0 M) and TPA (10 mM) were added to 0.1 M KOH solution; the voltammograms were recorded using a Cu working electrode, Pt counter electrode, and Ag/AgCl [KCl sat'd] reference electrode at a scan speed of 10 mV s−1. As shown in Fig. 5, the onset potential of 0.1 M KOH solution, which is equivalent to the potential of water decomposition (none), was 1.3 V; by contrast, the onset potential of EG was observed near 1.0 V. A previous study35 has shown that the LSV initiation potential for the oxidation of organic compounds such as ethanol, benzyl alcohol, furfuryl alcohol, and furfural was 1.3 V; the LSV results for EG in the present study show lower initiation potentials. In addition, in Fig. 5, the current density at which the water decomposition occurs is 10 mA cm−2; at this point, EG showed an overpotential 0.3 V lower overpotential than those of water decomposition (none) and TPA. This result means that the addition of EG initiated an oxidation reaction at a lower potential. We assumed that the onset potential or overpotential of TPA is similar to those overpotential when only water decomposition (none) is added and thus does not strongly influence the current density. EG-TPA has an onset potential similar to that of EG; however, at potentials greater than 1.15 V, the same potential reference current density is low, which is related to eqn (1) and (2) described in the analysis of the CV results. In EG-TPA, the Cu electrode reacts with OH− to produce Cu(OH)2 or CuOOH, losing electrons (eqn (1) and (2)). However, EG and TPA were added simultaneously, resulting in a neutralization reaction, thereby reducing the amount of OH− and the number of electrons released by Cu. According to previous studies,16,36,37 Cu(III) species in CuOOH are known to serve as excellent catalysts in electrochemical reactions. Therefore, OH− consumption by TPA may result in a decrease of electron production and an abundance of Cu(III) species, lowering the current density, consistent with the LSV results.The amount of hydrogen produced by GC
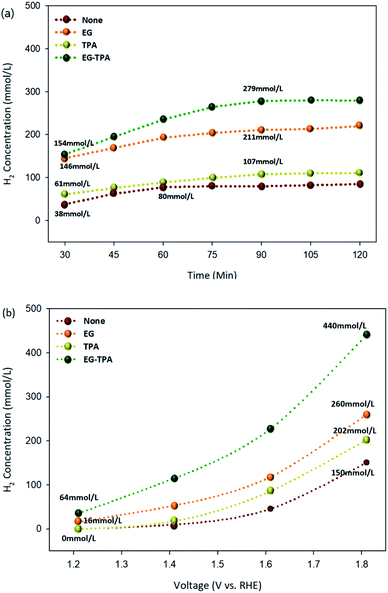
Hydrogen production under each condition was analyzed using GC-TCD. The highest hydrogen production rates of EG and TPA were observed at concentrations of 1.0 M and 10 mM, respectively. The hydrogen production chromatogram (Fig. S1†) and the results of hydrogen production according to the concentrations of EG and TPA (Fig. S2†) are presented in the section of ESI.† Fig. 6(a) and (b) are graphs showing the amount of hydrogen produced as functions of time and voltage for EG (1.0 M), TPA (10 mM), and EG-TPA (1.0 M and 10 mM) in 0.1 M KOH solution, and the standard deviations for the measurement of concentration was (±) 5%. The experiment represented in Fig. 4(a) was conducted for 120 min, with the first analysis at 30 min and subsequent analyses every 15 min after the start of the electrochemical reaction with the voltage fixed at 1.6 V. Hydrogen production increased when EG and TPA were added compared with the hydrogen production when water decomposition was performed. EG produced more than 140 mmol L−1 of hydrogen at 30 min and 211 mmol L−1 at 90 min, and TPA produced approximately 61 mmol L−1 of hydrogen at 30 min and 107 mmol L−1 at 90 min. TPA produced less hydrogen than EG. These results demonstrating that EG produces more hydrogen than TPA are similar to eqn (7), (10), and (13) discussed in the analysis of the CV results. EG-TPA exhibited the highest hydrogen production: 154 mmol L−1 at 30 min and 279 mmol L−1 at 75 min.In the experiment represented in Fig. 6(b), the voltage was increased from 1.2 to 1.8 V under conditions otherwise identical to those used in the experiment represented in Fig. 6(a), and the hydrogen production was measured after 30 min for each voltage. The hydrogen production tended to increase with increasing voltage under all of the investigated experimental conditions. At the highest applied voltage of 1.8 V, the amount of hydrogen generated under each condition was 150 mmol L−1 for water decomposition (none), 260 mmol L−1 for EG, 202 mmol L−1 for TPA, and 440 mmol L−1 for EG-TPA. The simultaneous addition of EG and TPA resulted in a 66% increase of hydrogen production over water decomposition, whereas the addition of EG alone resulted in a 41% increase. None and TPA produced no hydrogen at the initial applied voltage of 1.2 V; however, a small amount of hydrogen (16 mmol L−1) was produced from EG. This result means that EG produces approximately two times greater than that produced in EG and was measured to be approximately 440 mmol L−1 at 1.8 V. Fig. 6(b) shows that EG produces more hydrogen than TPA and that the highest amount of hydrogen is produced when EG-TPA is added. Fig. 6(a) and (b) shows that EG and TPA both produce hydrogen, as shown in eqn (7), (10), and (13); however, TPA consumes OH−, reducing the amount of intermediate compound of EG, which leads to EG actively reacting with H2O, producing a large amount of hydrogen.
Conclusions
In this study, hydrogen was produced when electrolyzing 0.1 M KOH solutions containing EG (1.0 M) and TPA (10 mM) using a Cu electrode and confirmed the role of EG and TPA in hydrogen production and the reaction mechanism. Analyses using GC-MS, GC-TCD, FT-IR, 1H-NMR, and a potentiostat/galvanostat were conducted to measure the hydrogen production and elucidate the reaction mechanism in the electrolysis of solutions containing EG and TPA. TPA consumed OH− in the KOH solution, inhibiting the formation of intermediate compounds of EG. As a result, EG oxidation (0.4–1.0 V) was diminished. In addition, the OH− consumption mechanism of TPA was confirmed by FT-IR and 1H-NMR analyses, and the initiation potential of water decomposition of the aqueous solution containing EG and TPA was 1.0 V. We applied 1.8 V (vs. RHE) to a 0.1 M KOH solution to quantitatively evaluate the hydrogen production, which revealed that hydrogen was produced at 440 mmol L−1 for EG and TPA, 260 mmol L−1 for EG, 202 mmol L−1 for TPA, and 150 mmol L−1 for water, indicating that the greatest hydrogen production was achieved when both EG and TPA were added simultaneously. These results confirm that both EG and TPA contribute to hydrogen production. However, further studies are needed to identify the intermediates formed during the electrochemical reaction of TPA and to fully elucidate the electrochemical reaction mechanisms involved when EG and TPA are simultaneously added.Conflicts of interest
There are no conflicts to declare.Notes and references
- P. Nikolaidis and A. Poullikkas, A comparative overview of hydrogen production processes, Renewable Sustainable Energy Rev., 2017, 67, 597–611 CrossRef CAS.
- U. P. M. Ashik, W. M. A. Wan Daud and H. F. Abbas, Production of greenhouse gas free hydrogen by thermocatalytic decomposition of methane – a review, Renewable Sustainable Energy Rev., 2015, 44, 221–256 CrossRef CAS.
- A. Arregi, et al., Hydrogen production from biomass by continuous fast pyrolysis and in-line steam reforming, RSC Adv., 2016, 6(31), 25975–25985 RSC.
- F. E. Chakik, M. Kaddami and M. Mikou, Effect of operating parameters on hydrogen production by electrolysis of water, Int. J. Hydrogen Energy, 2017, 42, 25550–25557 CrossRef.
- D. S. P. Cardoso, et al., Enhancement of hydrogen evolution in alkaline water electrolysis by using nickel-rare earth alloys, Int. J. Hydrogen Energy, 2015, 40, 4295–4302 CrossRef CAS.
- J. F. Callejas, et al., Synthesis, characterization, and properties of metal phosphide catalysts for the hydrogen-evolution reaction, Chem. Mater., 2016, 28, 6017–6044 CrossRef CAS.
- S. S. Jyothirmayee Aravind, et al., Molybdenum phosphide-graphite nanomaterials for efficient electrocatalytic hydrogen production, Appl. Catal., A, 2015, 490, 101–107 CrossRef CAS.
- H. A. Miller, et al., Carbon supported Au–Pd core–shell nanoparticles for hydrogen production by alcohol electroforming, Catal. Sci. Technol., 2016, 6(18), 6870–6878 RSC.
- J. F. Callejas, et al., Nanostructured Co2P electrocatalyst for the hydrogen evolution reaction and direct comparison with morphologically equivalent CoP, Chem. Mater., 2015, 27, 3769–3774 CrossRef CAS.
- H. Inoue, et al., Electrochemical hydrogen production system from ammonia borane in methanol solution, Electrochim. Acta, 2012, 82, 392–396 CrossRef CAS.
- B. Guenot, M. Cretin and C. Lamy, Electrochemical reforming of dimethoxymethane in a proton exchange membrane electrolysis cell: a way to generate clean hydrogen for low temperature fuel cells, Int. J. Hydrogen Energy, 2017, 42, 28128–28139 CrossRef CAS.
- J. Mahmoudian, et al., Electrochemical Coproduction of Acrylate and Hydrogen from 1,3-Propandiol, ACS Sustainable Chem. Eng., 2017, 5, 6090–6098 CrossRef CAS.
- I. Roger, M. A. Shipman and M. D. Symes, Earth-abundant catalysts for electrochemical and photoelectrochemical water splitting, Nat. Rev. Chem., 2017, 1, 1–13 CrossRef.
- M. Z. Luo and R. P. Baldwin, Characterization of carbohydrate oxidation at copper electrodes, J. Electroanal. Chem., 1995, 387, 87–94 CrossRef.
- H. Heli, et al., Electro-oxidation of methanol on copper in alkaline solution, Electrochim. Acta, 2004, 49, 4999–5006 CrossRef CAS.
- S.-W. Woo, et al., Dehydrogenation of pure methanol in an alkaline solution using copper electrodes, Int. J. Hydrogen Energy, 2020, 45, 31418–31424 CrossRef CAS.
- N.-G. Kim, et al., High production of CH4 and H2 by reducing PET waste water using a non-diaphragm-based electrochemical method, Sci. Rep., 2016, 6, 20512 CrossRef CAS.
- G. H. El-Nowihy, et al., Promising ethylene glycol electro-oxidation at tailor-designed NiOx/Pt nanocatalyst, Int. J. Hydrogen Energy, 2017, 42, 5095–5104 CrossRef CAS.
- O. O. Fashedemi, et al., Electro-oxidation of ethylene glycol and glycerol at palladium-decorated FeCo@Fe core–shell nanocatalysts for alkaline direct alcohol fuel cells: functionalized MWCNT supports and impact on product selectivity, J. Mater. Chem. A, 2015, 3, 7145–7156 RSC.
- E. G. Mahoney, et al., Analyzing the electrooxidation of ethylene glycol and glucose over platinum-modified gold electrocatalysts in alkaline electrolyte using in situ infrared spectroscopy, J. Power Sources, 2016, 305, 89–96 CrossRef CAS.
- W. J. Pech-rodríguez, et al., Electrocatalysis of the ethylene glycol oxidation reaction and in situ Fourier-transform infared study on PtMo/C electrocatalysts in alkaline and acid media, J. Power Sources, 2018, 375, 335–344 CrossRef.
- Q. Lin, et al., Electrocatalytic oxidation of ethylene glycol and glycerol on nickel ion implanted-modified indium tin oxide electrode, Int. J. Hydrogen Energy, 2017, 42, 1403–1411 CrossRef CAS.
- H. J. Kim, et al., Highly active and stable PtRuSn/C catalyst for electrooxidations of ethylene glycol and glycerol, Appl. Catal., B, 2011, 101, 366–375 CrossRef CAS.
- Q. Deng, et al., Potassium salts of para-aromatic dicarboxylates as the highly efficient organic anodes for low-cost K-ion batteries, Nano Energy, 2017, 33, 350–355 CrossRef CAS.
- C. Wang, et al., Using an organic acid as a universal anode for highly efficient Li-ion, Na-ion and K-ion batteries, Org. Electron., 2018, 62, 536–541 CrossRef CAS.
- E. Sitta, B. C. Batista and H. Varela, The impact of the alkali cation on the mechanism of the electro-oxidation of ethylene glycol on Pt, Chem. Commun., 2011, 47, 3775–3777 RSC.
- A. Serov, et al., Highly-active Pd–Cu electrocatalysts for oxidation of ubiquitous oxygenated fuels, Appl. Catal., B, 2016, 191, 76–85 CrossRef CAS.
- B. Wieland, et al., Electrochemical and infrared spectroscopic quantitative determination of the platinum-catalyzed ethylene glycol oxidation mechanism at CO adsorption potentials, Langmuir, 1996, 12, 2594–2601 CrossRef CAS.
- R. B. De Lima, et al., On the electrocatalysis of ethylene glycol oxidation, Electrochim. Acta, 2003, 49, 85–91 CrossRef CAS.
- L. Demarconnay, et al., Ethylene glycol electrooxidation in alkaline medium at multi-metallic Pt based catalysts, J. Electroanal. Chem., 2007, 601, 169–180 CrossRef CAS.
- Q. Wang, H. Xu and X. Li, Solubilities of terephthalic acid in dimethyl sulfoxide + water and in N,N-dimethylformamide + water from (301.4 to 373.7) K, J. Chem. Eng. Data, 2005, 50, 719–721 CrossRef CAS.
- Q. Deng, et al., Organic potassium terephthalate (K2C8H4O4) with stable lattice structure exhibits excellent cyclic and rate capability in Li-ion batteries, Electrochim. Acta, 2016, 222, 1086–1093 CrossRef CAS.
- Y. Luo, et al., A nonaqueous potassium-ion hybrid capacitor enabled by two-dimensional diffusion pathways of dipotassium terephthalate, Chem. Sci., 2019, 10, 2048–2052 RSC.
- M. Heidari, A. Sedrpoushan and F. Mohannazadeh, Selective oxidation of benzylic C–H using nanoscale graphene oxide as highly efficient carbocatalyst: direct synthesis of terephthalic acid, Org. Process Res. Dev., 2017, 21, 641–647 CrossRef CAS.
- B. You, et al., A general strategy for decoupled hydrogen production from water splitting by integrating oxidative biomass valorization, J. Am. Chem. Soc., 2016, 138, 13639–13646 CrossRef CAS.
- M. Fleischmann, K. Korinek and D. Pletcher, The kinetics and mechanism of the oxidation of amines and alcohols at oxide-covered nickel, silver, copper, and cobalt electrodes, J. Chem. Soc., Perkin Trans. 2, 1972, 10, 1396–1403 RSC.
- T. R. L. C. Paixão, D. Corbo and M. Bertotti, Amperometric determination of ethanol in beverages at copper electrodes in alkaline medium, Anal. Chim. Acta, 2002, 472, 123–131 CrossRef.
Footnote |
| † Electronic supplementary information (ESI) available: Experimental data, hydrogen production according to the concentration of ethylene glycol and terephthalic acid. See DOI: 10.1039/d0ra10187g |
| This journal is © The Royal Society of Chemistry 2021 |

