 Open Access Article
Effects of alternating current poling on the dielectric and piezoelectric properties of Pb(In0.5Nb0.5)O3–PbTiO3 crystals with a high Curie temperature
Junjie Xiongabc,
Zujian Wanga,
Xiaoming Yanga,
Rongbing Sua,
Xifa Long *abc and
Chao He
 *abc
*abc
aKey Laboratory of Optoelectronic Materials Chemistry and Physics, Fujian Institute of Research on the Structure of Matter, Chinese Academy of Sciences, Fuzhou, 350002, China. E-mail: hechao@fjirsm.ac.cn; lxf@fjirsm.ac.cn
bFujian Science & Technology Innovation Laboratory for Optoelectronic Information of China, Fuzhou, 350108, China
cUniversity of Chinese Academy of Sciences, Beijing, 100049, China
First published on 6th April 2021
Abstract
The alternating current poling (ACP) method has been become more and more popular recently because of its advantages of being low cost, time saving and highly efficient. Few ACP studies have focused on relaxor-PT crystals with a high coercive field and high Curie temperature or the effects of ACP on intrinsic and extrinsic contributions. The effects of the electric field, frequency, and number of cycles of ACP on the piezoelectric and dielectric properties of 〈001〉-oriented Pb(In0.5Nb0.5)O3–PbTiO3 ferroelectric crystals were studied. The dielectric permittivity ε33T/ε0 and piezoelectric coefficient d33 of an ACP sample are 3070 and 1400 pC N−1, respectively, which are 14% and 18% larger than those of a DCP sample. Rayleigh analysis reveals that both intrinsic and extrinsic contributions are enhanced after ACP. The poling electric field, frequency and cycle number can influence the intrinsic and extrinsic contributions. The intrinsic contribution is significantly affected by the poling electric field, and cycle number, but it is not very sensitive to frequency, while the poling electric field, frequency and cycle number are very important for the extrinsic contribution. This work demonstrates that the uniform domain patterns are a critical factor for the enhancement of the piezoelectric properties.
1. Introduction
Relaxor-PbTiO3 (relaxor-PT) ferroelectric crystals, such as Pb(Mg1/3Nb2/3)O3–PbTiO3 (PMN–PT), have been widely used in sensors, actuators, and transducers, owing to their outstanding piezoelectric coefficient (d33) and high electromechanical coupling factor (k33) (d33 > 2000 pC N−1, k33 > 0.9).1–3 Although rhombohedral PMN–PT crystals a have ultrahigh piezoelectric performance, its low Curie temperature (TC ∼ 150 °C) and small coercive field (Ec = 2–3 kV cm−1) restrict its applications at high temperature and high power. Pb(In0.5Nb0.5)O3–PbTiO3 (PIN–PT) crystals exhibit a high TC (>250 °C) and large Ec (∼8 kV cm−1), which can fill the demands at a high temperature and high field.4,5 The piezoelectric properties of PIN–PT crystals (d33 ∼ 1500 pC N−1, k33 ∼ 85%) are not as excellent as those of the PMN–PT crystals. How to promote the piezoelectricity of PIN–PT crystals is a good issue for broader device applications.In recent years, many methods have been introduced to further enhance the piezoelectric properties of relaxor-PT crystals. These strategies include adjusting the compositions, doping, using nano-electrodes, choosing better poling conditions and so on.6–19 For instance, recent studies found that Sm doped in a PMN–PT system can significantly improve the piezoelectricity.14,17 Davis et al. presented how to choose the optimal direction for poling to get a high piezoelectric performance.16 Design of the morphotropic phase boundary (MPB) can also get an excellent piezoelectric performance due to the flattened free-energy profile.18,19 A decrease of the domain size is on additional effective way to promote the piezoelectricity.10,11
Among the above methods, alternating current field poling (ACP) became more and more popular recently because of its advantages of low-cost, time-saving and high-efficiency. It has been reported that ACP is a highly efficient technique to get a high piezoelectric performance of PMN–PT crystals and can make a 40% enhancement of d33,20 while the mechanisms of the ACP method are not clear enough. Many scientists put forward their ideas on the mechanisms of ACP. Chang et al. proposed that the reason for the excellent piezoelectric performance originates from the monoclinic phase (MA).21 Luo et al. used domain growth theory to explain the transformation process of the domain structure.22 Qiu et al. presented a new idea that the improvement of the piezoelectric performance originates from polar nano regions (PNRs) or the local structure.23 He et al. subsequently investigated the Pb(Yb0.5Nb0.5)O3–PMN–PT system, and concluded that a highly ordered domain structure results in a high piezoelectric performance after ACP.8 Qiu et al. proposed that the enhancement of piezoelectric performance is related to the decrement of the 71° domain wall.24 To summarize, ACP has become a promising poling method compared with the traditional direct current poling (DCP) method, but the mechanisms is still a big challenge. At present, most of the reported ACP studies have focused on relaxor-PT crystals with a low Ec, such as PMN–PT and PIN–PMN–PT, while little attentions is paid to relaxor-PT crystals with a high TC and large Ec. In addition, the enhancement of the piezoelectric properties after ACP are related to a change of domain configuration. It is generally said that the contributions of the domain wall motion are thought to be an extrinsic contribution, which is unclear.
In this work, the piezoelectric and dielectric properties of PIN–PT crystals with a large Ec and high TC were studied using different poling electric fields, frequencies, and cycles of ACP. The Rayleigh analysis and domain structure were studied to track the relationship between the enhancement of piezoelectric properties and domain engineering.
2. Experimental procedure
The rhombohedral perovskite phase PIN–PT crystals with an Ec of 8.6 kV cm−1 and TC of 260 °C were grown in our lab using a top-seeded solution growth method. The details of the growth have been reported in our previous work.5 The actual composition was 0.66PIN–0.34PT examined by inductively coupled plasma atomic emission spectroscopy (ICP-AES, JY Ultima-2, Horiba Jobin Yvon, France). The natural {001} face can be obtained from as-grown crystals, and was examined using XRD. Then, crystals were cut into 〈001〉-oriented samples: dimensions of 4 × 4 × 0.6 mm3 (plate mode) were used for the dielectric and piezoelectric measurements and of 5 × 1 × 1 mm3 (bar mode) for the electromechanical coupling factor measurements. The grown PIN–PT crystals exhibit a natural {001} face. The {001} crystal plates were cut parallel to the natural {001} face. And the cut crystal plates were examined using XRD. All the samples were annealed at 600 °C for 6 h, with the top and bottom electrodes shorted to eliminate the residual stress fully before each poling measurement.In this work, a high-voltage supply amplifier/controller (Trek, model 610E) was used for DCP and ACP. The voltage presented in this work for DCP is a peak voltage (Vpeak), while the voltage presented in this work for ACP is a root mean square voltage (Vrms) of the triangle voltage (Fig. 1b). The poling processes were carried out at ambient temperature in silicon oil to protect the samples. d33 of PIN–PT single crystals was measured using a quasi-static d33 meter (Chinese Academy of Sciences, Institute of Acoustics, ZJ-4AN, China). The free dielectric constant (ε33T/ε0) were measured by an impedance analyzer (Keysight Technologies, E4990A, Santa Clara, CA, USA). k33 was calculated from the resonance frequency (fr) and anti-resonance frequency (fa) according to IEEE standards. Piezo-response force microscopy (PFM, Asylum Research, Cypher ES, USA) was used to study the domain structure.
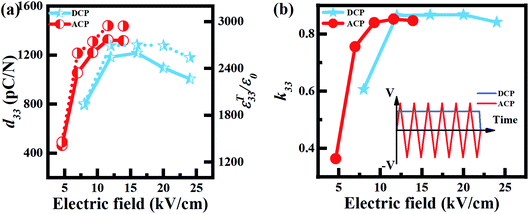 | ||
| Fig. 1 The (a) d33, ε33T/ε0, and (b) k33 values of DCP and ACP (10 Hz, 25 cycles) 0.66PIN–0.34PT single crystals as a function of the electric field. | ||
3. Results and discussion
3.1 Poling conditions
In the ACP process, the poling electric field, frequency and cycles can affect the piezoelectric performance and interact. The most important factor among the three is the electric field. Therefore, the influence of the electric field was firstly investigated in this work. In the process, the frequency and cycle were the fixed values (frequency: 10 Hz, cycle: 25), which refers to our experience and previous studies in PMN–PT and PIN–PMN–PT crystals. The influence of cycles was studied last because the cycles depend more on the electric field and frequency compared with other factors.Fig. 1 shows the d33, ε33T/ε0 and k33 of 0.66PIN–0.34PT crystals after DCP and ACP (10 Hz, 25 cycles) as a function of the electric field. The d33 and ε33T/ε0 of the DCP samples increased significantly from 790 pC N−1 to 1180 pC N−1, and 1950 to 2690, respectively, when the poling electric field increased from 8 to 12 kV cm−1. The d33 of the DCP samples decreased when the electric field increased above 16 kV cm−1. The optimal DCP conditions were 12–16 kV cm−1 (15 minutes). For the ACP samples, the maximum d33, ε33T/ε0 and k33 were 1320 pC N−1, 2950 and 85%, respectively, at an electric field of 11.6 kV cm−1, which was 11.9%, 9.7% and −2% higher than that of the DCP samples. Therefore, the optimal ACP root mean square electric field was 11.6 kV cm−1. Note that the variation of d33, ε33T/ε0 and k33 had a decreasing trend when the electric fields were too large. The electrostrictive effect is generated in the poling process because of the rotation of domains. The crystals are prone to micro-cracking if the poling electric field is too large, which is considered as an over-poling effect.25–27
Fig. 2 shows the d33, ε33T/ε0 and k33 of 0.66PIN–0.34PT crystals after DCP and ACP (11.6 kV cm−1, 25 cycles) as a function of frequency. The values of d33 and ε33T/ε0 increased dramatically from 1140 pC N−1 to 1400 pC N−1, and from 2620 to 3070, respectively when the poling frequency increased from 1 to 15 Hz. Further increasing the poling frequency, the d33, ε33T/ε0 gradually decreased. The values of d33 and ε33T/ε0 were 970 pC N−1 and 2150 using 40 Hz poling. For the k33-mode sample, the value of k33 of the 0.66PIN–0.34PT crystals decreased with increasing frequencies (Fig. 2b). The highest k33 was 86% at 1 Hz. The difference between the variation of k33 and d33 is related to the shape of the samples. The thickness of the k33 mode (5 mm) was much larger than that of the d33 sample (0.6 mm), which indicates that the frequency has a relatively large impact on the different thickness samples.28 Considering both the effect of the frequency on d33 and k33, the optimal poling frequency was 15 Hz. Compared with PMN–PT crystals, the piezoelectric and dielectric properties of 0.66PIN–0.34PT crystals after ACP are more dependent on frequency. The previous work revealed that the piezoelectric performances of PMN–PT and PIN–PMN–PT crystals can be significantly improved using low frequency ACP,29,30 while low frequency ACP does not show any good results for PIN–PT crystals. For PIN–PT crystals, it is hard to switch domains under and external field due its high coercive field. At a low frequency ACP, the domains can easily grow large, which further hinders domain switching. It is detrimental to rearrange domains and enhance the performance.
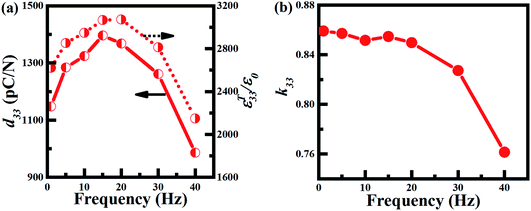 | ||
| Fig. 2 The d33, ε33T/ε0, and k33 values of ACP (11.6 kV cm−1, 25 cycles) 0.66PIN–0.34PT crystals as a function of frequency. | ||
Fig. 3 shows the d33, ε33T/ε0 and k33 of 0.66PIN–0.34PT crystals after DCP and ACP (15 Hz, 11.6 kV cm−1) as a function of cycle. The values of d33, ε33T/ε0 and k33 increased significantly from 690 pC N−1, 1660 and 66% to 1400 pC N−1, 3070 and 86%, respectively, when the ACP cycle increased from 5 to 25, and became invariant with a further increase of the ACP cycle. The optimal poling cycle was 25. The reported PMN–PT single crystals have the highest piezoelectric properties with poling cycles below 10.22 The ACP process can reduce the energy required for domain rotation, which makes domain rotation easy.28 The poling cycle is the process of the reduction of the energy required for domain rotation. Compared with PMN–PT crystals, the PIN–PT crystal required more energy for domain rotation due to its higher coercive field. Therefore, PIN–PT crystals need more poling cycles to obtain the maximum piezoelectric coefficient compared to those for PMN–PT crystals.
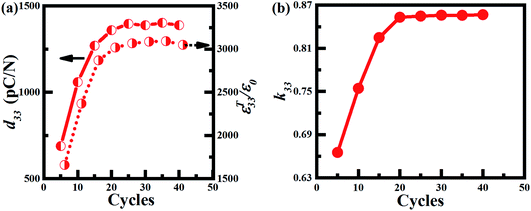 | ||
| Fig. 3 The d33, ε33T/ε0, and k33 values of ACP (15 Hz, 11.6 kV cm−1) 0.66PIN–0.34PT crystals as a function of the poling cycle number. | ||
Based on the above results, the d33 and ε33T/ε0 of 0.66PIN–0.34PT crystals can be enhanced using ACP. The optimal ACP conditions were 11.6 kV cm−1, 15 Hz and 25 cycles. Under these poling conditions, the d33, ε33T/ε0 and k33 of 0.66PIN–0.34PT crystals can achieve values of 1400 pC N−1, 3070, and 86%, respectively. Table 1 shows a comparison of the piezoelectric and dielectric properties of relaxor-PT crystals.8,21,22,31,32 Compared with relaxor-PT crystals with a low Ec (<6 kV cm−1), the enhancement ratio of ACP 0.66PIN–0.34PT crystals is not as high as for these crystals. Polarization switching can reflect the domain wall motions and opposite domain nucleation and growth in the ACP process.33 The PMN–PT crystals have a fast domain nucleation and growth due to their low coercive field.22 It is difficult to rearrange the domain structure of 0.66PIN–0.34PT crystals due to the large coercive field, resulting in the small enhancement after ACP.
| Material | Ec (kV cm−1) | Trt (°C) | TC (°C) | ε33T/ε0 DCP | ε33T/ε0 ACP | d33 (pC N−1) DCP | d33 (pC N−1) ACP | Difference (d33) | Ref. |
|---|---|---|---|---|---|---|---|---|---|
| 0.52PMN–0.15PYbN–0.33PT | 5.4 | 94 | 180 | 5200 | 6800 | 1770 | 2490 | 41% | 8 |
| 0.75PMN–0.25PT | 2.6 | 93 | 116 | — | 6397 | 1220 | 1730 | 42% | 22 |
| 0.7PMN–0.3PT | 2.3 | 90 | 130 | 6120 | 8140 | 1650 | 1980 | 20% | 21 |
| 0.72PMN–0.28PT | — | 80 | 132 | 7000 | 8900 | 1940 | 2650 | 37% | 31 |
| 0.25PIN–0.43PMN–0.32PT | — | 113 | 180 | 4800 | 7120 | 1700 | 2610 | 54% | 32 |
| 0.66PIN–0.34PT | 8.6 | 160 | 260 | 2690 | 3070 | 1180 | 1400 | 18% | This work |
3.2 Rayleigh analysis
The enhancement of piezoelectric and dielectric properties can be divided into the enhancement of intrinsic and extrinsic contributions. The intrinsic contribution originates from lattice distortion, while the extrinsic contribution originates from the domain wall and phase boundary motion. The degrees of intrinsic and extrinsic contributions can be well-distinguished by the Rayleigh law.34–37 the Rayleigh law can be expressed using the following formulas:38,39| P(E) = ε0(εinit + αE0)E ± α(E02 − E2)/2 | (1) |
| εr = εinit + αE0 | (2) |
| Extrinsic ratio = αE0/(εinit + αE0) | (3) |
Eqn (1) describes the Rayleigh hysteresis, where the signs “+” and “−” correspond to decreasing and increasing electric field, respectively. To avoid the switching of domains, E0 is selected far lower than half of the Ec. In this work, the E0 was 1–3 kV cm−1 and the extrinsic ratio was calculated at E0 of 1 kV cm−1. From the slope of the P–E at a low electric field, the value of εinit + αE0 can be expressed as:
| εr = εinit + αE0 = (Pmax − Pmin)/2(E0ε0) | (4) |
Fig. 4 shows the Rayleigh analysis of the 0.66PIN–0.34PT crystals under different electric fields. It can be easily obtained that the value of εr is linear with E0, suggesting that the Rayleigh law is applicable for 0.66PIN–0.34PT crystals with E0 from 1 to 3 kV cm−1. According to eqn (2), the intercept from the y axis represents εinit and the slope of the lines represents α. Hence, the values of εinit and αE0 were found to be 2788 and 209, respectively, for the DCP samples. The value of εinit was 2286 for the ACP samples under 6.96 kV cm−1, which was much smaller than that for the DCP samples. Further increasing the ACP electric field from 6.96 kV cm−1 to 11.6 kV cm−1, the values of εinit and αE0 all increased dramatically from 2286 and 214 to 2875 and 327, respectively, indicating that both the intrinsic and extrinsic contributions enhanced after ACP. The increment of the ratio of αE0/(εinit + αE0) indicates the obvious enhancement of the extrinsic contribution. The highest value of αE0/(εinit + αE0) was 0.102 at the poling electric field of 11.6 kV cm−1. It can be concluded that the extrinsic contribution is affected heavily by the ACP.
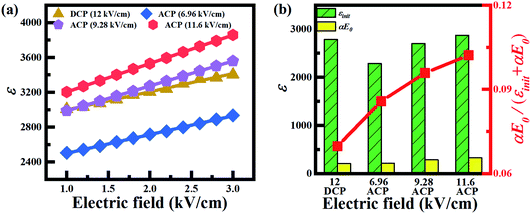 | ||
| Fig. 4 The Rayleigh analysis of DCP and ACP (10 Hz, 25 cycles) samples under different electric fields. | ||
Fig. 5 shows the Rayleigh analysis of 0.66PIN–0.34PT ACP samples under different poling frequencies. With the increase of the frequency from 1 Hz to 15 Hz, the intrinsic contribution εinit increased slightly from 2760 to 2919, while the extrinsic contribution αE0 exhibited a great improvement from 226 to 351, and the proportion of αE0/(εinit + αE0) increased significantly from 0.076 to 0.107. When the frequency exceeded 15 Hz, the values of εinit and αE0 began to decline. The values of εinit and αE0 were 2043 and 280, respectively, at 40 Hz, which were much smaller than those at 15 Hz. It can be concluded that a low ACP frequency has little effect on the intrinsic contribution. When the ACP frequency was high, both the intrinsic and extrinsic contributions declined significantly. Therefore, ACP of a moderate frequency is critical and necessary, such as 15 Hz in this work.
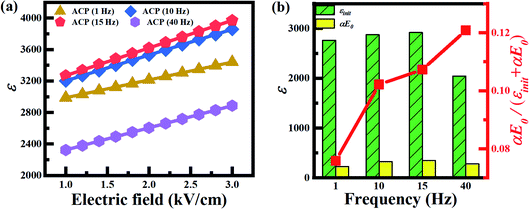 | ||
| Fig. 5 The Rayleigh analysis of ACP samples under different poling frequencies (11.6 kV cm−1, 25 cycles). | ||
Fig. 6 shows the Rayleigh analysis of 0.66PIN–0.34PT ACP samples under different poling cycles. When the cycles increased from 5 to 25, the intrinsic contribution εinit and the extrinsic contribution αE0, and the proportion of αE0/(εinit + αE0), increased from 1787, 152, 0.078 to 2919, 351 and 0.107, respectively. Then, the values of εinit, αE0, and αE0/(εinit + αE0) all became invariant when the cycles exceeded 25, indicating that the optimal poling cycle was 25 cycles.
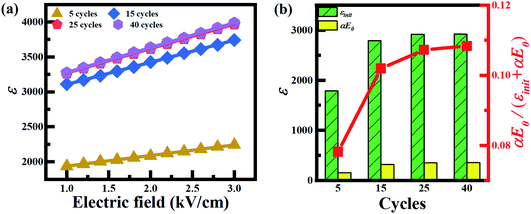 | ||
| Fig. 6 The Rayleigh analysis of ACP samples with different poling cycle numbers (15 Hz, 11.6 kV cm−1). | ||
The poling electric field, frequencies and cycles can influence the intrinsic and extrinsic parts of the ACP samples. The intrinsic contribution is significantly affected by the poling electric field and cycle, but it is not very sensitive to frequency, while the poling electric field, frequency and cycle is very important for the extrinsic contribution. The values of εinit, αE0 and αE0/(εinit + αE0) were 2919, 351 and 0.107, respectively, with an electric field of 11.6 kV cm−1, frequency of 15 Hz, and 25 cycles.
3.3 Domain structures
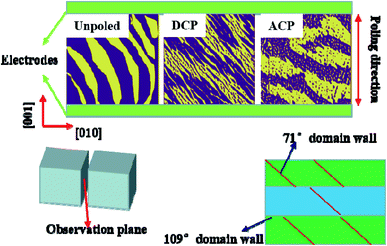
The enhancement of the piezoelectric and dielectric properties after ACP are related to the optimization of the domain morphologies.8,21,22,24 It should also be noted that 0.66PIN–0.34PT crystals have the rhombohedral perovskite phase. The ferroelectric crystals with the rhombohedral perovskite phase have eight spontaneous directions along 〈111〉. Poling along the 〈001〉 direction, the “4R” domain-engineered multi-domain structure is formed, exhibiting clear 109° and 71° domain walls.Fig. 7 shows the PFM results of the unpoled, DCP and ACP samples. The scan area is 20 × 20 μm2 for each image. The crystallographic orientation and poling direction are marked in Fig. 7. For the unpoled sample, PIN–PT crystals exhibit a clear domain boundary and the strip domain is aligned along the diagonal orientation. It is difficult to distinguish the 109° and 71° domains. The 109° and 71° domain walls can be easily distinguished due to the formation of the typical ‘4R’ domain configuration after poling. For DCP samples, the domain boundary between the 109° and 71° domain walls may form an irregular and overlapping domain structure. For ACP samples (11.6 kV cm−1, 15 Hz, 25 cycles), the 71° domain walls degrade and the 109° domain walls became clear and stable. The 109° domain walls tend to be perpendicular to the electric field direction and form regular stripe-like layered structures after ACP. The same results have also been confirmed in our previous work.8
The previous reported deemed that the high piezoelectricity was attributed to the high domain wall density of 71° domain walls.21 Different from those high-density 71° domain walls in ACP relaxor-PT single crystals, 0.66PIN–0.34PT crystals have a high density of regular 109° domain walls and a low density of 71° domain walls, which is closer to the simulations in PMN–PT systems.24 Therefore, the uniform and stripe like 109° domain wall patterns are a critical factor for the enhancement of piezoelectric properties via domain engineering.
4. Conclusions
The effects of ACP on 0.66PIN–0.34PT crystals were studied, including changing the electric field, frequency, and cycle number. The optimal ACP conditions are an electric field of 11.6 kV cm−1, a poling frequency of 15 Hz, and a cycle number of 25. The ε33T/ε0 and d33 values were 3070 and 1400 pC N−1, respectively, after ACP, which were about 14% and 18%, respectively, better than those of conventional DCP samples, while the k33 values of both DCP and ACP 0.66PIN–0.34PT crystals had the same level. Rayleigh analysis revealed that both the intrinsic and extrinsic contributions were enhanced after ACP. The poling electric field, frequency, and cycle number can influence the intrinsic and extrinsic contributions. The highly regular, uniform domain structure of the 109° domains and low density of the 71° domains were the obvious differences between unpoled, ACP, and DCP samples. The uniform and stripe like 109° domain wall patterns are a critical factor for the enhancement of the piezoelectric properties via domain engineering.Conflicts of interest
There are no conflicts to declare.Acknowledgements
This work was supported by the National Natural Science Foundation of China (11904362), the Strategic Priority Research Program of the Chinese Academy of Sciences (XDB20000000), the Science and Technology Project of Fujian Province (2020H0038, 2019H0052), and the Youth Innovation Promotion Association of the Chinese Academy of Sciences.References
- E. Sun and W. Cao, Prog. Mater. Sci., 2014, 65, 124–210 CrossRef CAS PubMed.
- S. Zhang, F. Li, X. Jiang, J. Kim, J. Luo and X. Geng, Prog. Mater. Sci., 2015, 68, 1–66 CrossRef CAS PubMed.
- S. Zhang and F. Li, J. Appl. Phys., 2012, 111, 031301 CrossRef.
- Z. Q. Duan, G. S. Xu, X. F. Wang, D. F. Yang, X. M. Pan and P. C. Wang, Solid State Commun., 2005, 134, 559–563 CrossRef CAS.
- C. He, X. Li, Z. Wang, Y. Liu, D. Shen, T. Li and X. Long, J. Alloys Compd., 2012, 539, 17–20 CrossRef CAS.
- X. Li, Z. Wang, C. He, Y. Liu, X. Long, S. Han and S. Pan, Mater. Lett., 2015, 143, 88–90 CrossRef CAS.
- C. Luo, W.-Y. Chang, M. Gao, C.-H. Chang, J. Li, D. Viehland, J. Tian and X. Jiang, Acta Mater., 2020, 182, 10–17 CrossRef CAS.
- C. He, T. Karaki, X. Yang, Y. Yamashita, Y. Sun and X. Long, Jpn. J. Appl. Phys., 2019, 58, SLLD06 CrossRef CAS.
- S. Wada and T. Tsurumi, Br. Ceram. Trans., 2004, 103, 93–96 CrossRef CAS.
- R. Ahluwalia, T. Lookman, A. Saxena and W. W. Cao, Phys. Rev. B: Condens. Matter Mater. Phys., 2005, 72, 014112 CrossRef.
- D. Lin, S. Zhang, Z. Li, F. Li, Z. Xu, S. Wada, J. Luo and T. R. Shrout, J. Appl. Phys., 2011, 110, 084110 CrossRef PubMed.
- Z. Yuan, S. Sang, E. Sun, X. Qi, W.-Y. Chang, R. Zhang, B. Yang, X. Jiang and W. Cao, Crystengcomm, 2018, 20, 4745–4751 RSC.
- F. Li, L. Wang, L. Jin, D. Lin, J. Li, Z. Li, Z. Xu and S. Zhang, IEEE Trans. Ultrason. Ferroelectrics Freq. Contr., 2015, 62, 18–32 Search PubMed.
- F. Li, M. J. Cabral, B. Xu, Z. Cheng, E. C. Dickey, J. M. LeBeau, J. Wang, J. Luo, S. Taylor, W. Hackenberger, L. Bellaiche, Z. Xu, L.-Q. Chen, T. R. Shrout and S. Zhang, Science, 2019, 364, 264–268 CrossRef CAS PubMed.
- M. Gao, C. Luo, W.-Y. Chang, C. M. Leung, J. Tian, J. Li, X. Jiang and D. Viehland, Acta Mater., 2019, 169, 28–35 CrossRef CAS.
- M. Davis, M. Budimir, D. Damjanovic and N. Setter, J. Appl. Phys., 2007, 101, 054112 CrossRef.
- F. Li, D. Lin, Z. Chen, Z. Cheng, J. Wang, C. Li, Z. Xu, Q. Huang, X. Liao, L.-Q. Chen, T. R. Shrout and S. Zhang, Nat. Mater., 2018, 17, 349–354 CrossRef CAS PubMed.
- F. Li, S. Zhang, Z. Xu, X. Wei and T. R. Shrout, Adv. Funct. Mater., 2011, 21, 2118–2128 CrossRef CAS PubMed.
- S. E. Park and T. R. Shrout, IEEE Trans. Ultrason. Ferroelectrics Freq. Contr., 1997, 44, 1140–1147 Search PubMed.
- Y. Yamashita, N. Yamamoto, Y. Hosono, K. Itsumi, US Pat., 20150372219, 2015 Search PubMed.
- W.-Y. Chang, C.-C. Chung, C. Luo, T. Kim, Y. Yamashita, J. L. Jones and X. Jiang, Mater. Res. Lett., 2018, 6, 537–544 CrossRef CAS.
- J. Xu, H. Deng, Z. Zeng, Z. Zhang, K. Zhao, J. Chen, N. Nakamori, F. Wang, J. Ma, X. Li and H. Luo, Appl. Phys. Lett., 2018, 112, 182901 CrossRef.
- C. Qiu, J. Liu, F. Li and Z. Xua, J. Appl. Phys., 2019, 125, 014102 CrossRef.
- C. Qiu, B. Wang, N. Zhang, S. Zhang, J. Liu, D. Walker, Y. Wang, H. Tian, T. R. Shrout, Z. Xu, L.-Q. Chen and F. Li, Nature, 2020, 577, 350–354 CrossRef CAS PubMed.
- F. Fang, W. Yang and X. Luo, J. Appl. Phys., 2009, 106, 094107 CrossRef.
- F. Fang, X. Luo and W. Yang, J. Am. Ceram. Soc., 2013, 96, 228–233 CrossRef CAS.
- M. Shanthi, K. H. Hoe, C. Y. H. Lim and L. C. Lim, Appl. Phys. Lett., 2005, 86, 262908 CrossRef.
- C. Luo, H. Wan, W.-Y. Chang, Y. Yamashita, A. R. Paterson, J. Jones and X. Jiang, Appl. Phys. Lett., 2019, 115, 192904 CrossRef.
- J. Liu, C. Qiu, L. Qiao, K. Song, H. Guo, Z. Xu and F. Li, J. Appl. Phys., 2020, 128, 094104 CrossRef CAS.
- C. Luo, T. Karaki, Y. Sun, Y. Yamashita and J. Xu, Jpn. J. Appl. Phys., 2020, 59, SPPD07 CrossRef CAS.
- Y. Sun, T. Karaki, T. Fujii and Y. Yamashita, Jpn. J. Appl. Phys., 2019, 58, SLLC06 CrossRef CAS.
- M. Ma, S. Xia, K. Song, H. Guo, S. Fan and Z. Li, J. Appl. Phys., 2020, 127, 064106 CrossRef CAS.
- Z. Chen, Y. Zhang, S. Li, X.-M. Lu and W. Cao, Appl. Phys. Lett., 2017, 110, 202904 CrossRef PubMed.
- F. Li, S. Zhang, Z. Xu, X. Wei, J. Luo and T. R. Shrout, J. Appl. Phys., 2010, 108, 034106 CrossRef PubMed.
- L. Yang, H. Fang, L. Zheng, J. Du, L. Wang, X. Lu, W. Lu, R. Zhang and W. Cao, Appl. Phys. Lett., 2019, 114, 232901 CrossRef.
- X. Huo, R. Zhang, L. Zheng, S. Zhang, R. Wang, J. Wang, S. Sang, B. Yang and W. Cao, J. Am. Ceram. Soc., 2015, 98, 1829–1835 CrossRef CAS PubMed.
- Q. Guo, F. Li, F. Xia, X. Gao, P. Wang, H. Hao, R. Sun, H. Liu and S. Zhang, ACS Appl. Mater. Interfaces, 2019, 11, 43359–43367 CrossRef CAS PubMed.
- R. E. Eitel, T. R. Shrout and C. A. Randall, J. Appl. Phys., 2006, 99, 124110 CrossRef.
- J. E. Garcia, R. Perez, D. A. Ochoa, A. Albareda, M. H. Lente and J. A. Eiras, J. Appl. Phys., 2008, 103, 054108 CrossRef.
- H. Fang, L. Wang, W. Kuai, J. Du, G. Jiang, X. Lu, M. Zhao, C. Wang, W. Su, L. Zheng, C. Wang and C. Wang, J. Am. Ceram. Soc., 2020, 103, 3257–3264 CrossRef CAS.
- M. Davis, D. Damjanovic and N. Setter, J. Appl. Phys., 2006, 100, 084103 CrossRef.
| This journal is © The Royal Society of Chemistry 2021 |

